


Android优化系列 http://blog.csdn.net/mwq30123/article/category/6638876
现在关于Android内存优化的文章已经很多。但是看完之后,还是一头雾水不知道怎么优化内存。
这篇文章的切入点是以一个案例去介绍内存优化工具使用。
文章简化了很多概念,旨在帮助你迅速的入门。项目case 地址:
https://github.com/AlvinScrp/PerformanceOptimizationCase/tree/master/memoryCase
内存检测的工具很多,其中AndroidStudio自带工具可以说是十分强大。
AndroidStudio 自带的 Memory Monitor(Allocation Tracking,HPROF Viewer and Analyzer)
以及 LeakCanary,MemoryAnalyzer, Dumpsys meminfo ...
我们从Memory Monitor开始。
初识Memory Monitor
打开AS (Android Studio 简称) ,导入,运行上述项目。下面图1是AS界面
1.找到 Memory Monitor:
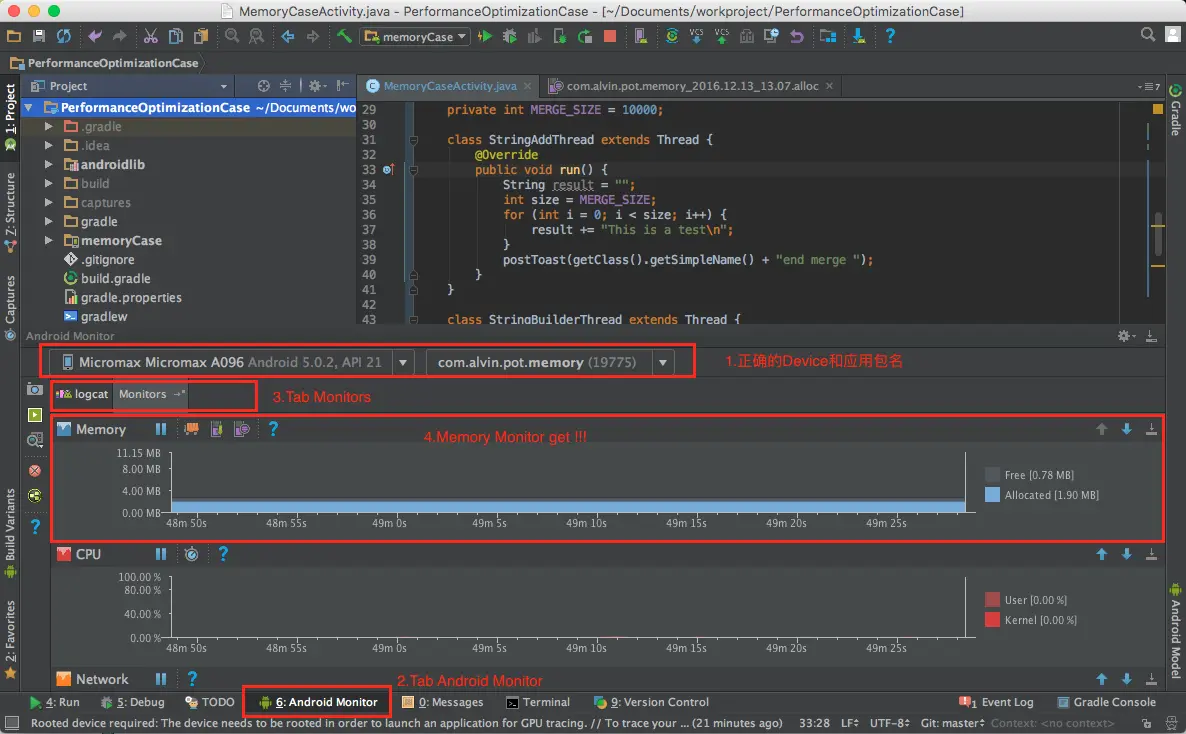
2.Memory操作按钮和展示区域。
Allocation Tracking
概述:分配跟踪,可以统计某时间段的内存分配情况。
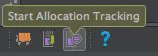
1.点击按钮. Start Allocation Tracking
2.运行程序中的 Allocation Tracking Case ,实际执行代码如下
String result ="";
int size =MERGE_SIZE; //MERGE_SIZE 10000
for(int i =0;i < size;i++) {
     result +="This is a test\n"; //42行
}
3.执行完成(程序会有toast,或者log),再次点击按钮 Stop Allocation Tracking

4.稍等片刻,我们便能看到如下界面
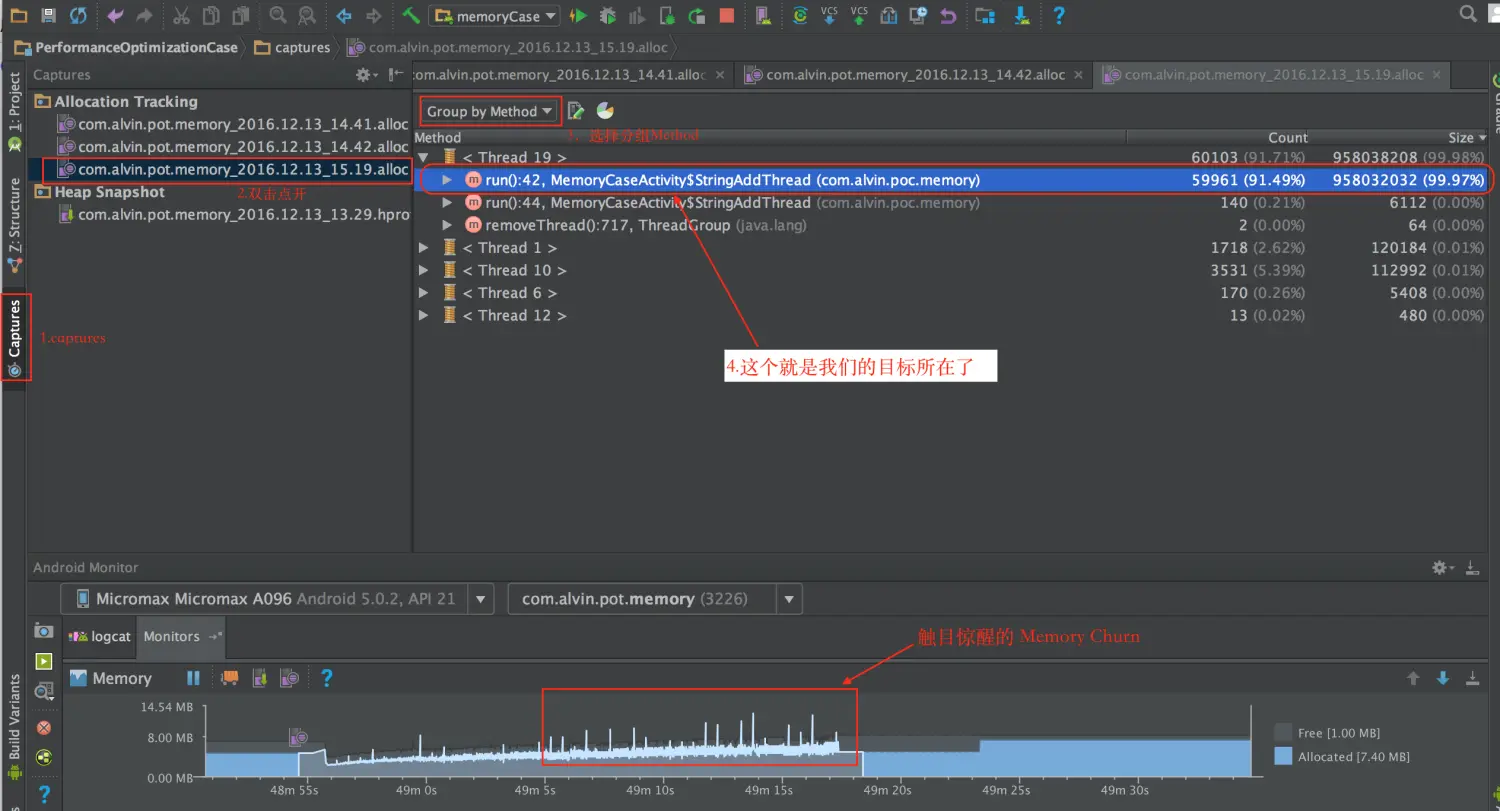
我们来分析上图含义。
run():42,MemoryCaseActivity$StringAddThread(com.alvin.poc.momory)
这段表明这个方法位于MemoryCaseActivity的内部类StringAddThread中,.java文件的第42行。
Count:59961(91.49%) Size :958032032(99.97%).
也就是说在第42行result +="This is a test\n",执行10000次,分配了59961个对象,占整个统计的91.49%。分配了958 032 032B(900M!)的内存。
定位到代码位置剩下的,就好解决啦!!!
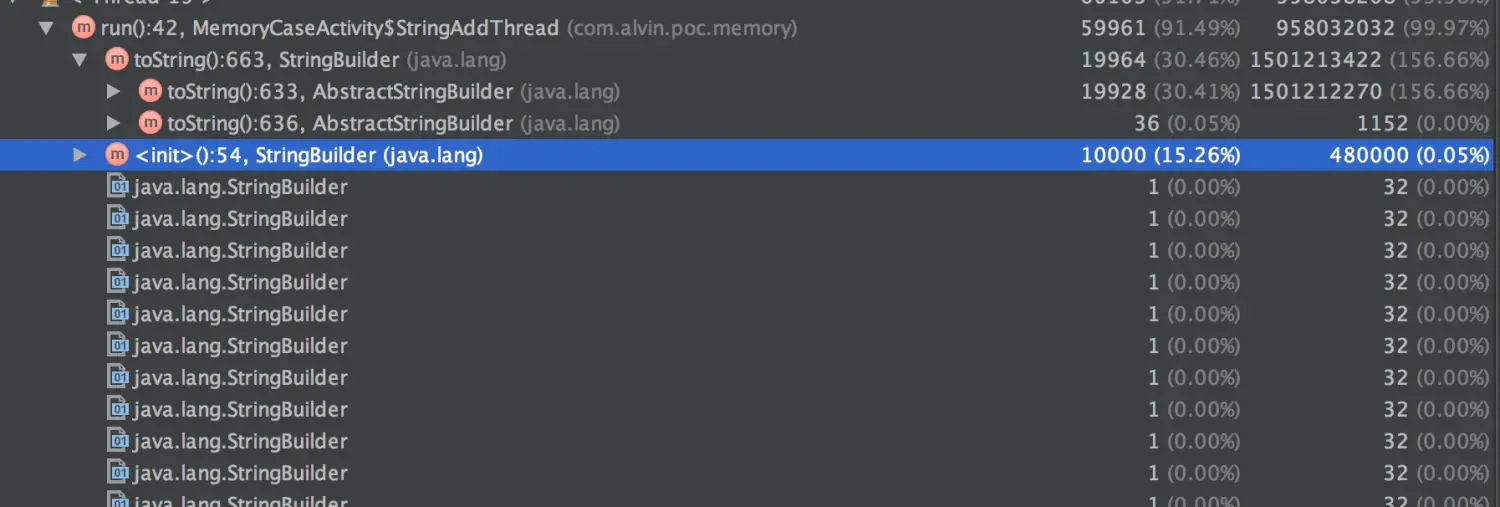
我们点开 run():42 可以看到如图, 这里涉及到result +="This is a test\n" 的实现,就不展开了。
顺便一提图中的 Memory Churn,发生这种突然的冲顶又回落,说明,我们的程序短时间内出现了大量的内存分配和释放情况。这个是必须要警惕和修改的。
初步的功能到此介绍完。你可以跑跑你自己的程序,看看内存都去哪了。
Allocation Tracker的功能远不止此,但最直接的使用便是这个。
更多的介绍参考
https://developer.android.com/studio/profile/am-allocation.htmlhttps://developer.android.com/studio/profile/am-allocation.html
后续我们再介绍 HPROF Viewer and Analyzer的使用。


 403
403


 被折叠的 条评论
为什么被折叠?
被折叠的 条评论
为什么被折叠?
 到【灌水乐园】发言


