


剧情提要:
[机器小伟]在[工程师阿伟]的陪同下进入练气期第四层功法的修炼,
这次要修炼的目标是[数据收集整理]。
10:19:33, 小伟拿着阿伟给他制作的统计类,开始了数据收集整理的修炼。
10:34:46, 做了这么多统计,小伟觉得已经掌握了这部分的功法内容。
[机器小伟]在[工程师阿伟]的陪同下进入练气期第四层功法的修炼,
这次要修炼的目标是[数据收集整理]。
正剧开始:
星历2016年01月05日 10:17:26, 银河系厄尔斯星球中华帝国江南行省。
[工程师阿伟]正在和[机器小伟]一起进行着数据的收集和整理,这应该是概率论与数理统
计的最初的一节了。
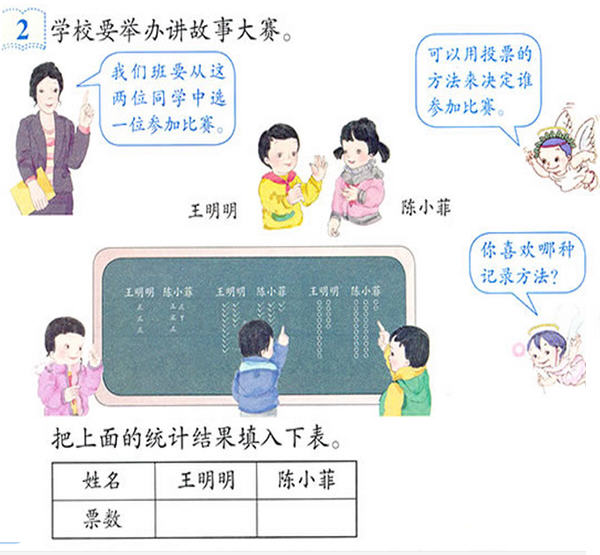
星历2016年01月05日 10:18:50, [工程师阿伟]说:由于以后会有越来越多的地方会用到统
计,所以我就先在这里给你做一个统计类吧,以后有了新的需要可以不断地添加亲函数。[机
器小伟]。
阿伟于是制作了统计类:
<span style="font-size:18px;">/**
* @usage   统计类
* @author  mw
* @date    2016年01月05日  星期二  10:14:34
* @param
* @return
*
*/
function Statistic() {
	this.statisticalSample = 0;
	this.sampleSize = 0;

	//初始化
	this.init = function(array) {
		this.statisticalSample = new Array();
		this.statisticalSample = array;
		this.sampleSize = this.statisticalSample.length;
	}

	//最大值
	this.max = function() {
		var max = Number.NEGATIVE_INFINITY;
		for (var i = 0; i < this.sampleSize; i++) {

			if (max < this.statisticalSample[i]) {
				max = this.statisticalSample[i];
			}
		}
		return max;
	}

	//最小值
	this.min = function() {
		var min = Number.POSITIVE_INFINITY;
		for (var i = 0; i < this.sampleSize; i++) {
			if (min > this.statisticalSample[i]) {
				min = this.statisticalSample[i];
			}
		}
		return min;
	}

	//样本数量
	this.size = function() {
		return this.sampleSize;
	}


}</span>
10:19:33, 小伟拿着阿伟给他制作的统计类,开始了数据收集整理的修炼。

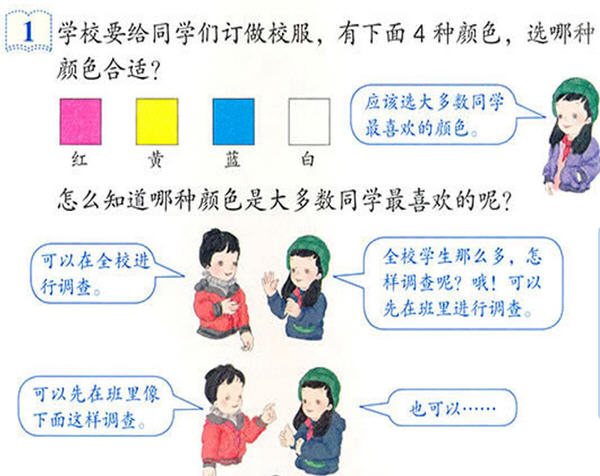
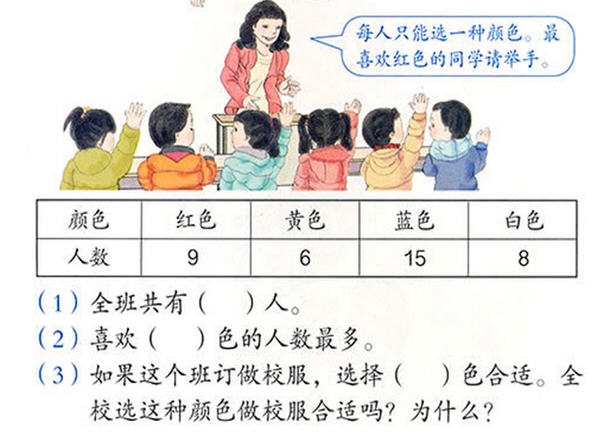
这个是小伟对校服的统计。
<span style="font-size:18px;">function myDraw() {
	plot.init();
	setPreference();

	plot.save();
	plot.translate(50, 350);
	axis(0, 0, 600);
	/*
		统计样本
		statistical sample
		统计个数
		Number of Statistics
		个数
		Number
		长度
		length
	*/
	var sample = [9,6,15,8];
	var color = ['red', 'yellow', 'blue', '#888888'];
	var text = ['红色', '黄色', '蓝色', '白色'];

	var height = 200, width = 300;

	var stat = new Statistic();
	stat.init(sample);

	var max = stat.max();
	var min = stat.min();


	var size = stat.size();
	var perH = Math.floor(height / (max+1));
	var perW = Math.floor(width / (size*1.5 - 1));
	var perDiff = -perH;

	plot.setStrokeStyle('#CCCCCC')
		.setTextAlign('right');
	for (var i = 0; i < 1.2 * max; i+=5) {
		if (i > 0) {
			plot.beginPath()
				.moveTo(0, 0+i * perDiff)
				.lineTo(width+100, 0 + i*perDiff)
				.closePath()
				.stroke();
		}


		plot.fillText((i).toFixed(0), -5, i*perDiff, 100);

	}
	plot.setTextAlign('left');
	for (var i = 0; i < size; i++) {
		plot.setFillStyle(color[i]);
		plot.fillRect(5+1.5*i*perW, 0, perW, -sample[i]*perH);
		plot.fillText(text[i], 5+(1.5 * i+0.2) * perW, -(sample[i]+1)*perH, 100);
	}


	plot.restore();

}</span>

<span style="font-size:18px;">function myDraw() {
plot.init();
setPreference();
plot.save();
plot.translate(50, 350);
axis(0, 0, 600);
/*
统计样本
statistical sample
统计个数
Number of Statistics
个数
Number
长度
length
*/
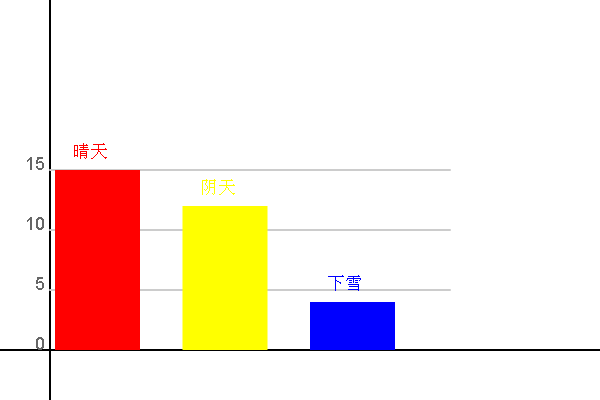
var sample = [15, 12, 4];
var color = ['red', 'yellow', 'blue', '#888888'];
var text = ['晴天', '阴天', '下雪'];
var height = 200, width = 300;
var stat = new Statistic();
stat.init(sample);
var max = stat.max();
var min = stat.min();
var size = stat.size();
var perH = Math.floor(height / (max+1));
var perW = Math.floor(width / (size*1.5 - 1));
var perDiff = -perH;
plot.setStrokeStyle('#CCCCCC')
.setTextAlign('right');
for (var i = 0; i < 1.2 * max; i+=5) {
if (i > 0) {
plot.beginPath()
.moveTo(0, 0+i * perDiff)
.lineTo(width+100, 0 + i*perDiff)
.closePath()
.stroke();
}
plot.fillText((i).toFixed(0), -5, i*perDiff, 100);
}
plot.setTextAlign('left');
for (var i = 0; i < size; i++) {
plot.setFillStyle(color[i]);
plot.fillRect(5+1.5*i*perW, 0, perW, -sample[i]*perH);
plot.fillText(text[i], 5+(1.5 * i+0.2) * perW, -(sample[i]+1)*perH, 100);
}
plot.restore();
}
</span>
<span style="font-size:18px;">function myDraw() {
plot.init();
setPreference();
plot.save();
plot.translate(50, 350);
axis(0, 0, 600);
/*
统计样本
statistical sample
统计个数
Number of Statistics
个数
Number
长度
length
*/
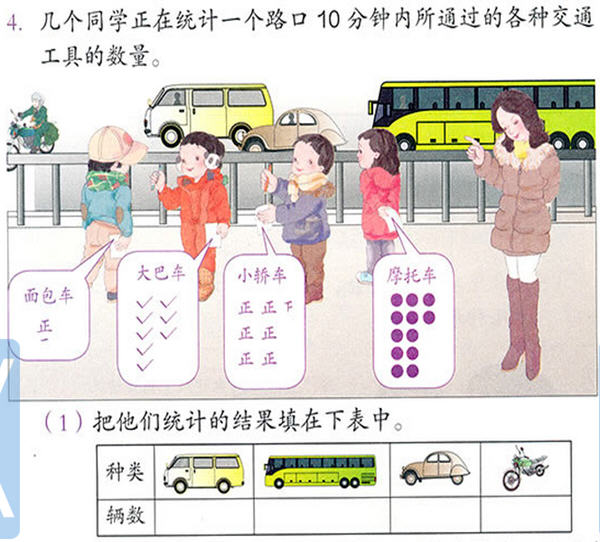
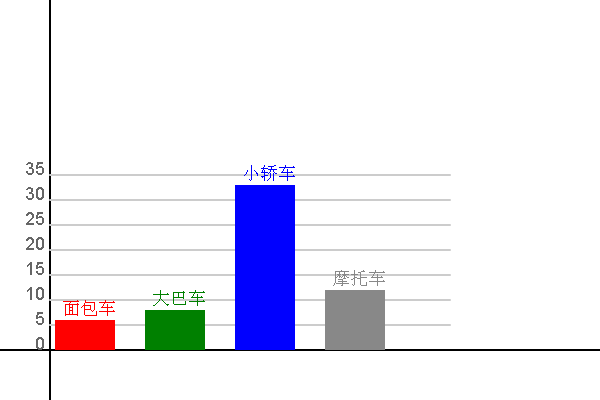
var sample = [6, 8, 33,12];
var color = ['red', 'green', 'blue', '#888888'];
var text = ['面包车', '大巴车', '小轿车','摩托车'];
var height = 200, width = 300;
var stat = new Statistic();
stat.init(sample);
var max = stat.max();
var min = stat.min();
var size = stat.size();
var perH = Math.floor(height / (max+1));
var perW = Math.floor(width / (size*1.5 - 1));
var perDiff = -perH;
plot.setStrokeStyle('#CCCCCC')
.setTextAlign('right');
for (var i = 0; i < 1.2 * max; i+=5) {
if (i > 0) {
plot.beginPath()
.moveTo(0, 0+i * perDiff)
.lineTo(width+100, 0 + i*perDiff)
.closePath()
.stroke();
}
plot.fillText((i).toFixed(0), -5, i*perDiff, 100);
}
plot.setTextAlign('left');
for (var i = 0; i < size; i++) {
plot.setFillStyle(color[i]);
plot.fillRect(5+1.5*i*perW, 0, perW, -sample[i]*perH);
plot.fillText(text[i], (1.5 * i+0.2) * perW, -(sample[i]+1)*perH, 100);
}
plot.restore();
}
</span>10:34:46, 做了这么多统计,小伟觉得已经掌握了这部分的功法内容。
本节到此结束,欲知后事如何,请看下回分解。


 105
105

 被折叠的 条评论
为什么被折叠?
被折叠的 条评论
为什么被折叠?
 到【灌水乐园】发言


