


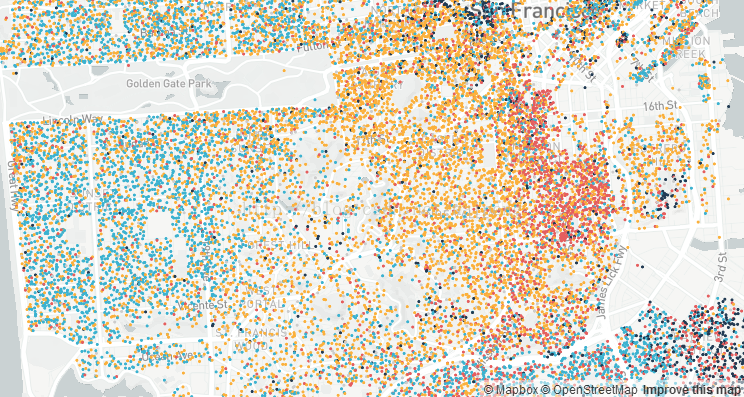
 本文介绍如何使用Mapbox GL JS实现基于不同族裔群体的数据驱动圈层颜色分类可视化。通过设置circle-color属性函数,根据不同族裔背景的人口统计数据调整地图上圆圈的颜色。
使用分类的circle-color属性函数实现可视化
<!DOCTYPE html>
<html>
<head>
    <meta charset='utf-8' />
    <title></title>
    <meta name='viewport' content='initial-scale=1,maximum-scale=1,user-scalable=no' />
    <script src='https://api.tiles.mapbox.com/mapbox-gl-js/v0.29.0/mapbox-gl.js'></script>
    <link href='https://api.tiles.mapbox.com/mapbox-gl-js/v0.29.0/mapbox-gl.css' rel='stylesheet' />
    <style>
        body { margin:0; padding:0; }
        #map { position:absolute; top:0; bottom:0; width:100%; }
    </style>
</head>
<body>

<div id='map'></div>
<script>
mapboxgl.accessToken = '<your access token here>';
var map = new mapboxgl.Map({
    container: 'map',
    style: 'mapbox://styles/mapbox/light-v9',
    zoom: 12,
    center: [-122.447303, 37.753574]
});

map.on('load', function () {    /* 添加load时间监听器 */
    map.addSource('population', {  /* source id */
        type: 'vector',            /* vector 类型资源 */
        url: 'mapbox://examples.8fgz4egr'
    });
    map.addLayer({
        'id': 'population',
        'type': 'circle',
        'source': 'population',
        'source-layer': 'sf2010',
        'paint': {
            // make circles larger as the user zooms from z12 to z22
            'circle-radius': {
                'base': 1.75,                  /* 增长曲线的指数基值,它控制函数输出增加的速率 */
                'stops': [[12, 2], [22, 180]]  /* Zoom Functions:zoom是12时circle-radius是2,zoom是22时circle-radius是180 */
            },
            // color circles by ethnicity, using data-driven styles
            'circle-color': {
                property: 'ethnicity',
                type: 'categorical',           /* 函数类型,categorical表示函数的输出的值等于函数的输入 */
                stops: [                       /* Property Functions ,circle-color根据property中属性的变化而变化*/
                    ['White', '#fbb03b'],
                    ['Black', '#223b53'],
                    ['Hispanic', '#e55e5e'],
                    ['Asian', '#3bb2d0'],
                    ['Other', '#ccc']]
            }
        }
    });
});
</script>

</body>
</html>
原文: https://www.mapbox.com/mapbox-gl-js/example/data-driven-circle-colors/


 被折叠的 条评论
为什么被折叠?
被折叠的 条评论
为什么被折叠?
 到【灌水乐园】发言


