


JVM参数配置
在我们整个JVM调优中,JVM的参数配置也必不可少,当我们使用给定的一些参数启动JVM,就可以在系统运行时打印相关日志,有利于出现分析实际问题。
-XX:+PrintGC:GC时打印日志。- 其中
-XX说明增加配置,+代表启用配置,如果不写或者写减号代表不启用配置
- 其中
-XX:+UseSerialGC:配置串行回收器- 垃圾回收会有单独的一个线程去负责垃圾回收,串行垃圾回收器是垃圾回收中的一种。
-XX:+PrintGCDetails:打印GC详细信息-Xms:初始堆大小-Xmx:最大堆大小-XX:+PrintCommandLineFlags:可以将隐式或者显示传给虚拟机的参数输出-XX:+HeapDumpOnOutOfMemoryError:发生OOM时生成dump文件-XX:HeapDumpPath:生成的dump文件存放路径-Xmn:设置新生代的大小- 设置一个比较大的新生代会减少老年代的大小,这个参数对系统性能以及GC行为有很大的影响,新生代大小一般会设置整个堆空间的1/3到1/4左右。
-XX:newRatio:设置新生代和老年代的比例- 新生代和老年代默认比例为1:2,若配置
-XX:NewRatio=3那新生代和老年代默认比例为1:3 - 如果配置为:
-Xms20m -Xmx20m -XX:NewRatio=3, 那么新生代大小=5MB(20÷4×1),老年代大小=15MB(20÷4×3)
- 新生代和老年代默认比例为1:2,若配置
-XX:SurvivorRatio:设置Eden区和survivor区的比例- 如果配置为:
-Xmn=1024m,-XX:SurvivorRatio=8那么Eden区和survivor区的比例为8:1:1,最终得出为Eden=819.2MB(1024÷10×8)、Survivor0=102.4MB(1024÷10×1)、Survivor1=102.4MB(1024÷10×1) - 如果配置为:
-Xmn=1024m,-XX:SurvivorRatio=3那么Eden区和survivor区的比例为3:1:1,最终得出为Eden=614.4MB(1024÷5×3)、Survivor0=204.8MB(1024÷5×1)、Survivor1=204.8MB(1024÷5×1)
- 如果配置为:
在实际工作中,我们可以直接将初始的堆大小与最大堆大小设置相等, 这样的好处是可以减少程序运行时的垃圾回收次数,从而提高性能。
1. Heap内存分配测试
- 编写测试类
public class JvmMemoryDistributeDemo {
    public static void main(String[] args) {

        // 运行时参数:-Xms5m -Xmx20m -XX:+PrintGCDetails -XX:+UseSerialGC -XX:+PrintCommandLineFlags

        // 查看GC信息
        System.err.println("maxMemory:"+Runtime.getRuntime().maxMemory());
        System.err.println("freeMemory:"+Runtime.getRuntime().freeMemory());
        System.err.println("totalMemory:"+Runtime.getRuntime().totalMemory());

        byte[] bytes = new byte[1 * 1024 * 1024];
        System.err.println("*************分配了1MB的内存*************");
        System.err.println("maxMemory:"+Runtime.getRuntime().maxMemory());
        System.err.println("freeMemory:"+Runtime.getRuntime().freeMemory());
        System.err.println("totalMemory:"+Runtime.getRuntime().totalMemory());

        byte[] bytes4 = new byte[4 * 1024 * 1024];
        System.err.println("*************分配了4MB的内存*************");
        System.err.println("maxMemory:"+Runtime.getRuntime().maxMemory());
        System.err.println("freeMemory:"+Runtime.getRuntime().freeMemory());
        System.err.println("totalMemory:"+Runtime.getRuntime().totalMemory());
    }
}
- 配置运行时JVM参数
- 在方法上鼠标右键,选择修改配置
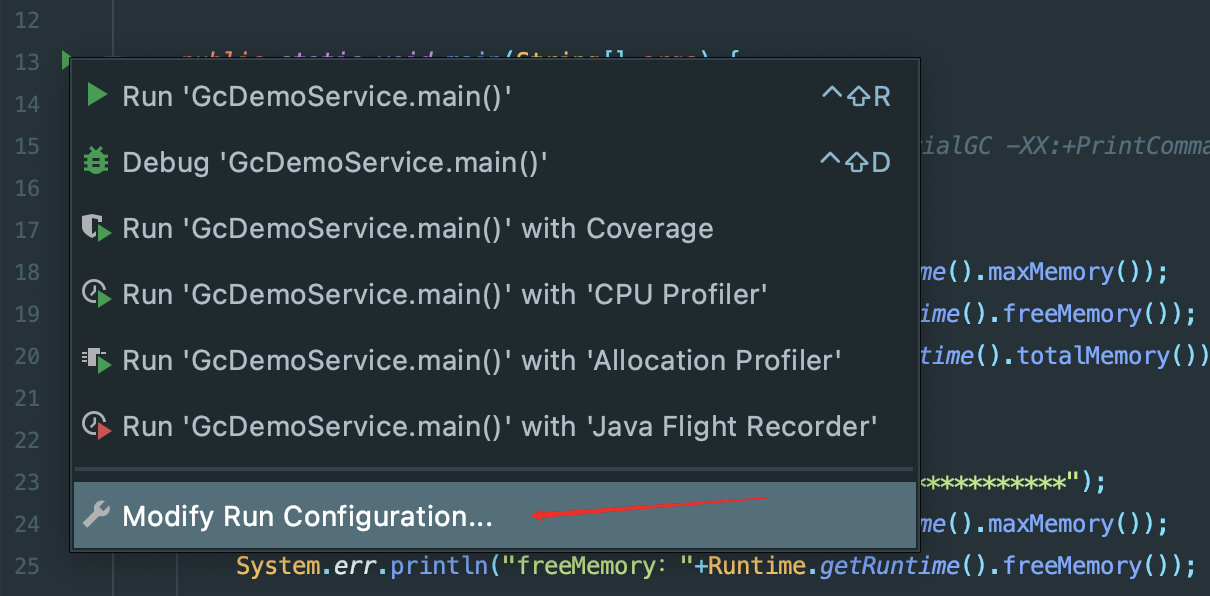
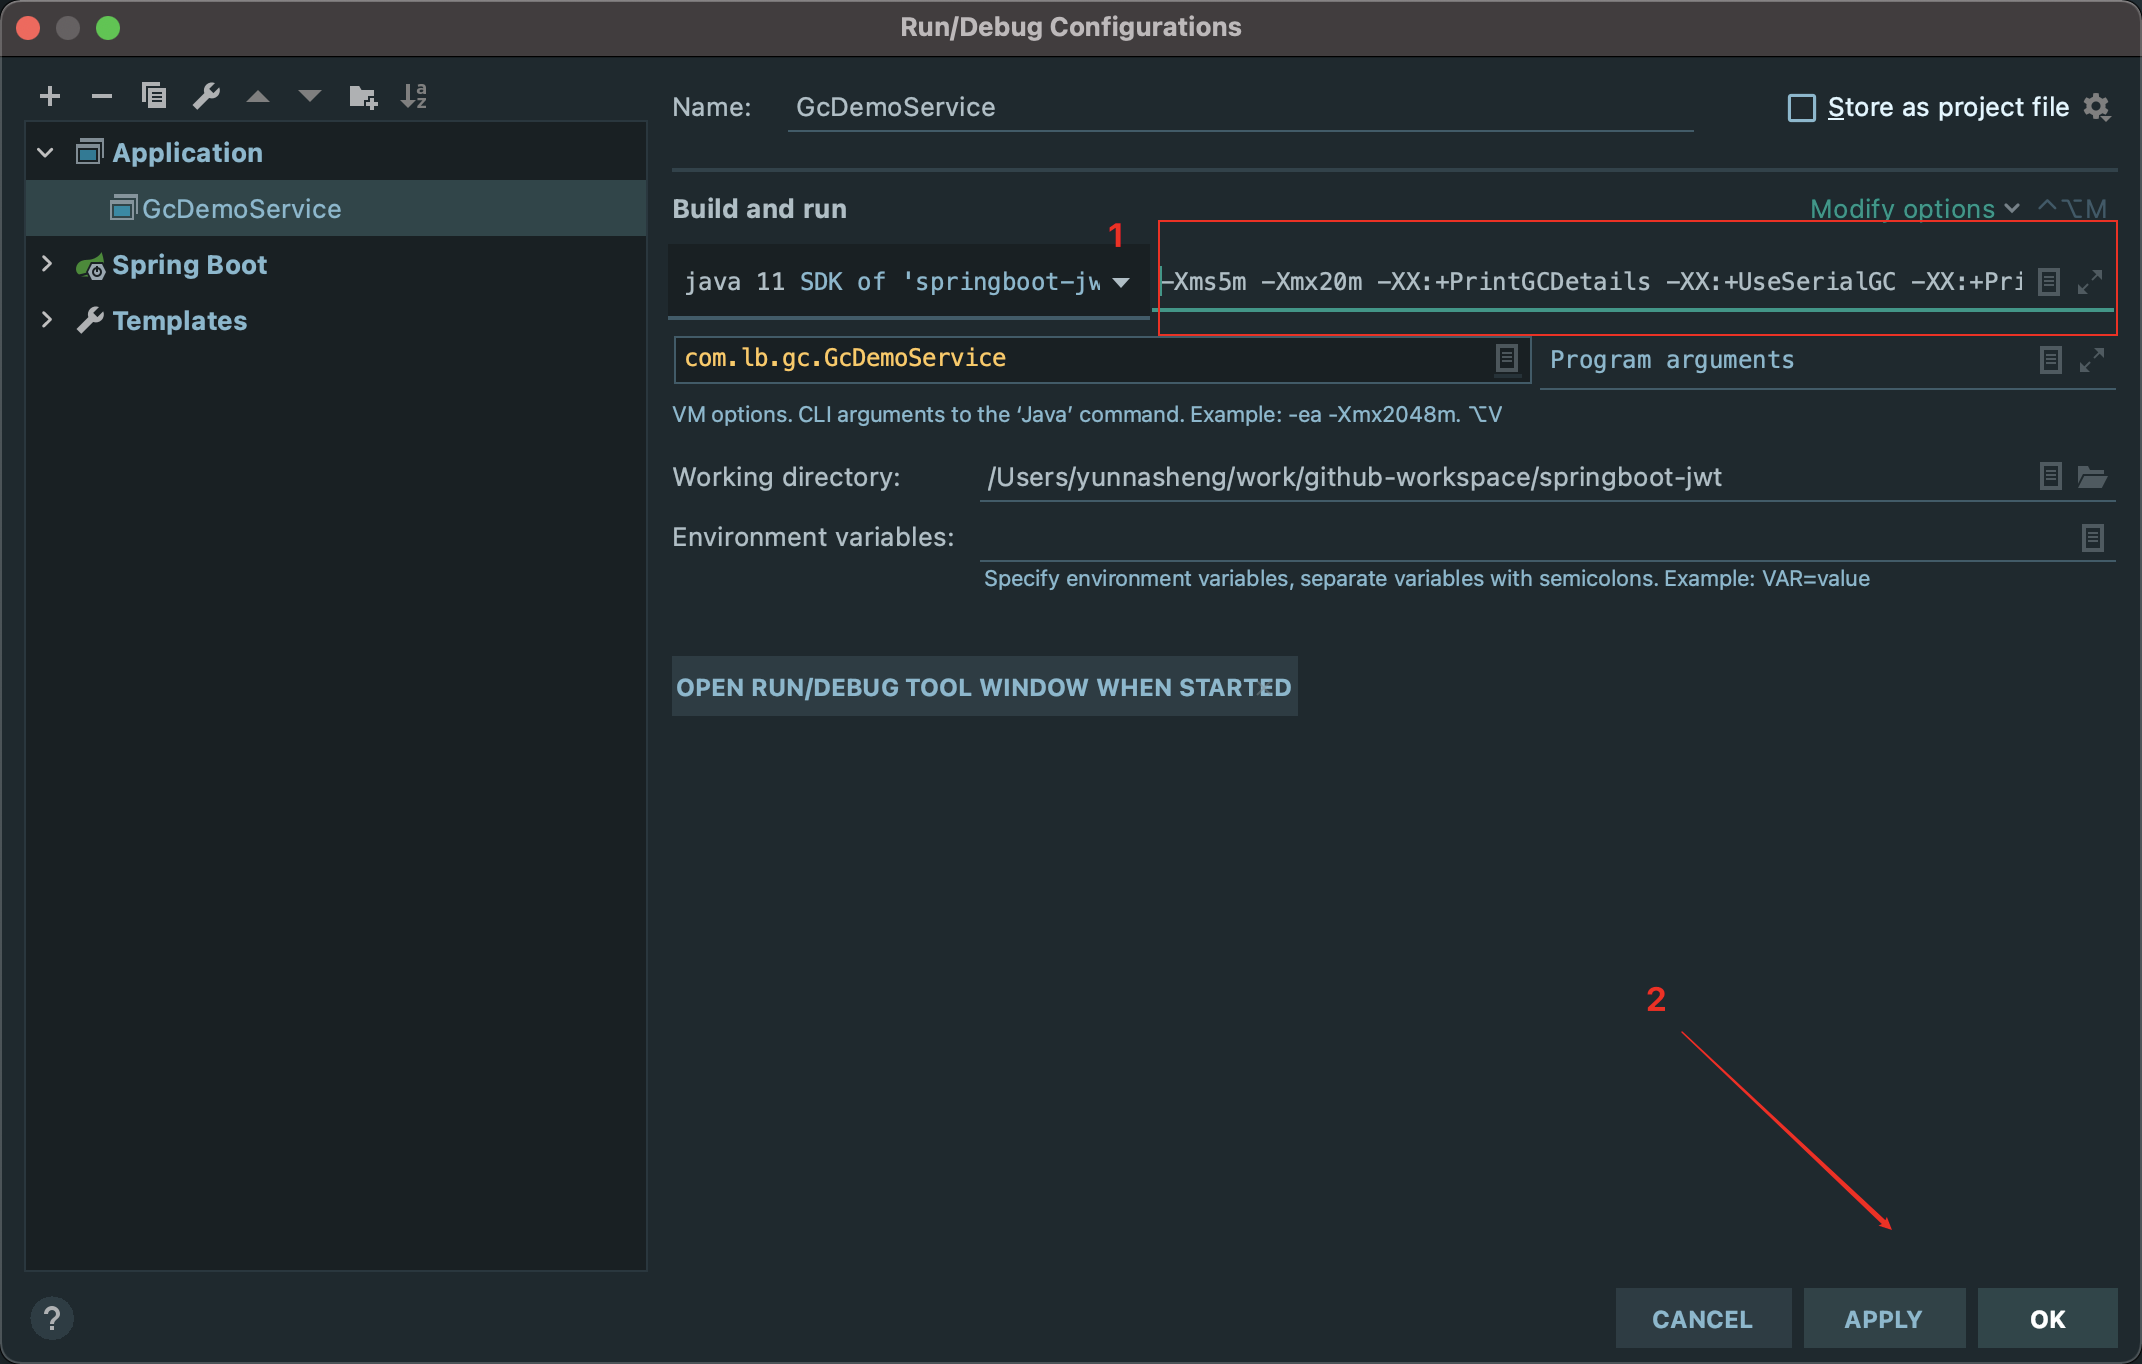
- 添加JVM参数
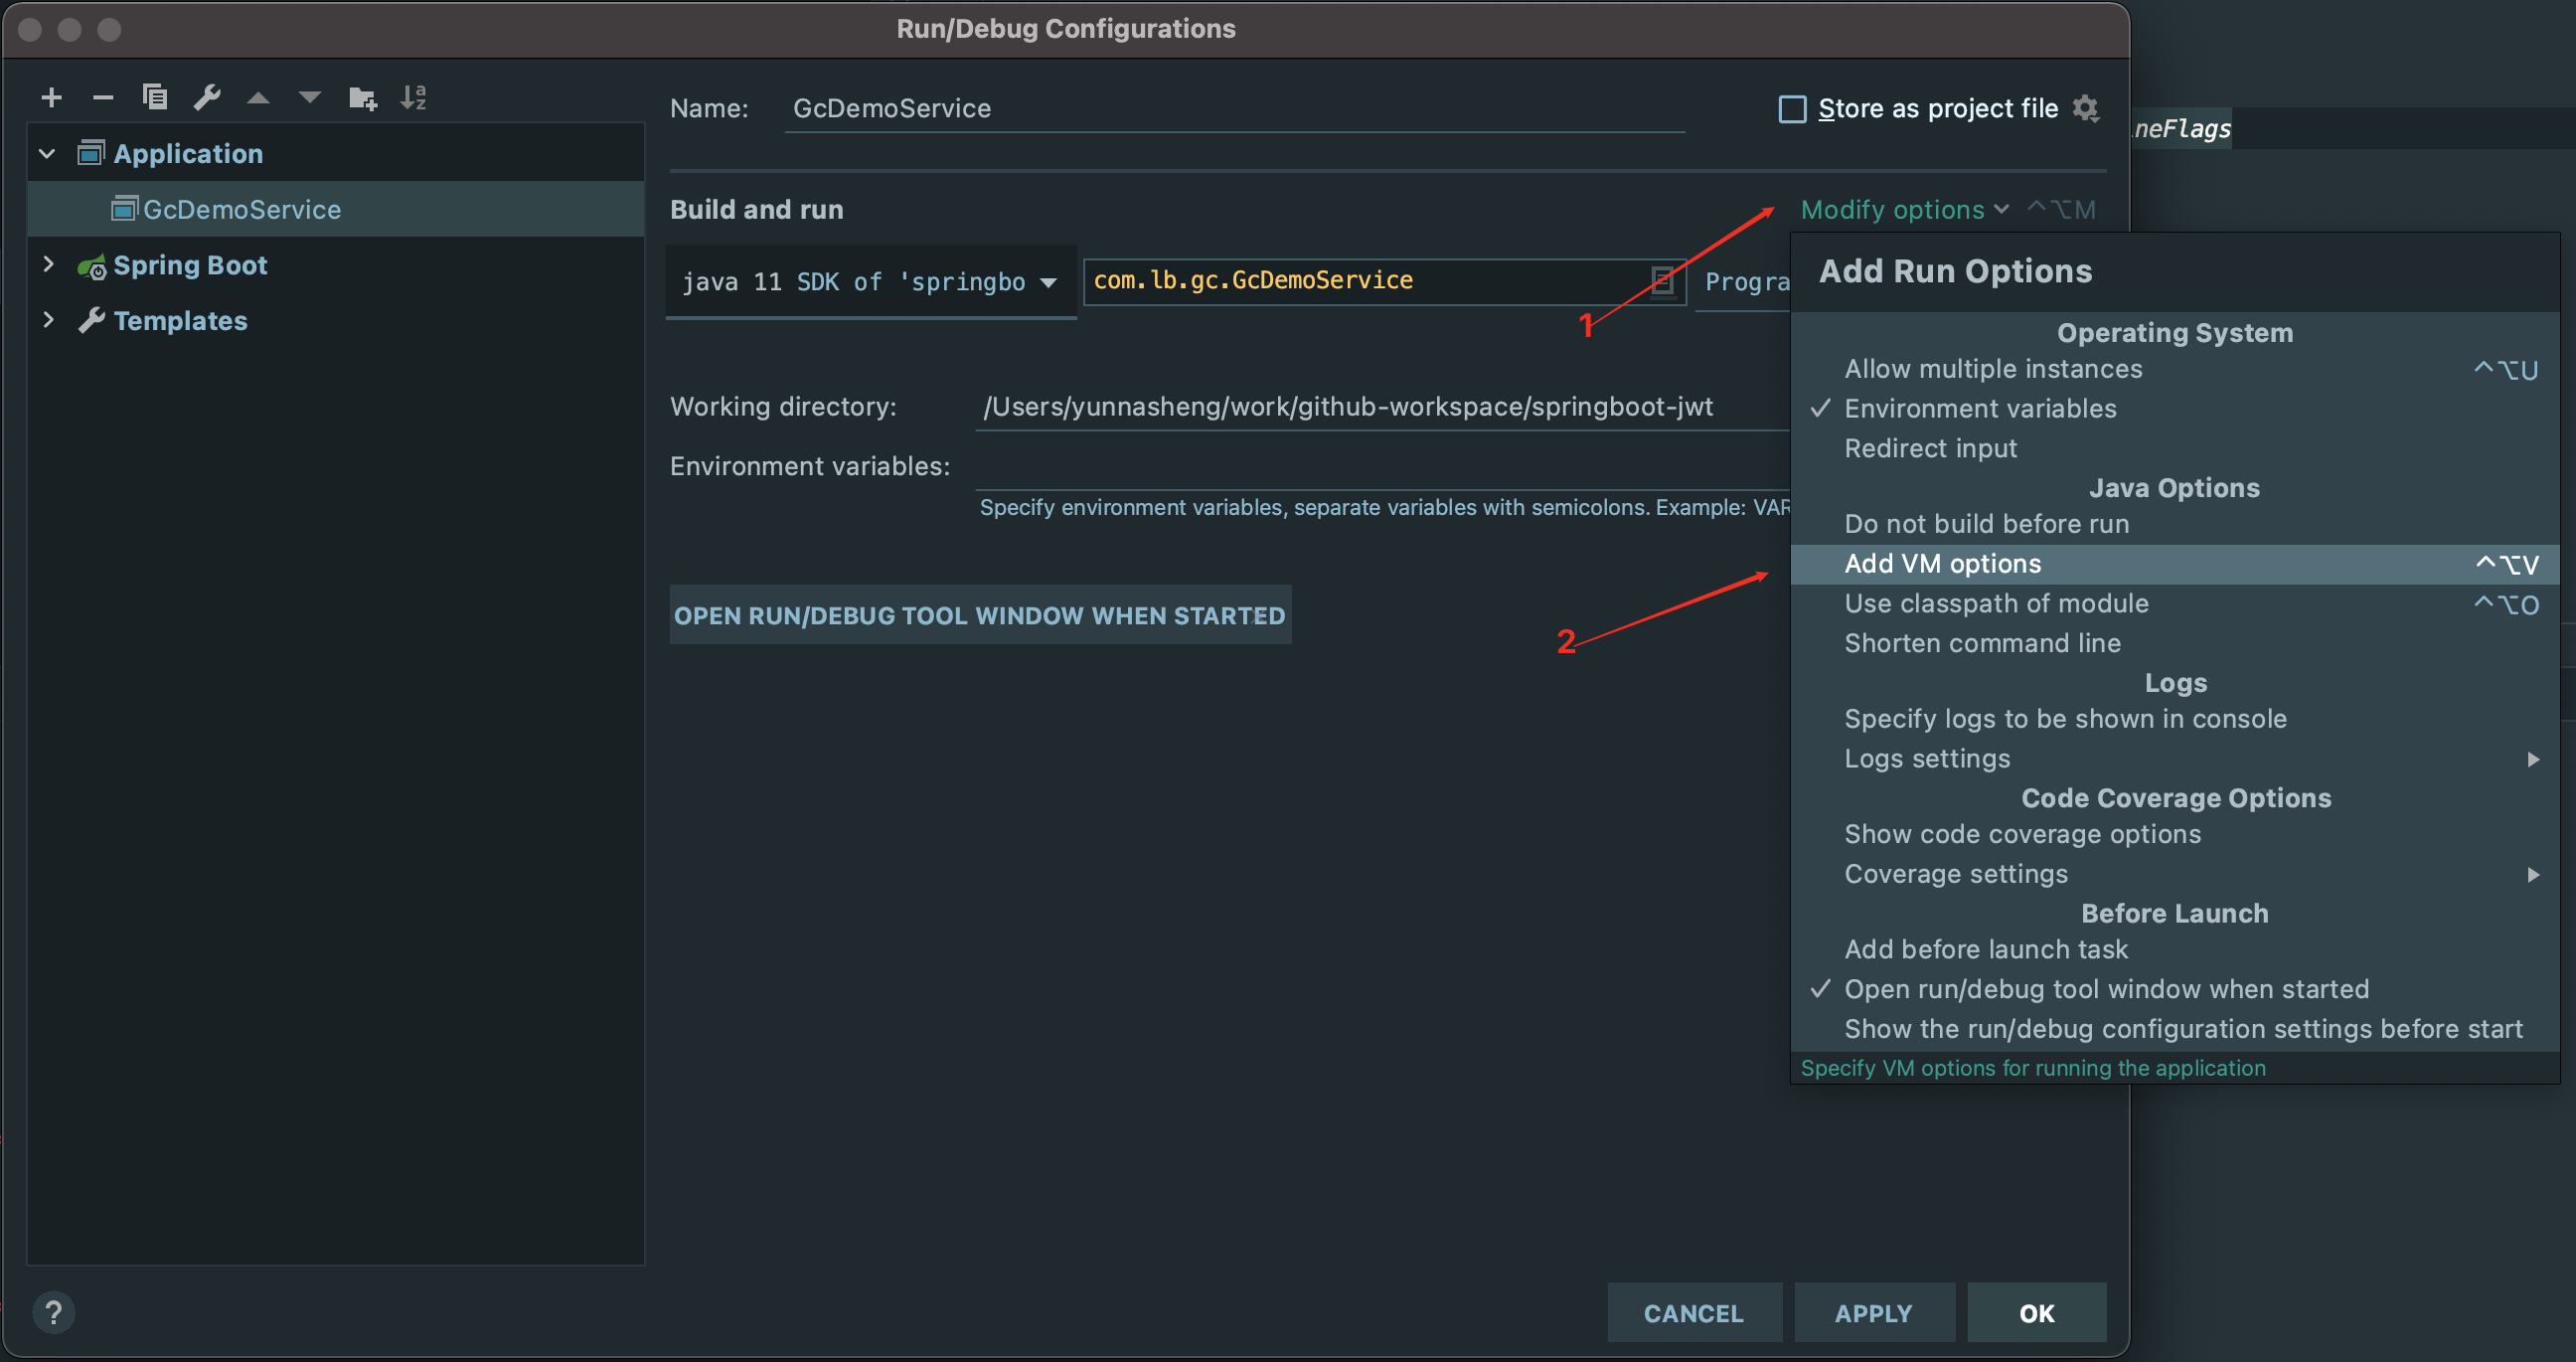
- 应用保存
- 运行结果
# 打印JVM配置参数
[0.004s][warning][gc] -XX:+PrintGCDetails is deprecated. Will use -Xlog:gc* instead.
-XX:InitialHeapSize=5242880 -XX:MaxHeapSize=20971520 -XX:+PrintCommandLineFlags -XX:+PrintGCDetails -XX:ReservedCodeCacheSize=251658240 -XX:+SegmentedCodeCache -XX:+UseCompressedClassPointers -XX:+UseCompressedOops -XX:+UseSerialGC
# 使用串行收集器
[0.010s][info   ][gc] Using Serial
# 堆空间地址,大小为20MB
[0.010s][info   ][gc,heap,coops] Heap address: 0x00000007fec00000, size: 20 MB, Compressed Oops mode: Zero based, Oop shift amount: 3
# 第一次GC ,是Young GC ,由于分配失败 ,执行暂停年轻代
[0.173s][info   ][gc,start     ] GC(0) Pause Young (Allocation Failure)
# 串行收集 ,收集前为1640K,收集后为192K
[0.174s][info   ][gc,heap      ] GC(0) DefNew: 1640K->192K(1856K)
# 老年代收集前为0K,收集后为679K
[0.174s][info   ][gc,heap      ] GC(0) Tenured: 0K->679K(4096K)
# 元数据区没有变化
[0.174s][info   ][gc,metaspace ] GC(0) Metaspace: 5691K->5691K(1056768K)
# 本次GC共收集了1MB的垃圾,耗时1.946ms
[0.174s][info   ][gc           ] GC(0) Pause Young (Allocation Failure) 1M->0M(5M) 1.946ms
# User:进程在用户态(User Mode)所花费的时间,只统计本进程所使用的时间,注意是指多核
# Sys:进程在核心态(Kernel Mode)花费的CPU时间量,指的是内核中的系统调用所花费的时间,只统计本进程所使用的时间
# Real:从开始到结束所花费的时间
[0.174s][info   ][gc,cpu       ] GC(0) User=0.01s Sys=0.00s Real=0.00s
# 第二次GC,Young GC
[0.191s][info   ][gc,start     ] GC(1) Pause Young (Allocation Failure)
[0.193s][info   ][gc,heap      ] GC(1) DefNew: 1762K->192K(1856K)
[0.193s][info   ][gc,heap      ] GC(1) Tenured: 679K->1985K(4096K)
[0.193s][info   ][gc,metaspace ] GC(1) Metaspace: 5759K->5759K(1056768K)
[0.193s][info   ][gc           ] GC(1) Pause Young (Allocation Failure) 2M->2M(5M) 1.616ms
[0.193s][info   ][gc,cpu       ] GC(1) User=0.00s Sys=0.00s Real=0.01s
# 第三次GC,Young GC
[0.202s][info   ][gc,start     ] GC(2) Pause Young (Allocation Failure)
maxMemory:20316160
freeMemory:3621424
totalMemory:6094848
*************分配了1MB的内存*************
maxMemory:20316160
freeMemory:2572832
totalMemory:6094848
*************分配了4MB的内存*************
maxMemory:20316160
freeMemory:4847976
totalMemory:12546048
# 第四次GC,发生Full GC
[0.203s][info   ][gc,start     ] GC(3) Pause Full (Allocation Failure)
# 第一阶段,标记存活的的对象
[0.203s][info   ][gc,phases,start] GC(3) Phase 1: Mark live objects
[0.204s][info   ][gc,phases      ] GC(3) Phase 1: Mark live objects 1.419ms
# 第二阶段,计算新对象地址
[0.204s][info   ][gc,phases,start] GC(3) Phase 2: Compute new object addresses
[0.204s][info   ][gc,phases      ] GC(3) Phase 2: Compute new object addresses 0.221ms
# 第三阶段,调整指针
[0.204s][info   ][gc,phases,start] GC(3) Phase 3: Adjust pointers
[0.205s][info   ][gc,phases      ] GC(3) Phase 3: Adjust pointers 0.737ms
# 第四阶段,移动对象
[0.205s][info   ][gc,phases,start] GC(3) Phase 4: Move objects
[0.205s][info   ][gc,phases      ] GC(3) Phase 4: Move objects 0.083ms
[0.205s][info   ][gc             ] GC(3) Pause Full (Allocation Failure) 3M->3M(5M) 2.565ms
[0.205s][info   ][gc,heap        ] GC(2) DefNew: 1453K->0K(1856K)
[0.205s][info   ][gc,heap        ] GC(2) Tenured: 1985K->3353K(4096K)
[0.205s][info   ][gc,metaspace   ] GC(2) Metaspace: 6129K->6129K(1056768K)
[0.205s][info   ][gc             ] GC(2) Pause Young (Allocation Failure) 3M->3M(7M) 3.603ms
[0.205s][info   ][gc,cpu         ] GC(2) User=0.01s Sys=0.00s Real=0.00s
# 所有GC完成,堆内存变化情况
[0.208s][info   ][gc,heap,exit   ] Heap
#  年轻代
[0.208s][info   ][gc,heap,exit   ]  def new generation   total 2560K, used 91K [0x00000007fec00000, 0x00000007feec0000, 0x00000007ff2a0000)
# 年轻代的eden区
[0.208s][info   ][gc,heap,exit   ]   eden space 2304K,   3% used [0x00000007fec00000, 0x00000007fec16c48, 0x00000007fee40000)
# 年轻代的from区
[0.208s][info   ][gc,heap,exit   ]   from space 256K,   0% used [0x00000007fee40000, 0x00000007fee40000, 0x00000007fee80000)
# 年轻代的to区
[0.208s][info   ][gc,heap,exit   ]   to   space 256K,   0% used [0x00000007fee80000, 0x00000007fee80000, 0x00000007feec0000)
# 老年代
[0.208s][info   ][gc,heap,exit   ]  tenured generation   total 9692K, used 7449K [0x00000007ff2a0000, 0x00000007ffc17000, 0x0000000800000000)
[0.208s][info   ][gc,heap,exit   ]    the space 9692K,  76% used [0x00000007ff2a0000, 0x00000007ff9e67f0, 0x00000007ff9e6800, 0x00000007ffc17000)
# 元数据区
[0.208s][info   ][gc,heap,exit   ]  Metaspace       used 6241K, capacity 6319K, committed 6528K, reserved 1056768K
# 压缩空间,即Compressed class space
[0.208s][info   ][gc,heap,exit   ]   class space    used 536K, capacity 570K, committed 640K, reserved 1048576K
2.内存溢出测试
- 编写测试代码
public class JvmOutOfMemoryDemo {
   // 一直持有,让GC释放不掉
    private static final List<byte[]> holderList = new ArrayList<>();

    public static void main(String[] args) {

        // TODO 第一次测试
        // 分配最小内存和最大内存一直,设置串行收集
        // -Xms20m -Xmx20m -XX:+PrintGCDetails -XX:+UseSerialGC -XX:+PrintCommandLineFlags

        // 导致多次GC,甚至Full GC,最终抛出
        // Exception: java.lang.OutOfMemoryError thrown from the UncaughtExceptionHandler in thread "main"
        // Exception in thread "Monitor Ctrl-Break" java.lang.OutOfMemoryError: Java heap space

        while (true){
            byte[] bytes = new byte[1 * 1024];
            // 持续添加1MB的字节数组,导致内存溢出
            holderList.add(bytes);
        }

    }
}
- 运行结果
# 这里省略N次GC日志,直接看堆信息
[0.305s][info   ][gc,heap,exit   ] Heap
[0.305s][info   ][gc,heap,exit   ]  def new generation   total 6144K, used 6141K [0x00000007fec00000, 0x00000007ff2a0000, 0x00000007ff2a0000)
[0.305s][info   ][gc,heap,exit   ]   eden space 5504K,  99% used [0x00000007fec00000, 0x00000007ff15fff8, 0x00000007ff160000)
[0.305s][info   ][gc,heap,exit   ]   from space 640K,  99% used [0x00000007ff160000, 0x00000007ff1ff5a0, 0x00000007ff200000)
[0.305s][info   ][gc,heap,exit   ]   to   space 640K,   0% used [0x00000007ff200000, 0x00000007ff200000, 0x00000007ff2a0000)
[0.305s][info   ][gc,heap,exit   ]  tenured generation   total 13696K, used 13695K [0x00000007ff2a0000, 0x0000000800000000, 0x0000000800000000)
[0.305s][info   ][gc,heap,exit   ]    the space 13696K,  99% used [0x00000007ff2a0000, 0x00000007ffffff60, 0x0000000800000000, 0x0000000800000000)
[0.305s][info   ][gc,heap,exit   ]  Metaspace       used 6265K, capacity 6315K, committed 6528K, reserved 1056768K
[0.305s][info   ][gc,heap,exit   ]   class space    used 543K, capacity 570K, committed 640K, reserved 1048576K
# 最终抛出内存溢出异常
Exception: java.lang.OutOfMemoryError thrown from the UncaughtExceptionHandler in thread "main"
Exception in thread "Monitor Ctrl-Break" java.lang.OutOfMemoryError: Java heap space
- 增加如下配置,再次测试
-XX:+HeapDumpOnOutOfMemoryError -XX:HeapDumpPath=/Users/yunnasheng/Desktop
- +HeapDumpOnOutOfMemoryError:发生OOM时生成dump文件
- HeapDumpPath=/Users/yunnasheng/Desktop:生成dump文件路径地址 运行程序,查看生成的文件会发现有个后缀为
.hprof的文件,这个文件就是dump文件
 yunnasheng@yunnashengdeMacBook-Pro  ~/Desktop  pwd
/Users/yunnasheng/Desktop
 yunnasheng@yunnashengdeMacBook-Pro  ~/Desktop  ls
 java_pid9167.hprof
3.分析dump文件
利用Eclipse的Memory Analyze插件分析dump文件
- 打开dump文件 下载好插件以后,把 dump文件——
java_pid9167.hprof拖拽到我们项目的resources目录下
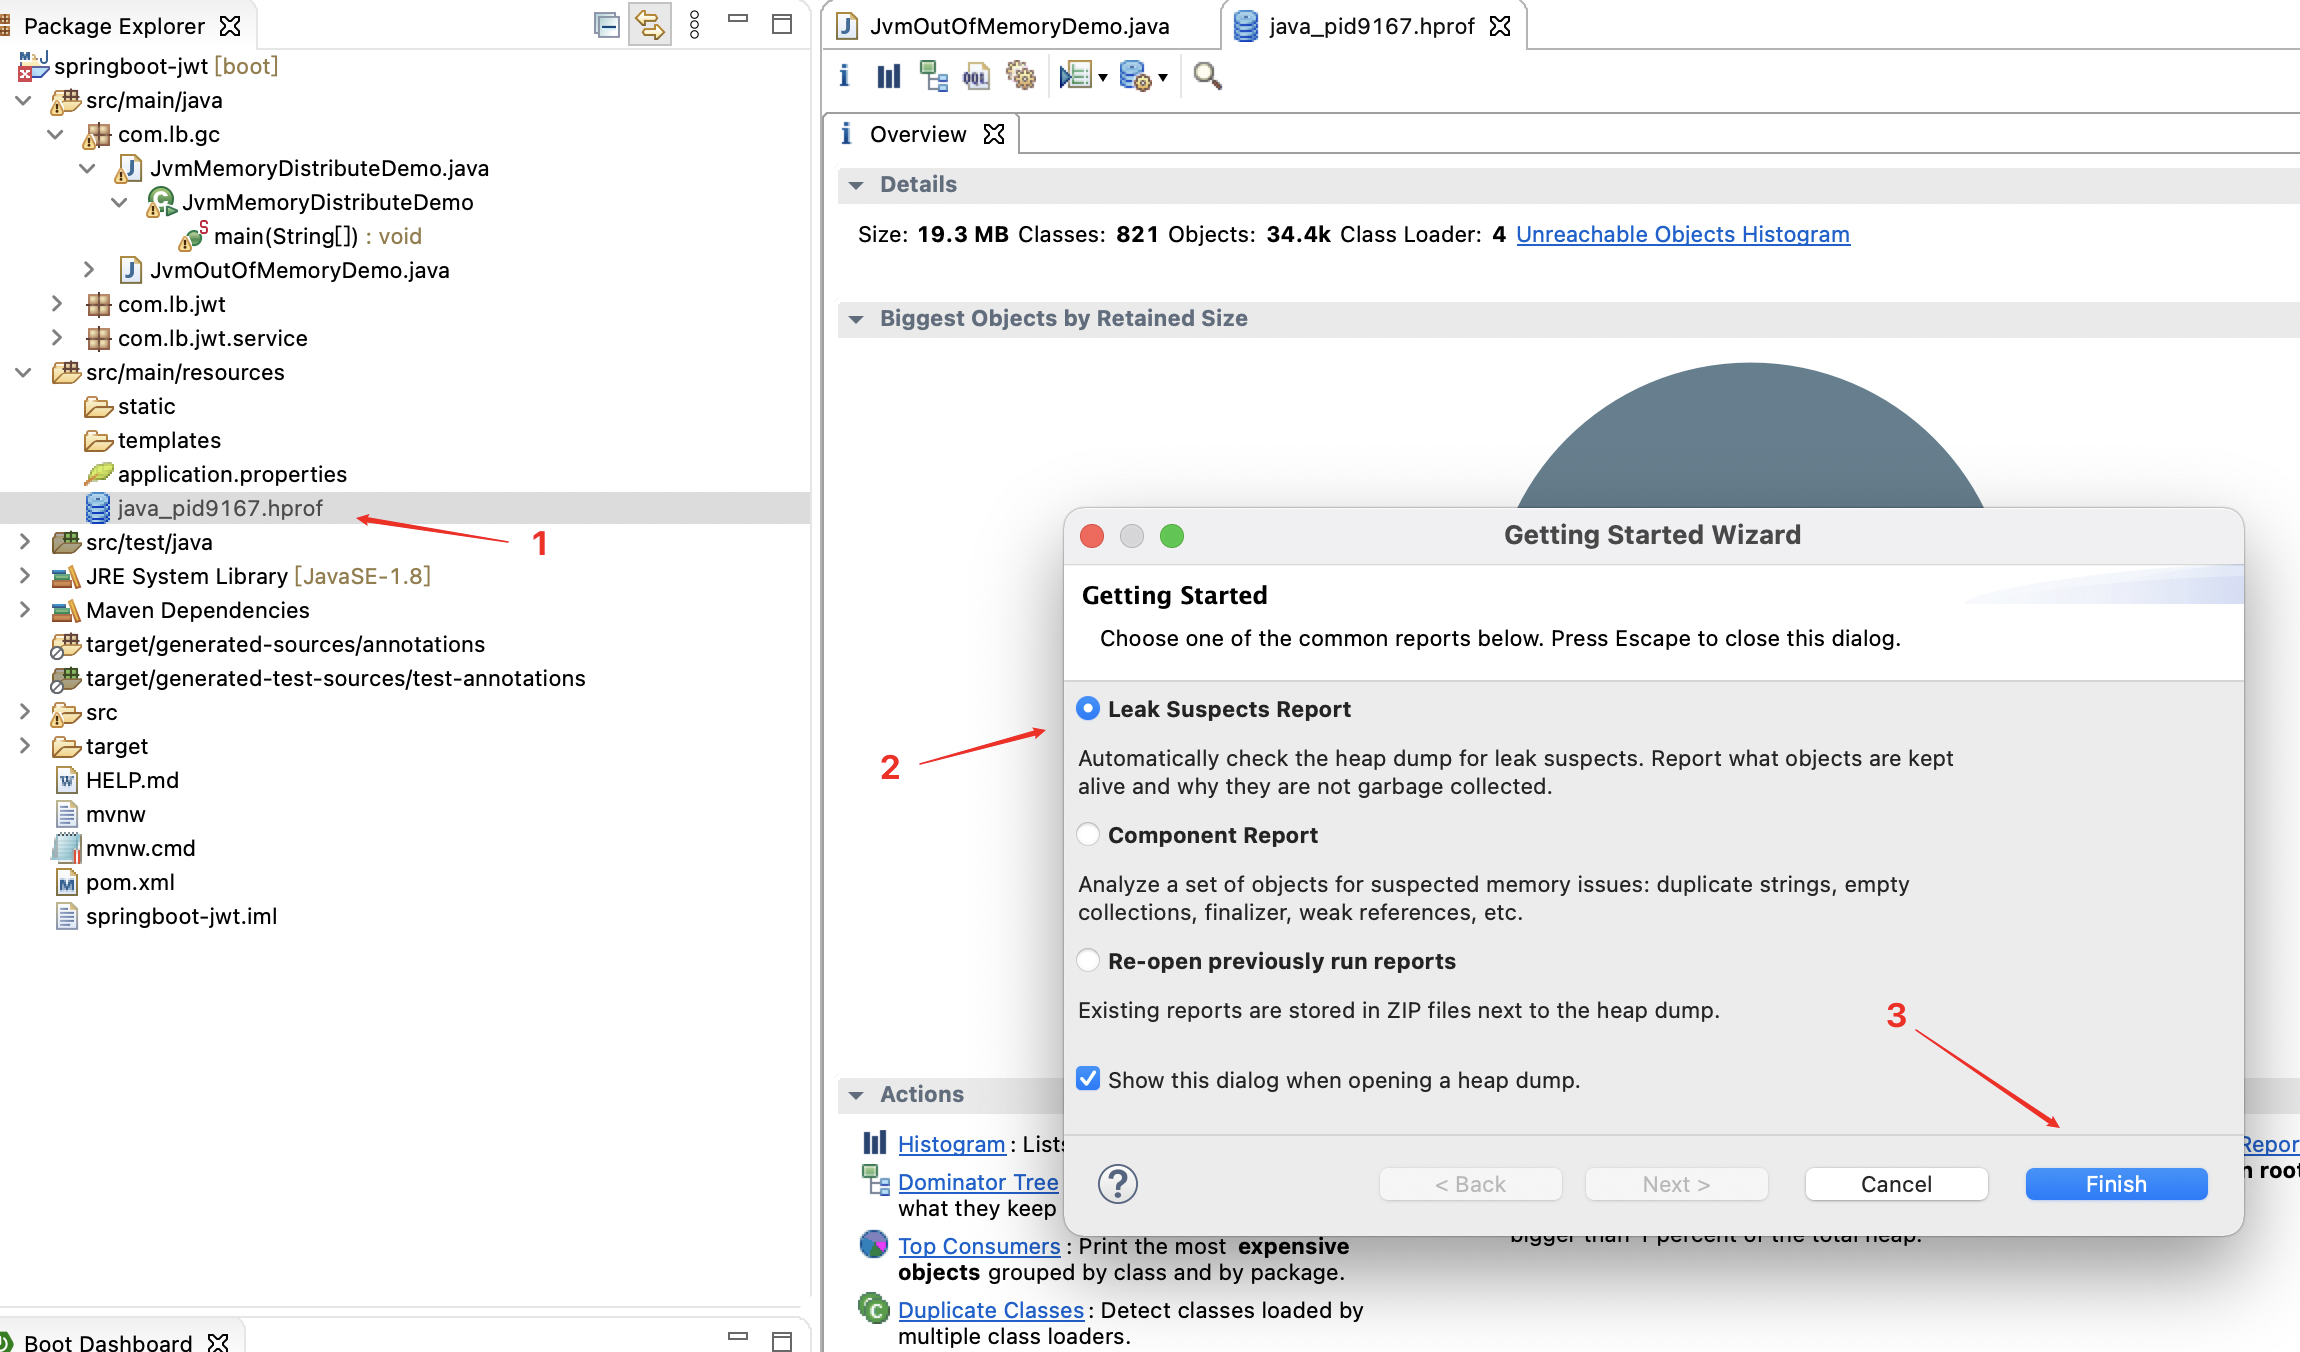 2. 打开后的界面如下
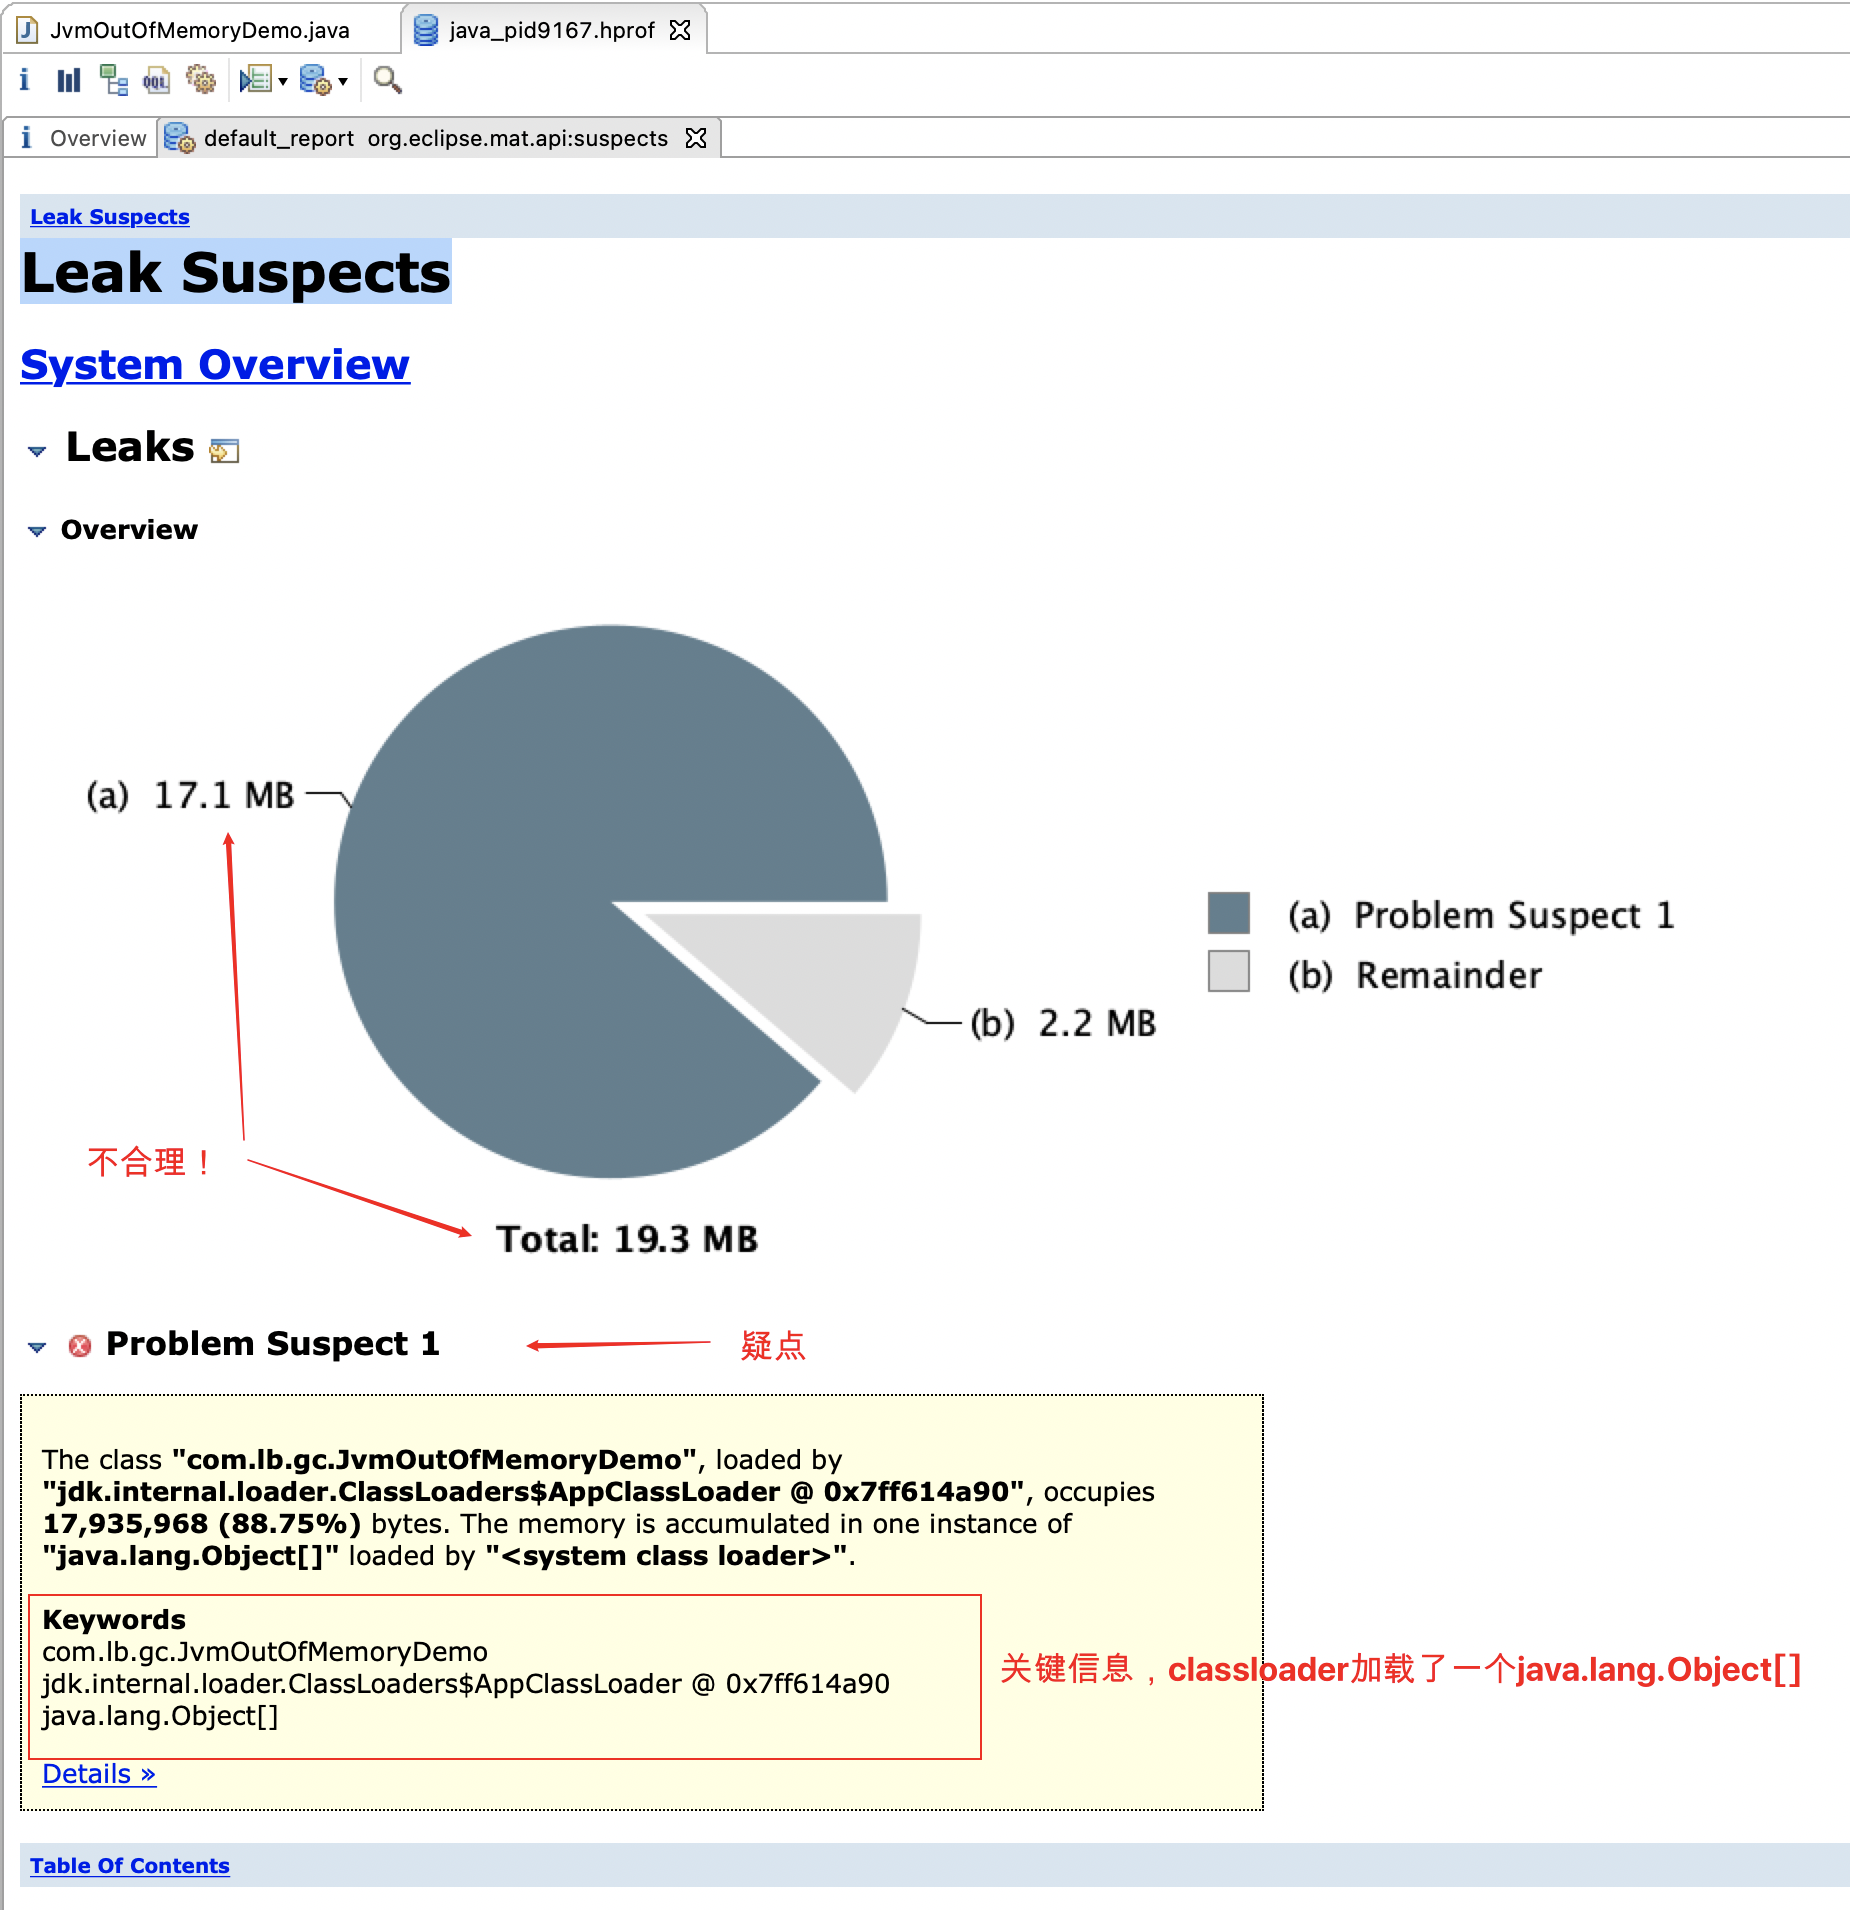 从图中内容可看出,总共20MB的内存,a疑点就占用了17.1MB,内存泄露的疑点可能就在这里。
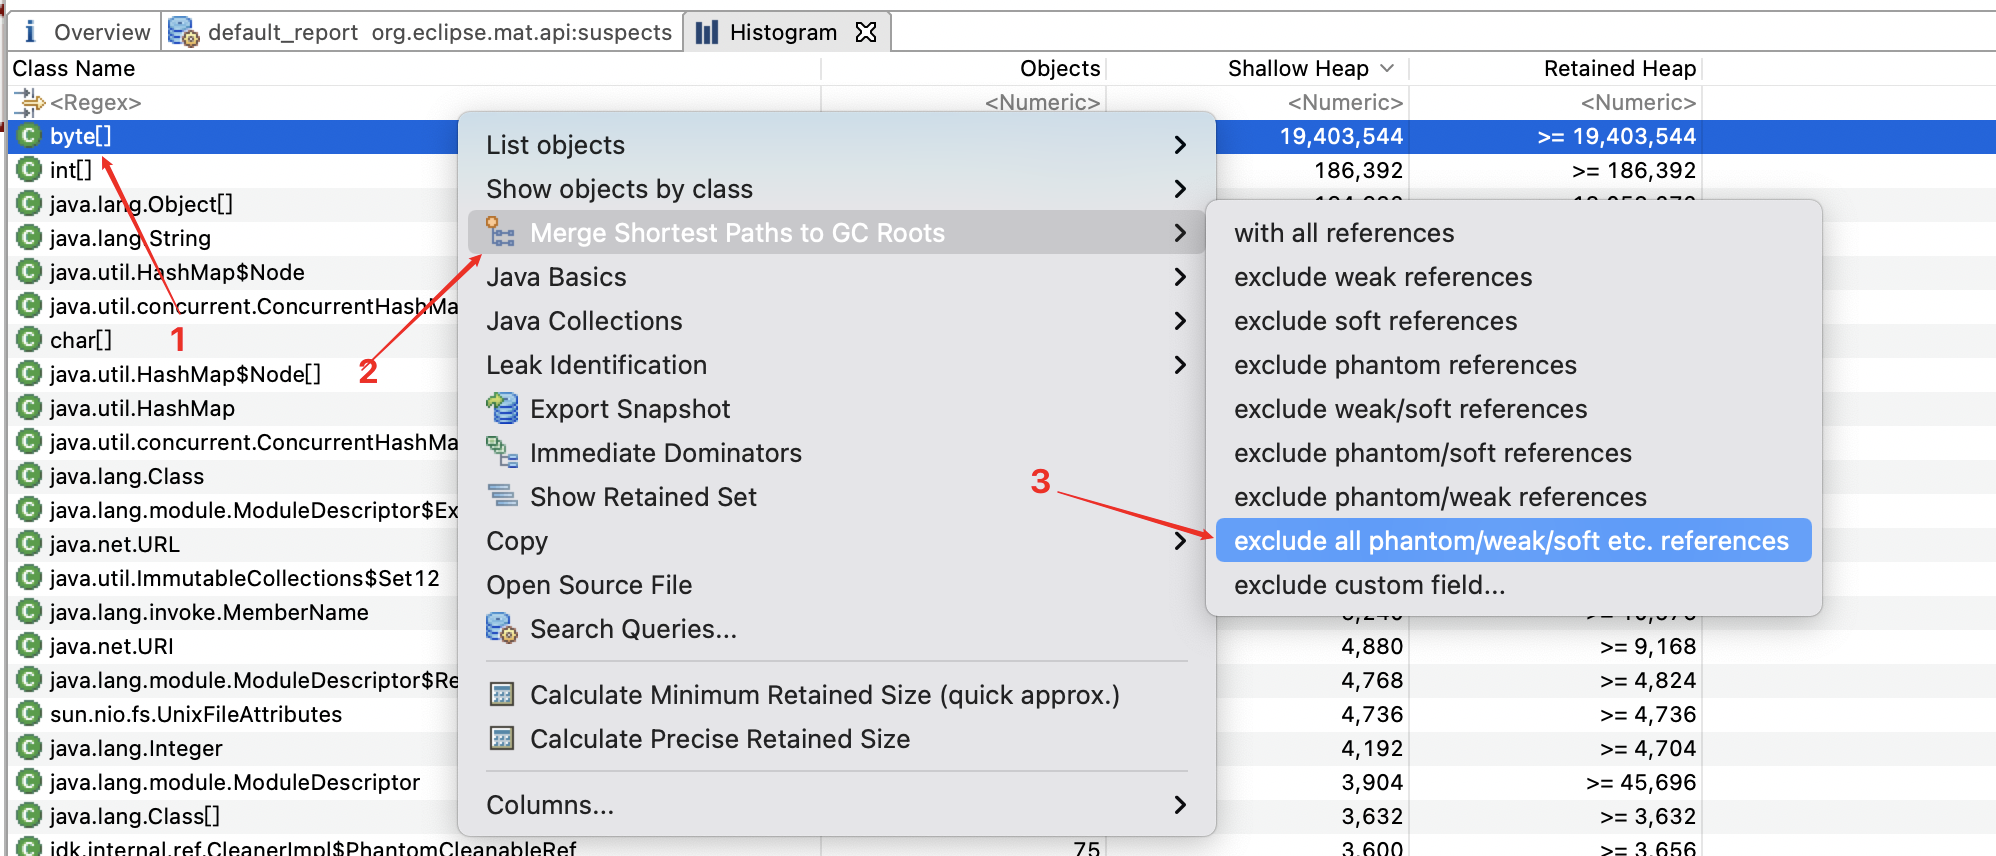
直方图
- 点击左上角的
histogram按钮如图所示,可看出有byte[]1900万个对象
 2. 合并GC Roots 因为只有强引用才会导致GC无法释放空间,最终导致OOM。所以我们只需要关注强引用的数据。
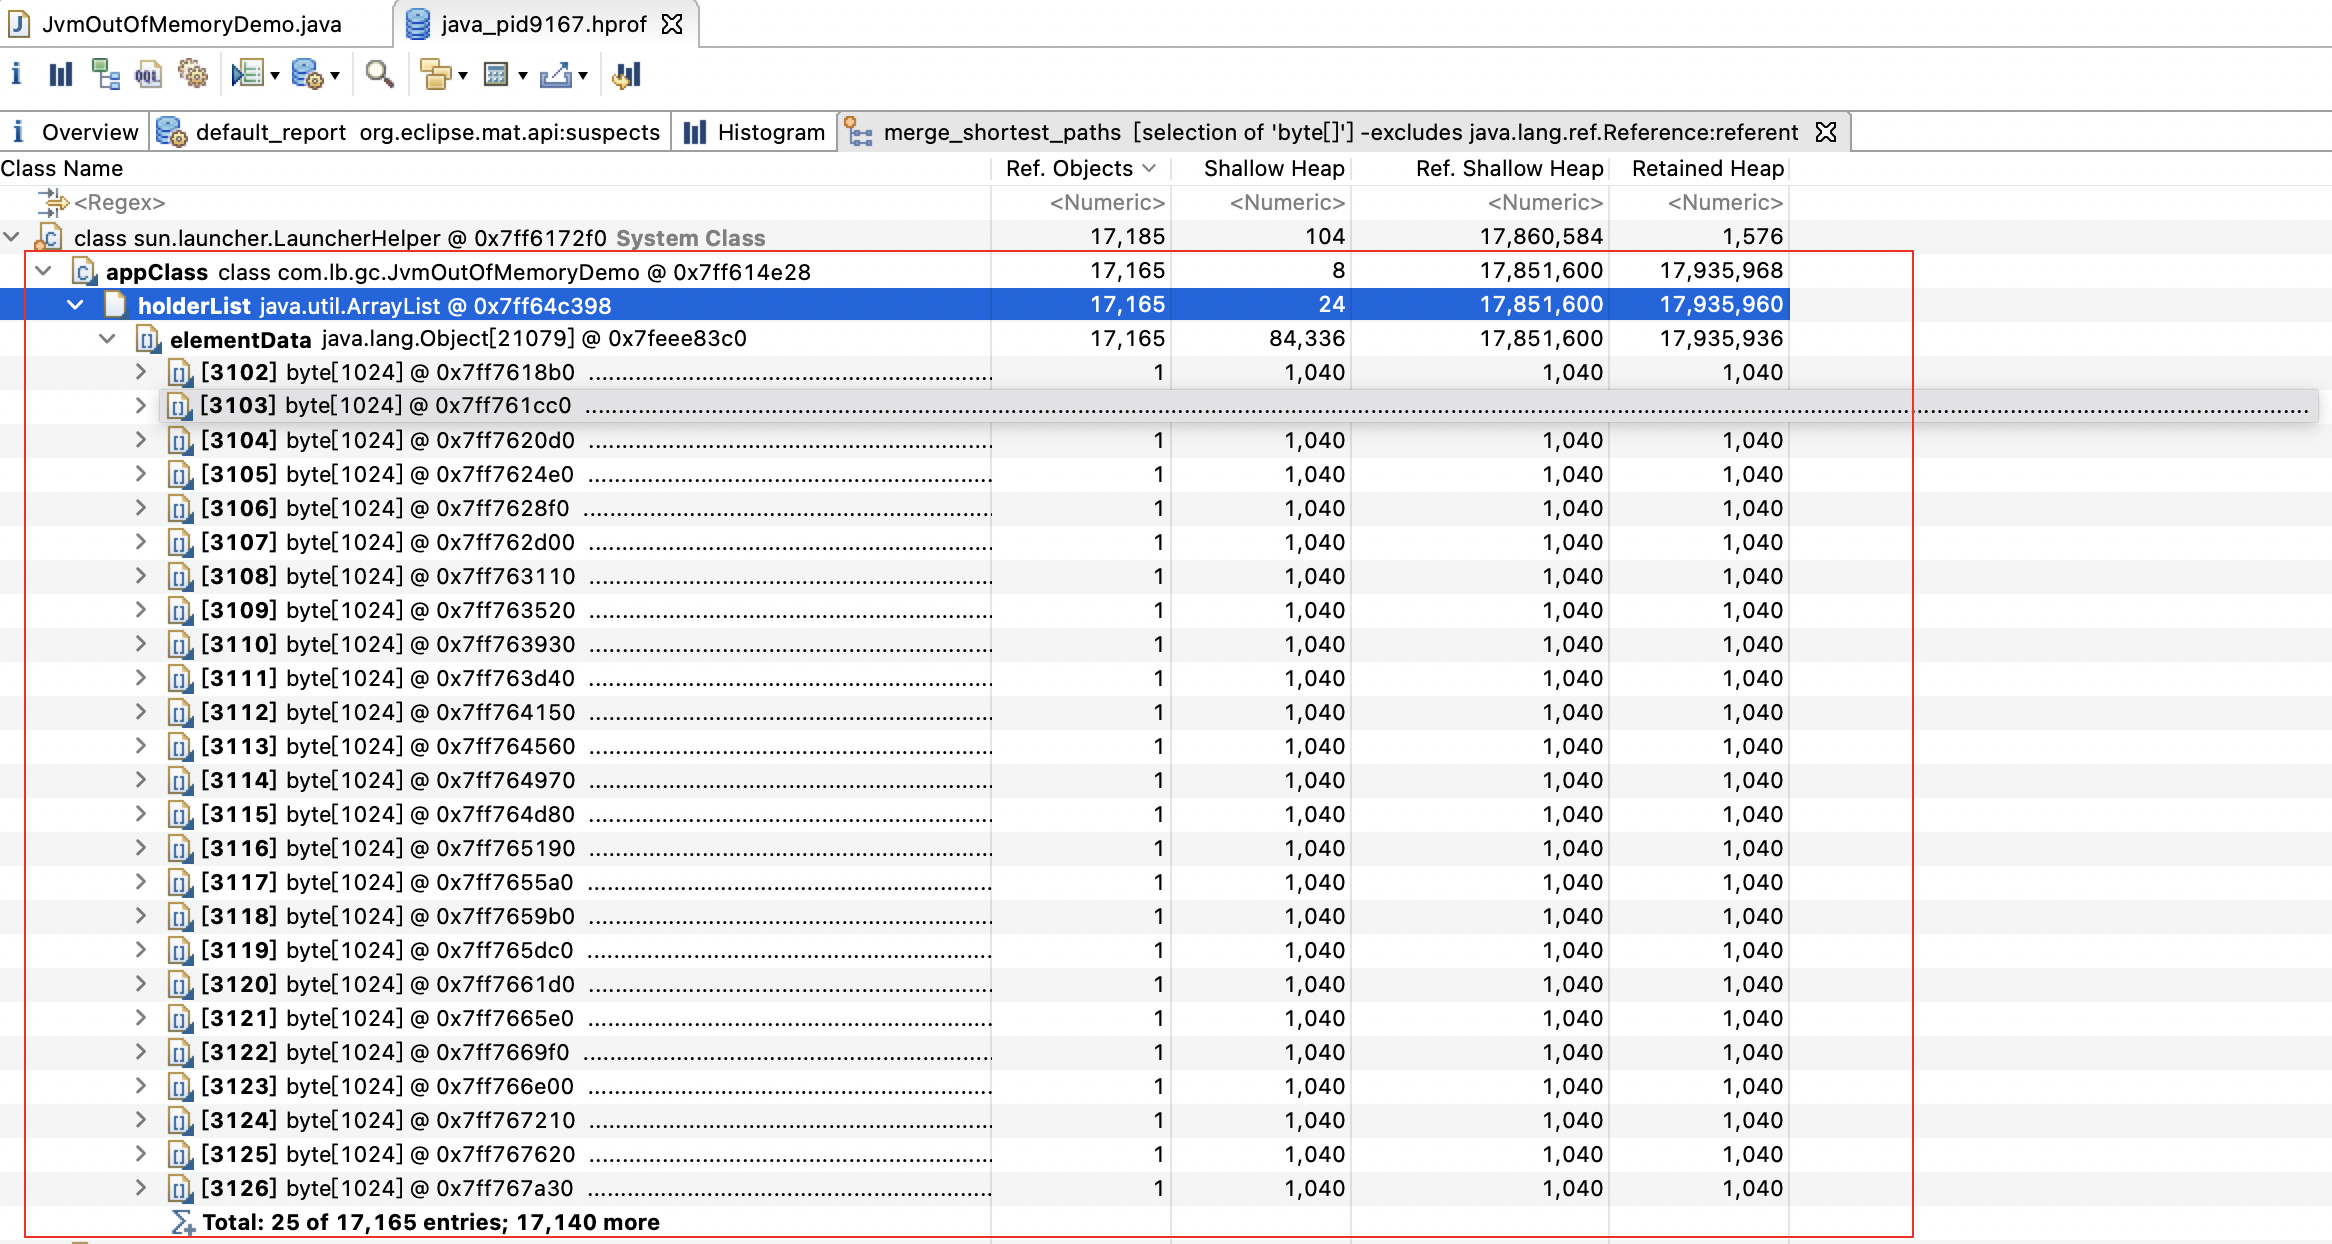
- 过滤数据
- 点开看详情 发现有一个
com.lb.gc.JvmOutOfMemoryDemo类下的holderList java.util.ArrayList有1万7千多个引用并且占用了1700多万个堆。 因为这个list一直没有被释放,所以会导致应用程序发生 OOM
树形图
- 同时我们也可以使用树形图来查看占用率,可以看到这个
class com.lb.gc.JvmOutOfMemoryDemo @ 0x7ff614e28占用率是非常高的,达到 88.75%

一般情况下我们不会等到内存溢出之后,才去分析内存溢出的原因和问题, 都会进行定时的巡检,这就需要使用jmap命令进行导出了
实时监控导出
jmap
jmap -heap pid来查看运行时的JVM配置
jdk1.8以上,需要用
jhsdb jmap --heap --pid 36362代替jmap -heap pid命令hsdb是HotSpot Debugger的简称
由于Mac系统下执行jmap有好多问题,这里就用Linux来演示了
- 编写测试代码,简单写个springboot应用即可。
@SpringBootApplication
public class SpringbootJwtApplication {

    public static void main(String[] args) {
        SpringApplication.run(SpringbootJwtApplication.class, args);
    }
}
- 启动应用
java <指定JVM参数> -jar <应用名>
# 查看JDK版本
[lb@centos-linux ~]$ java -version
java version "1.8.0_271"
Java(TM) SE Runtime Environment (build 1.8.0_271-b09)
Java HotSpot(TM) 64-Bit Server VM (build 25.271-b09, mixed mode)
[lb@centos-linux ~]$
# 配置初始化堆内存和最大堆内存为20MB,指定新生代与老年代比例为1:3
# 启动应用
[lb@centos-linux ~]$ java -Xms20m -Xmx20m  -XX:+UseSerialGC -XX:+PrintCommandLineFlags -XX:NewRatio=3 -jar springboot-jwt-1.0.0.jar
启动日志
-XX:InitialHeapSize=20971520 -XX:MaxHeapSize=20971520 -XX:NewRatio=3 -XX:+PrintCommandLineFlags -XX:+UseCompressedClassPointers -XX:+UseCompressedOops -XX:+UseSerialGC

  .   ____          _            __ _ _
 /\\ / ___'_ __ _ _(_)_ __  __ _ \ \ \ \
( ( )\___ | '_ | '_| | '_ \/ _` | \ \ \ \
 \\/  ___)| |_)| | | | | || (_| |  ) ) ) )
  '  |____| .__|_| |_|_| |_\__, | / / / /
 =========|_|==============|___/=/_/_/_/
 :: Spring Boot ::        (v2.3.0.RELEASE)

2021-02-01 00:59:25.935  INFO 13010 --- [           main] com.lb.jwt.SpringbootJwtApplication      : Starting SpringbootJwtApplication v1.0.0 on centos-linux.shared with PID 13010 (/home/lb/springboot-jwt-1.0.0.jar started by lb in /home/lb)
2021-02-01 00:59:25.941  INFO 13010 --- [           main] com.lb.jwt.SpringbootJwtApplication      : No active profile set, falling back to default profiles: default
2021-02-01 00:59:26.987  INFO 13010 --- [           main] o.s.b.w.embedded.tomcat.TomcatWebServer  : Tomcat initialized with port(s): 8080 (http)
2021-02-01 00:59:26.998  INFO 13010 --- [           main] o.apache.catalina.core.StandardService   : Starting service [Tomcat]
2021-02-01 00:59:26.998  INFO 13010 --- [           main] org.apache.catalina.core.StandardEngine  : Starting Servlet engine: [Apache Tomcat/9.0.35]
2021-02-01 00:59:27.081  INFO 13010 --- [           main] o.a.c.c.C.[Tomcat].[localhost].[/]       : Initializing Spring embedded WebApplicationContext
2021-02-01 00:59:27.081  INFO 13010 --- [           main] o.s.web.context.ContextLoader            : Root WebApplicationContext: initialization completed in 1076 ms
2021-02-01 00:59:27.298  INFO 13010 --- [           main] o.s.s.concurrent.ThreadPoolTaskExecutor  : Initializing ExecutorService 'applicationTaskExecutor'
2021-02-01 00:59:27.462  INFO 13010 --- [           main] o.s.b.w.embedded.tomcat.TomcatWebServer  : Tomcat started on port(s): 8080 (http) with context path ''
2021-02-01 00:59:27.476  INFO 13010 --- [           main] com.lb.jwt.SpringbootJwtApplication      : Started SpringbootJwtApplication in 2.056 seconds (JVM running for 2.421)
- 查看进程号
[lb@centos-linux ~]$ jps -l
13010 springboot-jwt-1.0.0.jar
14143 sun.tools.jps.Jps
- 查看实时运行Heap内存情况
jmap -heap <pid>
[lb@centos-linux ~]$ jmap -heap 13010
Attaching to process ID 13010, please wait...
Debugger attached successfully.
Server compiler detected.
JVM version is 25.271-b09

using thread-local object allocation.
Mark Sweep Compact GC

Heap Configuration:
   MinHeapFreeRatio         = 40
   MaxHeapFreeRatio         = 70
   MaxHeapSize              = 20971520 (20.0MB)
   NewSize                  = 5242880 (5.0MB)
   MaxNewSize               = 5242880 (5.0MB)
   OldSize                  = 15728640 (15.0MB)
   NewRatio                 = 3
   SurvivorRatio            = 8
   MetaspaceSize            = 21807104 (20.796875MB)
   CompressedClassSpaceSize = 1073741824 (1024.0MB)
   MaxMetaspaceSize         = 17592186044415 MB
   G1HeapRegionSize         = 0 (0.0MB)

Heap Usage:
New Generation (Eden + 1 Survivor Space):
   capacity = 4718592 (4.5MB)
   used     = 4545976 (4.335380554199219MB)
   free     = 172616 (0.16461944580078125MB)
   96.34179009331598% used
Eden Space:
   capacity = 4194304 (4.0MB)
   used     = 4134584 (3.9430465698242188MB)
   free     = 59720 (0.05695343017578125MB)
   98.57616424560547% used
From Space:
   capacity = 524288 (0.5MB)
   used     = 411392 (0.392333984375MB)
   free     = 112896 (0.107666015625MB)
   78.466796875% used
To Space:
   capacity = 524288 (0.5MB)
   used     = 0 (0.0MB)
   free     = 524288 (0.5MB)
   0.0% used
tenured generation:
   capacity = 15728640 (15.0MB)
   used     = 10806232 (10.305625915527344MB)
   free     = 4922408 (4.694374084472656MB)
   68.7041727701823% used

11152 interned Strings occupying 926992 bytes.
[lb@centos-linux ~]$
- 导出dump文件
jmap -dump:format=b,file=app.hprof <进程号>
[lb@centos-linux ~]$ jmap -dump:format=b,file=springboot-jwt.hprof 13010
Dumping heap to /home/lb/springboot-jwt.hprof ...
Heap dump file created
[lb@centos-linux ~]$ pwd
/home/lb
[lb@centos-linux ~]$ ls
app.hprof  libs  servers  soft  springboot-jwt-1.0.0.jar  springboot-jwt.hprof
- 从服务器下载到本地进行分析即可
sz springboot-jwt.hprof


 416
416


 被折叠的 条评论
为什么被折叠?
被折叠的 条评论
为什么被折叠?
 到【灌水乐园】发言


