


0.背景
当你查看nGrinder详细报告页,会展示性能数据结果和时序图,这些内部是怎么实现的呢?本文将分析源码,给你一个清晰的认识。
1.源码分析
当你请求 http://ip/perftest/{testid}/detail_report; 查看详细报告页时,Controller端将请求转给perftest/detail_report模板(ngrinder-controller/src/main/webapp/WEB-INF/ftl/perftest/detail_report.ftl ):
/**
 * Get the detailed perf test report.
 *
 * @param model model
 * @param id    test id
 * @return perftest/detail_report
 *
 * 返回给detail_report.ftl
 */
@SuppressWarnings("MVCPathVariableInspection")
@RequestMapping(value = {"/{id}/detail_report", /** for backward compatibility */"/{id}/report"})
public String getReport(ModelMap model, @PathVariable("id") long id) {
    model.addAttribute("test", perfTestService.getOne(id));
    model.addAttribute("plugins", perfTestService.getAvailableReportPlugins(id));
    return "perftest/detail_report";
}
model.addAttribute("test", perfTestService.getOne(id));
ModelMap:构建model数据给前端的Map
addAttribute:添加指定名对应的属性
perfTestService.getOne(id):获取对应测试id下的Perftest(性能统计数据model)实例
detail_report.ftl中可以根据test获取PerfTest成员变量值
detail_report.ftl模板中数据展示分成两大部分:
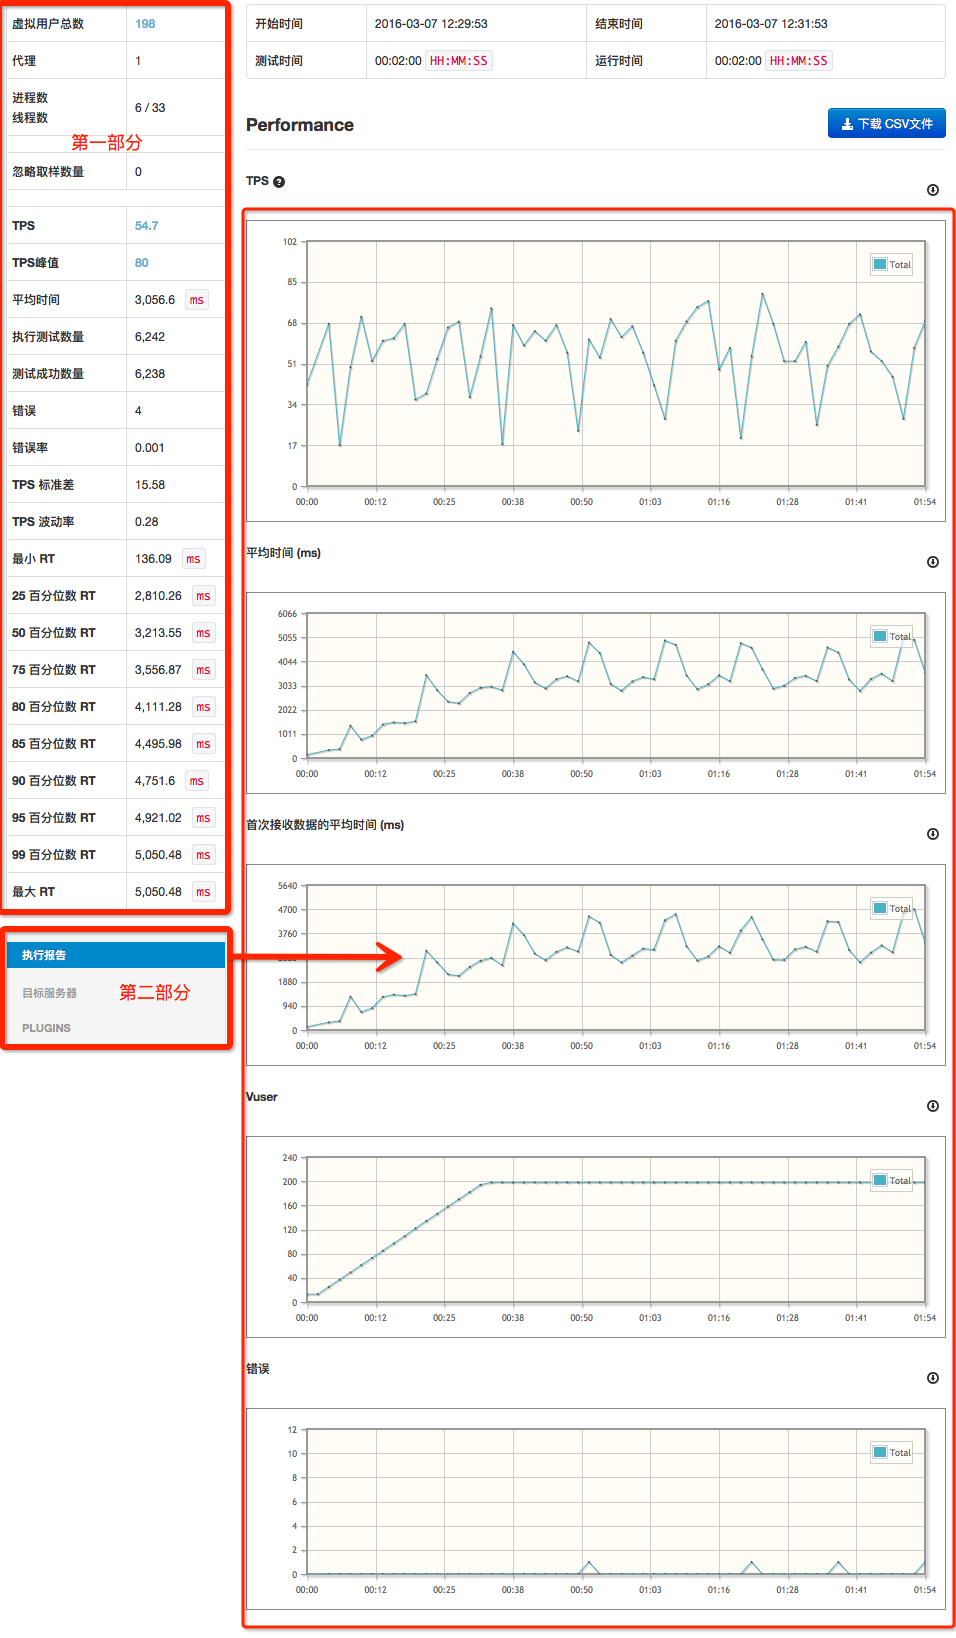
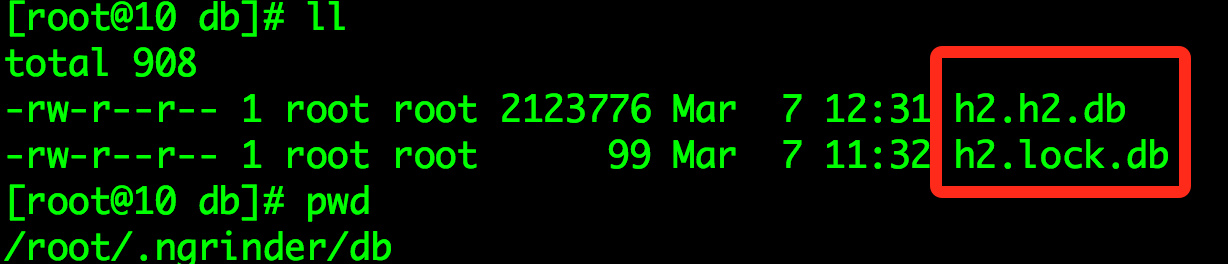
1-1. 第一部分:DB数据
DB:h2, 文件保存路径:/root/.ngrinder/db
detail_report.ftl局部代码示例:
<tr>
    <th><@spring.message "perfTest.report.totalVusers"/></th>
    <td><strong>${test.vuserPerAgent * test.agentCount}</strong></td>
</tr>
test.vuserPerAgent 是根据perfTestService.getOne(id),从DB中获取PerfTest实例,前端直接展示成员变量值。
2-2. 第二部分:文件数据
第二部分标签为detail_panel;默认为perfMenu
JS脚本:
<div id="detail_panel">
</div>

<#-- 左下,执行报告,目标服务器,PLUGINS -->
<script>
    $(document).ready(function () {
        var $perfMenu = $("li.perf");
        var $monitorMenu = $("li.monitor");
        var $pluginMenu = $("li.plugin");

        $perfMenu.click(function () {
            $("#detail_panel").load("${req.getContextPath()}/perftest/${(test.id)?c}/detail_report/perf");
            changActiveLink($(this));
        });

        $monitorMenu.click(function () {
            $("#detail_panel").load("${req.getContextPath()}/perftest/${(test.id)?c}/detail_report/monitor?targetIP=" + $(this).attr("ip"));
            changActiveLink($(this));
        });
        $pluginMenu.click(function () {
            $("#detail_panel").load("${req.getContextPath()}/perftest/${(test.id)?c}/detail_report/plugin/" + $(this).attr("plugin") +
                    "?kind=" + $(this).attr("ip"));
            changActiveLink($(this));
        });

        $.ajaxSetup({"cache": false});
        $perfMenu.click();
    });

    function changActiveLink(obj) {
        $("li.active").removeClass("active");
        obj.addClass("active");
    }

</script>
执行报告请求:
${req.getContextPath()}/perftest/${(test.id)?c}/detail_report/perf
对应的Controller:
/**
 * Get the detailed perf test report.
 *
 * @param id test id
 * @return perftest/detail_report/perf
 */
@SuppressWarnings({"MVCPathVariableInspection", "UnusedParameters"})
@RequestMapping("/{id}/detail_report/perf")
public String getDetailPerfReport(@PathVariable("id") long id) {
    return "perftest/detail_report/perf";
映射到ngrinder-controller/src/main/webapp/WEB-INF/ftl/perftest/detail_report/perf.ftl模板
<div class="bigchart" id="tps_chart"></div>
<h6><@spring.message "perfTest.report.header.meantime"/> (ms)</h6>
<div class="chart" id="mean_time_chart"></div>
<h6 id="min_time_first_byte_chart_header"><@spring.message "perfTest.report.header.meantimeToFirstByte"/> (ms)</h6>
<div class="chart" id="min_time_first_byte_chart"></div>
<h6 id="vuser_chart_header"><@spring.message "perfTest.report.header.vuser"/></h6>
<div class="chart" id="vuser_chart"></div>
<h6 id="user_defined_chart_header"><@spring.message "perfTest.report.header.userDefinedChart"/></h6>
<div class="chart" id="user_defined_chart"></div>
<h6><@spring.message "perfTest.report.header.errors"/></h6>
<div class="chart" id="error_chart"></div>
<script>
//@ sourceURL=/perftest/detail_report/perf
$("#tps_title").popover({trigger: 'hover', container:'body'});
function getGraphDataAndDraw(testId) {
var ajaxObj = new AjaxObj("/perftest/api/" + testId + "/perf");
ajaxObj.params = {
dataType : 'TPS,Errors,Mean_Test_Time_(ms),Mean_time_to_first_byte,User_defined,Vuser',
imgWidth : parseInt($("#tps_chart").width())
};
ajaxObj.success = function (data) {
var interval = data.chartInterval;
drawChart("tps_chart", data.TPS.data, interval, data.TPS.labels);
drawChart("mean_time_chart", data.Mean_Test_Time_ms.data, interval, data.Mean_Test_Time_ms.labels);
drawChart('vuser_chart', data.Vuser.data, interval, data.Vuser.labels);
drawChart('error_chart', data.Errors.data, interval, data.Errors.labels);
drawOptionalChart("min_time_first_byte_chart", data.Mean_time_to_first_byte.data, interval,
data.Mean_time_to_first_byte.labels);
drawOptionalChart("user_defined_chart", data.User_defined.data, interval, data.User_defined.labels);
createChartExportButton("<@spring.message "perfTest.report.exportImg.button"/>", "<@spring.message "perfTest.report.exportImg.title"/>");
};
ajaxObj.call();
}
function drawChart(id, data, interval, labels) {
new Chart(id, data, interval, { labels: labels }).plot();
}
function drawOptionalChart(id, data, interval, labels) {
if (data !== undefined && data.length != 0) {
drawChart(id, data, interval, labels);
} else {
$("#" + id).hide();
$("#" + id + "_header").hide();
}
}
$("#download_csv").click(function () {
document.forms.download_csv_form.action = "${req.getContextPath()}/perftest/${id}/download_csv";
document.forms.download_csv_form.submit();
});
getGraphDataAndDraw(${id});
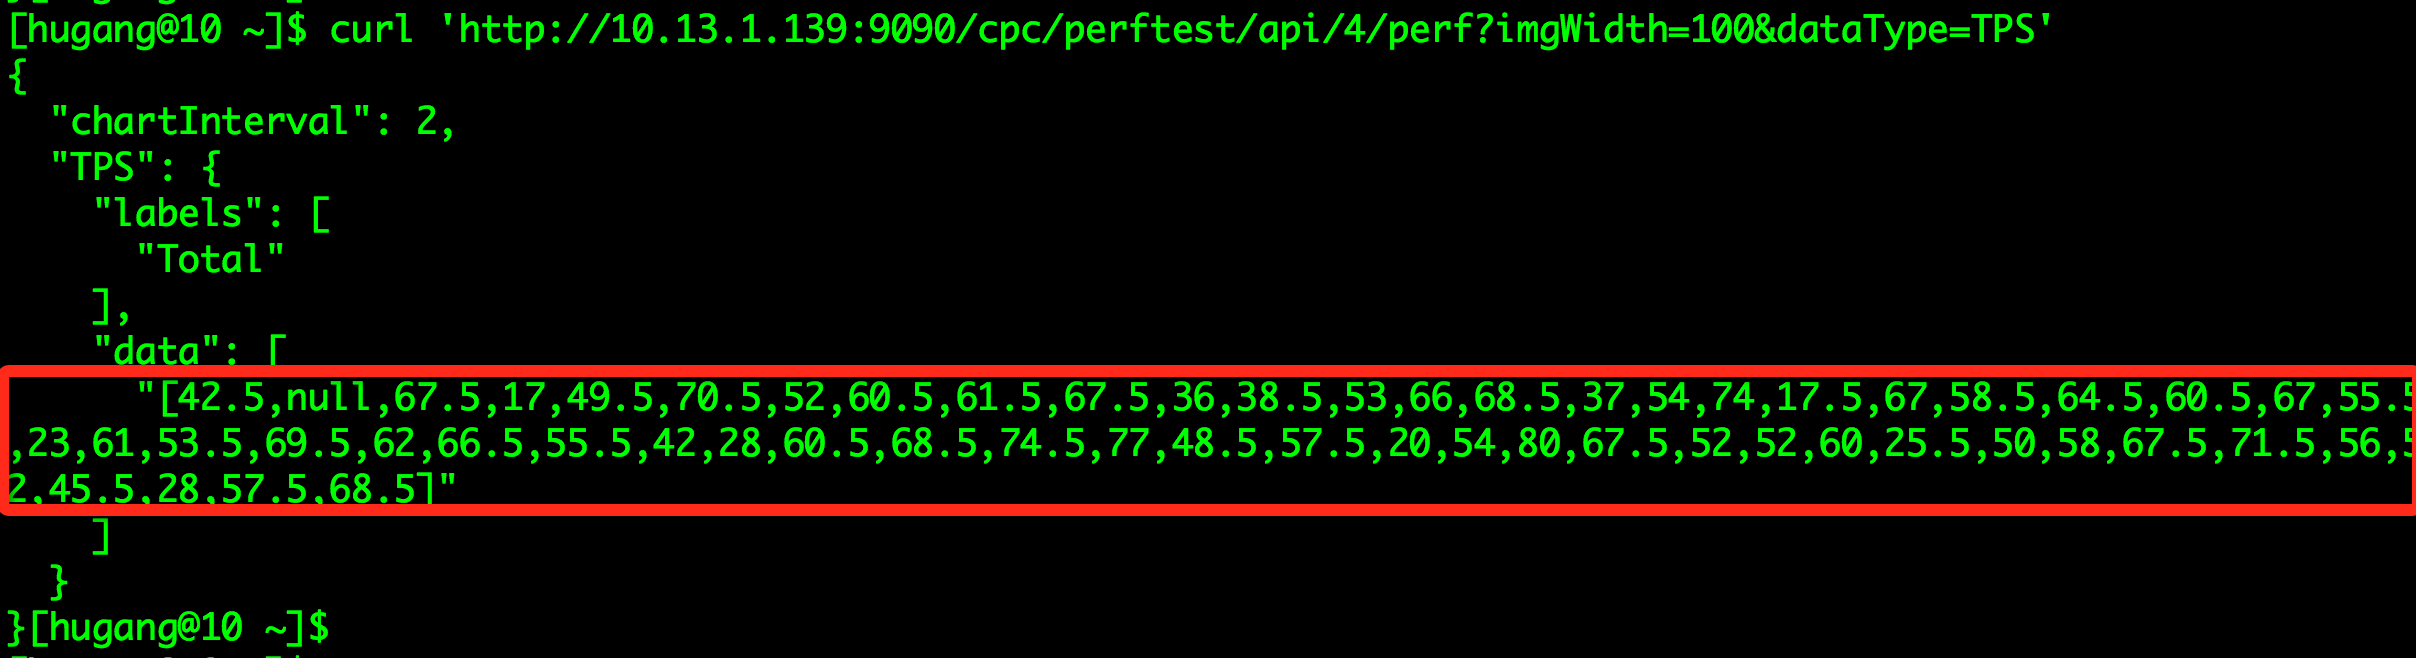
</script>注意: var ajaxObj = new AjaxObj("/perftest/api/" + testId + "/perf");
去请求了@RequestMapping({"/api/{id}/perf", "/api/{id}/graph"})
/**
     * Get the detailed report graph data for the given perf test id.
     * This method returns the appropriate points based on the given imgWidth.
     *
     * @param id       test id
     * @param dataType which data
     * @param imgWidth imageWidth
     * @return json string.
     */
    @SuppressWarnings("MVCPathVariableInspection")
    @RestAPI
    @RequestMapping({"/api/{id}/perf", "/api/{id}/graph"})
    public HttpEntity<String> getPerfGraph(@PathVariable("id") long id,
                                           @RequestParam(required = true, defaultValue = "") String dataType,
                                           @RequestParam(defaultValue = "false") boolean onlyTotal,
                                           @RequestParam int imgWidth) {
        String[] dataTypes = checkNotEmpty(StringUtils.split(dataType, ","), "dataType argument should be provided");
        return toJsonHttpEntity(getPerfGraphData(id, dataTypes, onlyTotal, imgWidth));
    }
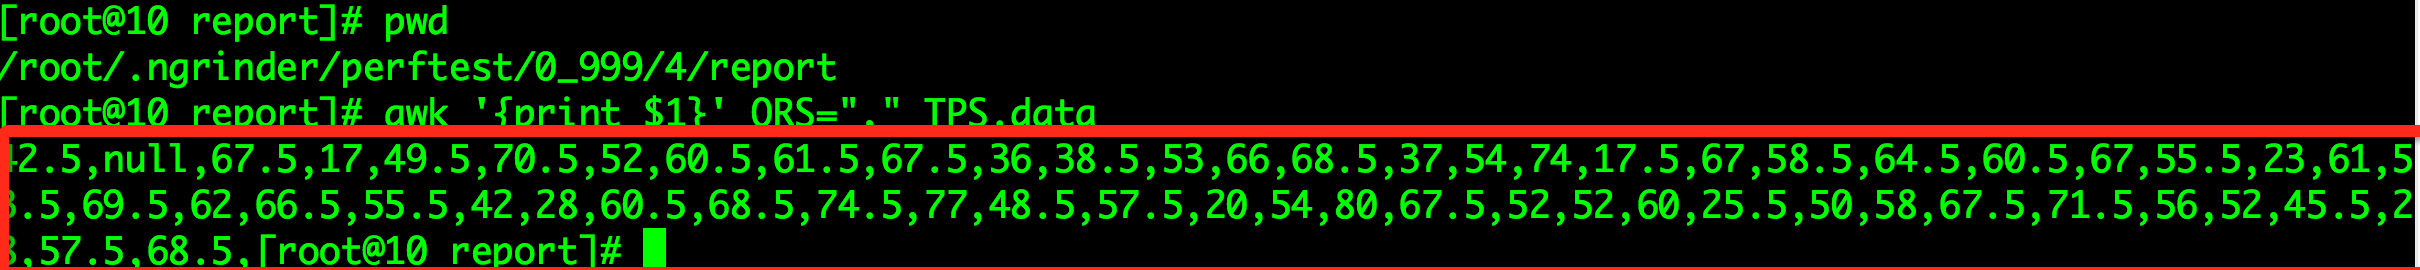
其中:getPerfGraphData(id, dataTypes, onlyTotal, imgWidth)根据*.data文件获取数据(*.data是在你执行性能测试时,将采集的性能数据写到对应路径下的文件,路径:`/root/.ngrinder/perftest/0_999/$testid/report`)

getPerfGraphData(id, dataTypes, onlyTotal, imgWidth):
    private Map<String, Object> getPerfGraphData(Long id, String[] dataTypes, boolean onlyTotal, int imgWidth) {
        final PerfTest test = perfTestService.getOne(id);
        int interval = perfTestService.getReportDataInterval(id, dataTypes[0], imgWidth);
        Map<String, Object> resultMap = Maps.newHashMap();
        for (String each : dataTypes) {
            Pair<ArrayList<String>, ArrayList<String>> tpsResult = perfTestService.getReportData(id, each, onlyTotal, interval);
            Map<String, Object> dataMap = Maps.newHashMap();
            dataMap.put("labels", tpsResult.getFirst());
            dataMap.put("data", tpsResult.getSecond());
            resultMap.put(StringUtils.replaceChars(each, "()", ""), dataMap);
        }
        resultMap.put(PARAM_TEST_CHART_INTERVAL, interval * test.getSamplingInterval());
        return resultMap;
}perfTestService.getReportData():/**
* Get list that contains test report data as a string.
*
* @param testId test id
* @param key report key
* @param onlyTotal true if only total show be passed
* @param interval interval to collect data
* @return list containing label and tps value list
*/
public Pair<ArrayList<String>, ArrayList<String>> getReportData(long testId, String key, boolean onlyTotal, int interval) {
Pair<ArrayList<String>, ArrayList<String>> resultPair = Pair.of(new ArrayList<String>(),
new ArrayList<String>());
List<File> reportDataFiles = onlyTotal ? Lists.newArrayList(getReportDataFile(testId, key)) : getReportDataFiles(testId, key);
for (File file : reportDataFiles) {
String buildReportName = buildReportName(key, file);
if (key.equals(buildReportName)) {
buildReportName = "Total";
} else {
buildReportName = buildReportName.replace("_", " ");
}
resultPair.getFirst().add(buildReportName);
resultPair.getSecond().add(getFileDataAsJson(file, interval));
}
return resultPair;
}
// 读取*.data转换成son string
getFileDataAsJson(file, interval):
/**
* Get the test report data as a json string.
*
* @param targetFile target file
* @param interval interval to collect data
* @return json string
*/
private String getFileDataAsJson(File targetFile, int interval) {
if (!targetFile.exists()) {
return "[]";
}
StringBuilder reportData = new StringBuilder("[");
FileReader reader = null;
BufferedReader br = null;
try {
reader = new FileReader(targetFile);
br = new BufferedReader(reader);
String data = br.readLine();
int current = 0;
while (StringUtils.isNotBlank(data)) {
if (0 == current) {
reportData.append(data);
reportData.append(",");
}
if (++current >= interval) {
current = 0;
}
data = br.readLine();
}
if (reportData.charAt(reportData.length() - 1) == ',') {
reportData.deleteCharAt(reportData.length() - 1);
}
} catch (IOException e) {
LOGGER.error("Report data retrieval is failed: {}", e.getMessage());
LOGGER.debug("Trace is : ", e);
} finally {
IOUtils.closeQuietly(reader);
IOUtils.closeQuietly(br);
}
return reportData.append("]").toString();
}


 2291
2291

 被折叠的 条评论
为什么被折叠?
被折叠的 条评论
为什么被折叠?
 到【灌水乐园】发言


