http://blog.csdn.net/fred_yang2013/article/details/10824435
图像由许多的像素组成。这些像素的分布和值包含了图像的许多重要的信息。利用这些信息我们可以计算出图像的直方图,并且去改善图片的效果,检测图像的纹理等。下面我们就来看一下怎么得到图像的直方图。
直方图给出了相同灰度值的像素个数。灰度图的直方图基本上有256个坐标点。0点给出了图像中所有灰度值为0的像素的个数等等依次类推。算出所有坐标值的和,也就得到了总的像素数。直方图也可以被规范化,也就是说坐标值的和为1,也就是说每个坐标的值是所占像素总个数的百分比。
OpenCV计算直方图使用cv::calcHis函数。他可以计算多个信道的各种图像类型的直方图。让我们来写一个类来更方便的使用它。
先让我们了解一下cv::calcHist:
void calcHist(const Mat*images, int nimages, const int* channels, InputArray mask, OutputArray hist, int dims, const int* histSize, const float** ranges, booluniform=true, boolaccu-mulate=false)
images – Source arrays. They all should have the same depth,CV_8UorCV_32F, and thesame size. Each of them can have an arbitrary number of channels.
nimages– Number of source images.
channels – List of the dims channels used to compute the histogram. The first ar-ray channels are numerated from 0 to images[0].channels()-1 , the second ar-raychannels are counted from images[0].channels() to images[0].channels() +images[1].channels()-1, and so on.
mask– Optional mask. If the matrix is not empty, it must be an 8-bit array of the same size as images[i]. The non-zero mask elements mark the array elements counted in the histogram.
hist– Output histogram, which is a dense or sparsedims-dimensional array.
dims– Histogram dimensionality that must be positive and not greater thanCV_MAX_DIMS(equal to 32 in the current OpenCV version).
histSize– Array of histogram sizes in each dimension.
ranges– Array of the dims arrays of the histogram bin boundaries in each dimension.When the histogram is uniform (uniform=true), then for each dimensioniit is enough to specify the lower (inclusive) boundary L0 of the 0-th histogram bin and the upper (exclusive) boundary UhistSize[i]-1 for the last histogram bin histSize[i]-1. That is, in case of a uniform histogram each of ranges[i]is an array of 2 elements. When the histogram is not uniform (uniform=false), then each of ranges[i] contains histSize[i]+1 elements: L0;U0 =L1;U1 =L2;:::;UhistSize[i]-2 =LhistSize[i]-1;UhistSize[i]-1. The array elements, that are not between L0 and UhistSize[i]-1, are not counted in the histogram.
uniform– Flag indicating whether the histogram is uniform or not (see above).
accumulate– Accumulation flag. If it is set, the histogram is not cleared in the beginning when it is allocated. This feature enables you to compute a singlehistogram from several sets of arrays, or to update the histogram in time.
我们来重点看一下几个参数:
mask:如上面所说的,如果它不是空,那么就必须是和images一样大的数组。只有当mask中非零的地方函数才对images对应的像素处理。
ranges:指的是直方图每一维的边界。如果直方图是uniform的,那么就是每一个bin的间隔都相同,那么都只需要指定开始和结束除以histSize就得到了每一维的bin分布;而当ranges如果每个bin间隔不同的话,也就是非uniform,那么需要你指定每一个bin的间隔,那么就需要histSize[i]+1个元素了。
accumulate:累计标识。如果设置,则直方图在开始时不被清零。这个特征保证可以为多个图像计算一个单独的直方图,或者在线更新直方图。
- class Histogram
- {
- private:
- int histSize[1] ; //灰度级数
- float hranges[2];//像素最大值和最小值
- const float *ranges[1];
- int channels[1];//在这里只使用一个信道
- public:
- Histogram()
- {
- histSize[0] = 256;
- hranges[0] = 0.0;//最小值初始化为0
- hranges[1] = 255.0;//最大值,因为一般图像都是8位
- ranges[0] = hranges;//灰度值范围
- channels[0] = 0;//如果是彩色图像,我们默认检测0信道
- }
- void setChannel( int c)
- {
- channels[0] = c;
- }
- int getChannel()
- {
- return channels[0];
- }
- void setRange(float minValue, float maxValue)
- {
- hranges[0] = minValue;
- hranges[1] = maxValue;
- }
- float getMinValue()
- {
- return hranges[0];
- }
- float getMaxValue()
- {
- return hranges[1];
- }
- void setNBins(int nbins)
- {
- histSize[0] = nbins;
- }
- int getNBins()
- {
- return histSize[0];
- }
- cv::MatND getHistogram(const cv::Mat &image);
- cv::MatND getHisotgramImage(const cv::Mat &image);
- };
现在要做的就是打开图像,然后创建一个Histogram对象,获得直方图。
- cv::Mat img,histoImage, thresholdImage;
- Histogram h;
- img = cv::imread("E:\\StandardImage\\lena.jpg");
- if(!img.data)
- return 0;
- histoImage = h.getHisotgramImage(img);
现在histo变量时一个有256元素的一维数组。你可以遍历这个数组得到每一个值。另外我们也可以使用这些信息画出一个条形图。
- // Computes the 1D histogram and returns an image of it.
- cv::Mat getHistogramImage(const cv::Mat &image){
- // Compute histogram first
- cv::MatND hist= getHistogram(image);
- // Get min and max bin values
- double maxVal=0;
- double minVal=0;
- cv::minMaxLoc(hist, &minVal, &maxVal, 0, 0);
- // Image on which to display histogram
- cv::Mat histImg(histSize[0], histSize[0],
- CV_8U,cv::Scalar(255));
- // set highest point at 90% of nbins
- int hpt = static_cast<int>(0.9*histSize[0]);
- // Draw a vertical line for each bin
- for( int h = 0; h < histSize[0]; h++ ) {
- float binVal = hist.at<float>(h);
- int intensity = static_cast<int>(binVal*hpt/maxVal);
- // This function draws a line between 2 points
- cv::line(histImg,cv::Point(h,histSize[0]),
- cv::Point(h,histSize[0]-intensity),
- cv::Scalar::all(0));
- }
- return histImg;
- }
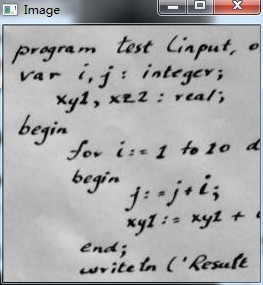
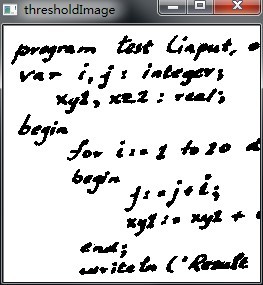
有时候在灰度直方图中,可以看到两个峰值,这两个峰可以看做两类的像素,一类是灰色的,另一类是比较黑的。这两组像素分别表示两类,一类是背景,一类是前景。我们可以通过阈值分割方法把这两类像素分割开来,而阈值就是两峰的交界处。这就是较简单的基于灰度直方图的图像分割。OpenCV提供了这样一个函数cv::threshold。它的作用是将像素两类并且将图像二值化进行图像分割,我们需要提供一个阈值。让我们来看下图的灰度直方图,在这个灰度直方图中可以看到一个明显的峰值,在下面这张图片中,可以把分界处看做是高峰的起点,大约在160左右。那么使用cv::threshold方法就可以得到分割后的图像。
- cv::Mat thresholded;
- cv::threshold(image,thresholded,160,255,cv::THRESH_BINARY);
见下图:
cv::calcHist函数的许多参数都可以以多种形式应用。大多数时候,直方图是一幅有1信道或者3信道的图像。但是,它也允许你指定一个分布在许多图像中的多通道图像。第六个参数指定直方图的维数。例如,如果是1就是一个1维直方图, 在许多OpenCV函数里面,可以指定一个掩码,指定想包含的像素。另外在本函数里还有两个默认的参数,布尔型的参数,一个是指定直方图是否是规范化,默认是。另一个是是否将直方图进行累积,也就是计算多个图片的直方图。关于这个函数的详细信息可以看相关说明。
返回的直方图储存在一个cv::MatND对象中这是一个用来存储N维矩阵的类。有at方法。需要记住的是其中存储的是float的值。
但是我们在输入一个彩色图像时,如果单纯的给出一个一维的直方图就不太对了,我们可以选择将图像按信道分开,分别给出每一个信道的直方图。
也可以使用cv::calcHist计算得到一个256三维的cv::MatND,这样算的话需要256*256*256个元素,一般情况下这个矩阵式稀疏矩阵,所以我们选择用稀疏矩阵cv::SparseMat存储。因为元素太多,所以有时候我们也是用前面说过的减少图像位深的方法,如果div选择64,那么元素个数就变成了4*4*4,减少了2^18数量级,当然,这时候的直方图没有使用的意义了。
我们使用第一种方法对lena彩色图处理结果如下:


 1019
1019

 被折叠的 条评论
为什么被折叠?


