<template>
<div class="service-call-chart">
<span class="chart-rate">比上一年 <a-icon type="arrow-down" class="rate-level-down " /> <span class="rate-level-num"> 50</span></span>
<div id="callChart"></div>
</div>
</template>
<script>
import * as echarts from 'echarts'
export default {
components: {},
data() {
return {}
},
methods: {
initChart() {
let data = [
{
value: 600,
name: '成功量',
},
{
value: 200,
name: '失败量',
},
{
value: 800,
itemStyle: {
// stop the chart from rendering this piece
color: 'none',
decal: {
symbol: 'none',
},
},
label: {
show: false,
},
},
]
let myChart = echarts.init(document.getElementById('callChart'))
let option = {
title: [
{
text: '成功率',
left: '9.5%',
bottom: '27%',
textStyle: {
fontSize: 14,
color: '#8C8C8C',
fontWeight:'normal'
},
subtext: '75.00%',
subtextStyle: {
color: '#262626',
fontWeight: '600',
fontSize: 16,
},
},
{
text: '失败率',
right: '6.5%',
bottom: '27%',
textStyle: {
fontSize: 14,
color: '#8C8C8C',
fontWeight:'normal'
},
subtext: '25.00%',
subtextStyle: {
color: '#262626',
fontWeight: '600',
fontSize: 16,
},
},
{
text: '服务调用量',
left: 'center',
top: '30%',
subtext: '2,660w',
textStyle: {
color: '#8C8C8C',
fontWeight: 'normal',
fontSize: 14,
},
subtextStyle: {
color: '#262626',
fontFamily: 'D-DIN-Bold',
fontWeight: 'bold',
fontSize: 32,
},
},
],
tooltip: {
formatter: (val) => {
return `${val.name}<br />数量:${val.value} 占比:${val.percent}%`
},
},
legend: [
{
data: ['成功量'],
left:'8%',
top:'5%',
icon:'circle',
formatter: (name) => {
let target
option.series[0].data.forEach((item) => {
if (item.name === name) {
target = item.value
}
})
return `${name} \n {fat|${target}}`
},
itemWidth:10,
textStyle: {
padding: [30, 0, 0, 0],
fontSize: 14,
color: '#8C8C8C',
rich: {
fat: {
fontWeight: 600,
color: '#262626',
fontSize: 14,
lineHeight: 30,
},
},
},
},
{
data: ['失败量'],
right:'8%',
top:'5%',
icon:'circle',
formatter: (name) => {
let target
option.series[0].data.forEach((item) => {
if (item.name === name) {
target = item.value
}
})
return `${name} \n {fat|${target}}`
},
itemWidth:10,
textStyle: {
padding: [30, 0, 0, 0],
fontSize: 14,
color: '#8C8C8C',
rich: {
fat: {
fontWeight: 600,
color: '#262626',
fontSize: 14,
lineHeight: 30,
},
},
},
}
],
startAngle: 180,
series: [
{
type: 'pie',
hoverAnimation: false,
radius: ['90%', '100%'],
center: ['50%', '68%'],
startAngle: 180,
label: {
normal: {
show: false,
position: 'center',
},
},
color: ['#8779FD', '#F7C739'],
data: data,
},
],
}
myChart.setOption(option)
window.addEventListener('resize', function () {
myChart.resize()
})
},
},
mounted() {
this.initChart()
},
}
</script>
<style lang='less' scoped>
.service-call-chart {
width: 100%;
height: 198px;
overflow: hidden;
position: relative;
text-align: center;
#callChart {
width: 100%;
height: 100%;
position: absolute;
left:0;
top:0;
}
.chart-rate{
display: inline-block;
margin-top:140px;
background: #FAFAFA;
padding:6px 16px;
font-size: 12px;
color:#595959;
.rate-level-down {
color: #52c41a;
margin-left: 10px;
}
.rate-level-up {
color: #f5222d;
margin-left: 10px;
}
.rate-level-num{
font-weight: 600;
}
}
}
</style>


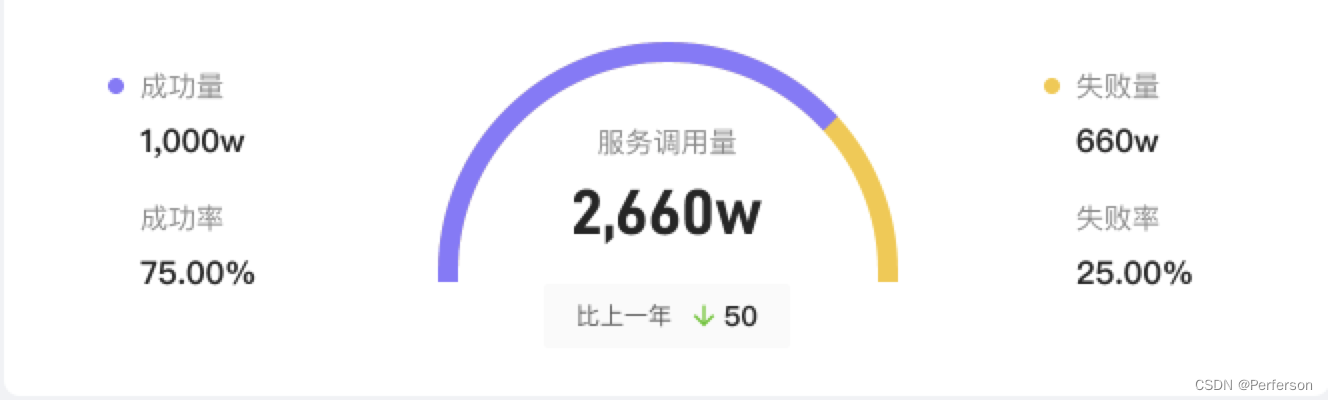
 该代码段展示了一个使用Echarts库创建的饼图,用于显示服务调用的成功量和失败量。图表包括百分比和详细数据标签,并有动态调整大小的功能。


 3293
3293


 被折叠的 条评论
为什么被折叠?
被折叠的 条评论
为什么被折叠?
 到【灌水乐园】发言


