


通过网络上各路大佬们的文字指导
终于在小程序中成功加入了echarts
接下来 就简单的记录和总结一下
先来看下效果图

接下来步入正题
下载
GitHub上的ecomfe/echarts-for-weixin项目

我是直接把 ec-canvas文件夹放到了项目中
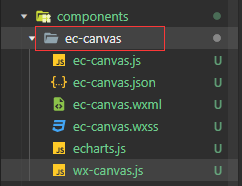
各个文件中的内容
wxml
<view class="box">
  <ec-canvas id="mychart-dom-bar" canvas-id="mychart-bar" ec="{{ ec }}"></ec-canvas>
</view>
wxss
.box {
  width: 700rpx;
  height: 500rpx;
  position: absolute;
  top: 0;
  bottom: 0;
  left: 0;
  right: 0;
}
json
{
  "usingComponents": {
    "ec-canvas": "../../components/ec-canvas/ec-canvas"
  }
}
js
echarts官网
不同类型的图表只需要替换option对象中的内容即可
// 1、引入依赖脚本
import * as echarts from '../../components/ec-canvas/echarts';

// 2、进行初始化数据
function initChart(canvas, width, height) {
  console.log(canvas, width, height);
  // canvas => id="mychart-bar" 的画布
  // width, height => 在wxss中设置的宽高
  const chart = echarts.init(canvas, null, {
    width: width,
    height: height
  });
  canvas.setChart(chart);

  // option中的内容可以在echarts官网找到对应图表的格式进行修改
  var option = {
    xAxis: {
      data: ['Mon', 'Tue', 'Wed', 'Thu', 'Fri', 'Sat', 'Sun']
    },
    yAxis: {},
    series: [
      {
        type: 'bar',
        data: [23, 24, 18, 25, 27, 28, 25]
      }
    ],
    title: {
      text: '标题',
      left: 'center'
    },
    tooltip: {
      show: true,
      trigger: 'axis'
    }
    // 图例
    // legend: {
    //   data: ['A', 'B', 'C'],
    //   top: 50,
    //   left: 'center',
    //   backgroundColor: 'red',
    //   z: 100
    // },
  };

  chart.setOption(option);
  return chart;
}

Page({
  /**
   * 页面的初始数据
   */
  data: {
    ec: {
      onInit: initChart
      // 3、将数据放入到里面,initChart已经返回chart对象了,所以不要加(),会报错
    }
  }
})
在这里感谢https://www.cnblogs.com/wasbg/p/14284192.html这篇博主的指点
觉得本文不咋地的可以移步上述博主的文章中一探究竟,相信会对大家有所帮助的!
有更多好的意见和建议也欢迎大家评论指出!


 7490
7490


 被折叠的 条评论
为什么被折叠?
被折叠的 条评论
为什么被折叠?
 到【灌水乐园】发言


