


一、复制集状态查看
复制集状态查询命令
①.复制集状态查询:rs.status()
②.查看oplog状态: rs.printReplicationInfo()
③.查看复制延迟: rs.printSlaveReplicationInfo()
④.查看服务状态详情: db.serverStatus()
1).rs.status()
self:只会出现在执行rs.status()命令的成员里
uptime:从本节点 网络可达到当前所经历的时间
lastHeartbeat:当前服务器最后一次收到其心中的时间
Optime & optimeDate:命令发出时oplog所记录的操作时间戳
pingMs: 网络延迟
syncingTo: 复制源
stateStr:
可提供服务的状态:primary, secondary, arbiter
即将提供服务的状态:startup, startup2, recovering
不可提供服务状态:down,unknow,removed,rollback,fatal
2).rs.printReplicationInfo()
log length start to end: 当oplog写满时可以理解为时间窗口
oplog last event time: 最后一个操作发生的时间
3).rs.printSlaveReplicationInfo()
复制进度:synedTo
落后主库的时间:X secs(X hrs)behind the primary
4).db.serverStatus()
可以使用如下命令查找需要用到的信息
db.serverStatus.opcounterRepl
db.serverStatus.repl
5).常用监控项目:
QPS: 每秒查询数量
I/O: 读写性能
Memory: 内存使用
Connections: 连接数
Page Faults: 缺页中断
Index hit: 索引命中率
Bakground flush: 后台刷新
Queue: 队列
二、复制集常用监控工具
1).mongostat
-h, --host 主机名或 主机名:端口
--port 端口号
-u ,--uername 用户名(验证)
-p ,--password 密码(验证)
--authenticationDatabase 从哪个库进行验证
--discover 发现集群某个其他节点
changwen@ubuntu:~$ mongostat -h 192.168.23.129:28001

changwen@ubuntu:~$ mongostat -h 192.168.23.129:28001  --discover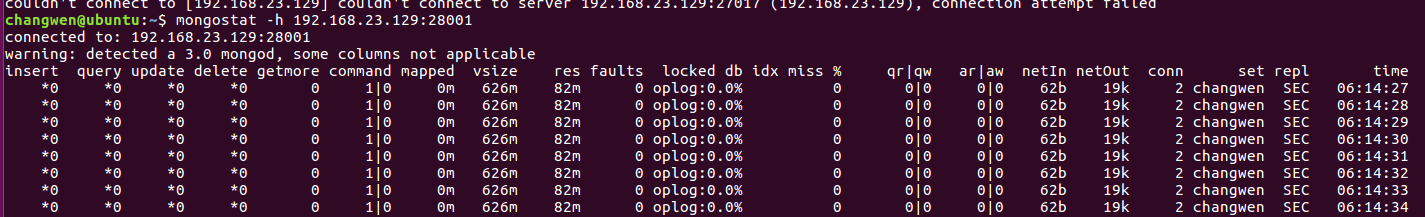
mongostat重点关注的字段
getmore 大量的排序操作在进行
faults 需要的数据不在内存中
locked db 锁比例最高的库
index miss 索引未命中
qr|qw 读写产生队列,供求失衡
2).mongostop:与mongostat基本一样
-h, --host 主机名或 主机名:端口
--port 端口号
-u ,--uername 用户名(验证)
-p ,--password 密码(验证)
--authenticationDatabase 从哪个库进行验证
3).mongosniff--复制集有抓包工具
changwen@ubuntu:/usr/local/mongoDB/bin$ sudo ./mongosniff --help
Usage: mongosniff [--help] [--forward host:port] [--objcheck] [--source (NET <interface> | (FILE | DIAGLOG) <filename>)] [<port0> <port1> ... ]
--help          Print this help message.
--forward       Forward all parsed request messages to mongod instance at
                specified host:port
--source        Source of traffic to sniff, either a network interface or a
                file containing previously captured packets in pcap format,
                or a file containing output from mongod's --diaglog option.
                If no source is specified, mongosniff will attempt to sniff
                from one of the machine's network interfaces.
--objcheck      Log hex representation of invalid BSON documents and nothing
                else.  Spurious messages about invalid documents may result
                when there are dropped tcp packets.
<port0>...      These parameters are used to filter sniffing.  By default,
                only port 27017 is sniffed.

changwen@ubuntu:/usr/local/mongoDB/bin$ ifconfig
ens33     Link encap:Ethernet  HWaddr 00:0c:29:d0:64:58
          inet addr:192.168.23.129  Bcast:192.168.23.255  Mask:255.255.255.0
          inet6 addr: fe80::1381:709e:cfa6:5063/64 Scope:Link
          UP BROADCAST RUNNING MULTICAST  MTU:1500  Metric:1
          RX packets:55356 errors:0 dropped:0 overruns:0 frame:0
          TX packets:14779 errors:0 dropped:0 overruns:0 carrier:0
          collisions:0 txqueuelen:1000
          RX bytes:57578721 (57.5 MB)  TX bytes:909977 (909.9 KB)

lo        Link encap:Local Loopback
          inet addr:127.0.0.1  Mask:255.0.0.0
          inet6 addr: ::1/128 Scope:Host
          UP LOOPBACK RUNNING  MTU:65536  Metric:1
          RX packets:15001 errors:0 dropped:0 overruns:0 frame:0
          TX packets:15001 errors:0 dropped:0 overruns:0 carrier:0
          collisions:0 txqueuelen:1
          RX bytes:958280 (958.2 KB)  TX bytes:958280 (958.2 KB)

changwen@ubuntu:/usr/local/mongoDB/bin$ sudo ./mongosniff --source NET lo port 28001
sniffing... 0 28001


 1035
1035

 被折叠的 条评论
为什么被折叠?
被折叠的 条评论
为什么被折叠?
 到【灌水乐园】发言


