


Android ANR 线上监控,日志收集分析
本文对anr进行全面的分析,目标解决遇到的所有anr问题
项目地址:https://github.com/YanqiangChen/AnrCanary 项目地址
Anr流程
目前市面上监控anr大多数不完善监控不到所有的anr问题,首先我们要知道anr的流程,才能更好的监控分析anr问题
1.anr如何产生
可以看下字节的相关文章
字节分析的anr原理
2.发生anr后的流程
所有的anr发生,都是调用com.android.server.am.ProcessRecord appNotResponding方法,下面我们就来分析下这个方法
void appNotResponding(String activityShortComponentName, ApplicationInfo aInfo,
            String parentShortComponentName, WindowProcessController parentProcess,
            boolean aboveSystem, String annotation) {
        ArrayList<Integer> firstPids = new ArrayList<>(5);
        SparseArray<Boolean> lastPids = new SparseArray<>(20);

        mWindowProcessController.appEarlyNotResponding(annotation, () -> kill("anr", true));

        long anrTime = SystemClock.uptimeMillis();
        if (isMonitorCpuUsage()) {
            mService.updateCpuStatsNow();
        }

        synchronized (mService) {
            // PowerManager.reboot() can block for a long time, so ignore ANRs while shutting down.
            if (mService.mAtmInternal.isShuttingDown()) {   //1 判断是否正在关闭状态
                Slog.i(TAG, "During shutdown skipping ANR: " + this + " " + annotation);
                return;
            } else if (isNotResponding()) {		//正在处于anr状态
                Slog.i(TAG, "Skipping duplicate ANR: " + this + " " + annotation);
                return;
            } else if (isCrashing()) {		//正在crash的状态
                Slog.i(TAG, "Crashing app skipping ANR: " + this + " " + annotation);
                return;
            } else if (killedByAm) {		//被kill的状态
                Slog.i(TAG, "App already killed by AM skipping ANR: " + this + " " + annotation);
                return;
            } else if (killed) {	//被kill的状态
                Slog.i(TAG, "Skipping died app ANR: " + this + " " + annotation);
                return;
            }

            // In case we come through here for the same app before completing
            // this one, mark as anring now so we will bail out.
            setNotResponding(true);   //2 设置anr标志

            // Log the ANR to the event log.
            EventLog.writeEvent(EventLogTags.AM_ANR, userId, pid, processName, info.flags,
                    annotation);

            // Dump thread traces as quickly as we can, starting with "interesting" processes.
            firstPids.add(pid);	//3 收集发生ANR的进程

            // Don't dump other PIDs if it's a background ANR
            if (!isSilentAnr()) {	 //判断是否是后台anr
                int parentPid = pid;   //
                if (parentProcess != null && parentProcess.getPid() > 0) {
                    parentPid = parentProcess.getPid();
                }
                if (parentPid != pid) firstPids.add(parentPid);	//收集父进程

                if (MY_PID != pid && MY_PID != parentPid) firstPids.add(MY_PID);

                for (int i = getLruProcessList().size() - 1; i >= 0; i--) {
                    ProcessRecord r = getLruProcessList().get(i);	//轮训AMS维护的lru list
                    if (r != null && r.thread != null) {
                        int myPid = r.pid;
                        if (myPid > 0 && myPid != pid && myPid != parentPid && myPid != MY_PID) {
                            if (r.isPersistent()) {	//判断persistent进程
                                firstPids.add(myPid);
                                if (DEBUG_ANR) Slog.i(TAG, "Adding persistent proc: " + r);
                            } else if (r.treatLikeActivity) {	//BIND_TREAT_LIKE_ACTIVITY
                                firstPids.add(myPid);
                                if (DEBUG_ANR) Slog.i(TAG, "Adding likely IME: " + r);
                            } else {
                                lastPids.put(myPid, Boolean.TRUE);  //都则加入到其他进程集合
                                if (DEBUG_ANR) Slog.i(TAG, "Adding ANR proc: " + r);
                            }
                        }
                    }
                }
            }
        }

        // Log the ANR to the main log.
        StringBuilder info = new StringBuilder();
        info.setLength(0);
        info.append("ANR in ").append(processName);
        if (activityShortComponentName != null) {
            info.append(" (").append(activityShortComponentName).append(")");
        }
        info.append("\n");
        info.append("PID: ").append(pid).append("\n");
        if (annotation != null) {
            info.append("Reason: ").append(annotation).append("\n");
        }
        if (parentShortComponentName != null
                && parentShortComponentName.equals(activityShortComponentName)) {
            info.append("Parent: ").append(parentShortComponentName).append("\n");
        }

        ProcessCpuTracker processCpuTracker = new ProcessCpuTracker(true);

        // don't dump native PIDs for background ANRs unless it is the process of interest
        String[] nativeProcs = null;
        if (isSilentAnr()) {
            for (int i = 0; i < NATIVE_STACKS_OF_INTEREST.length; i++) {
                if (NATIVE_STACKS_OF_INTEREST[i].equals(processName)) {
                    nativeProcs = new String[] { processName };
                    break;
                }
            }
        } else {
            nativeProcs = NATIVE_STACKS_OF_INTEREST;
        }

        int[] pids = nativeProcs == null ? null : Process.getPidsForCommands(nativeProcs);
        ArrayList<Integer> nativePids = null;

        if (pids != null) {
            nativePids = new ArrayList<>(pids.length);
            for (int i : pids) {
                nativePids.add(i);   //收集一些native进程
            }
        }

        // For background ANRs, don't pass the ProcessCpuTracker to
        // avoid spending 1/2 second collecting stats to rank lastPids.
        File tracesFile = ActivityManagerService.dumpStackTraces(firstPids,
                (isSilentAnr()) ? null : processCpuTracker, (isSilentAnr()) ? null : lastPids,
                nativePids);			//dump进程的堆栈

        String cpuInfo = null;
        if (isMonitorCpuUsage()) {
            mService.updateCpuStatsNow();
            synchronized (mService.mProcessCpuTracker) {
                cpuInfo = mService.mProcessCpuTracker.printCurrentState(anrTime);
            }
            info.append(processCpuTracker.printCurrentLoad());
            info.append(cpuInfo);
        }

        info.append(processCpuTracker.printCurrentState(anrTime));

        Slog.e(TAG, info.toString());
        if (tracesFile == null) {
            // There is no trace file, so dump (only) the alleged culprit's threads to the log
            Process.sendSignal(pid, Process.SIGNAL_QUIT);
        }

        StatsLog.write(StatsLog.ANR_OCCURRED, uid, processName,
                activityShortComponentName == null ? "unknown": activityShortComponentName,
                annotation,
                (this.info != null) ? (this.info.isInstantApp()
                        ? StatsLog.ANROCCURRED__IS_INSTANT_APP__TRUE
                        : StatsLog.ANROCCURRED__IS_INSTANT_APP__FALSE)
                        : StatsLog.ANROCCURRED__IS_INSTANT_APP__UNAVAILABLE,
                isInterestingToUserLocked()
                        ? StatsLog.ANROCCURRED__FOREGROUND_STATE__FOREGROUND
                        : StatsLog.ANROCCURRED__FOREGROUND_STATE__BACKGROUND,
                getProcessClassEnum(),
                (this.info != null) ? this.info.packageName : "");
        final ProcessRecord parentPr = parentProcess != null
                ? (ProcessRecord) parentProcess.mOwner : null;
        mService.addErrorToDropBox("anr", this, processName, activityShortComponentName,
                parentShortComponentName, parentPr, annotation, cpuInfo, tracesFile, null);

        if (mWindowProcessController.appNotResponding(info.toString(), () -> kill("anr", true),
                () -> {
                    synchronized (mService) {
                        mService.mServices.scheduleServiceTimeoutLocked(this);
                    }
                })) {
            return;
        }

        synchronized (mService) {
            // mBatteryStatsService can be null if the AMS is constructed with injector only. This
            // will only happen in tests.
            if (mService.mBatteryStatsService != null) {
                mService.mBatteryStatsService.noteProcessAnr(processName, uid);
            }

            if (isSilentAnr() && !isDebugging()) {
                kill("bg anr", true);
                return;
            }

            // Set the app's notResponding state, and look up the errorReportReceiver
            makeAppNotRespondingLocked(activityShortComponentName,
                    annotation != null ? "ANR " + annotation : "ANR", info.toString());

            // mUiHandler can be null if the AMS is constructed with injector only. This will only
            // happen in tests.
            if (mService.mUiHandler != null) {
                // Bring up the infamous App Not Responding dialog
                Message msg = Message.obtain();
                msg.what = ActivityManagerService.SHOW_NOT_RESPONDING_UI_MSG;
                msg.obj = new AppNotRespondingDialog.Data(this, aInfo, aboveSystem);

                mService.mUiHandler.sendMessage(msg);
            }
        }
    }

//开始dump收集进程的堆栈
com.android.server.am.ActivityManagerService
public static File dumpStackTraces(ArrayList<Integer> firstPids,
            ProcessCpuTracker processCpuTracker, SparseArray<Boolean> lastPids,
            ArrayList<Integer> nativePids) {
        ArrayList<Integer> extraPids = null;

        Slog.i(TAG, "dumpStackTraces pids=" + lastPids + " nativepids=" + nativePids);

        // Measure CPU usage as soon as we're called in order to get a realistic sampling
        // of the top users at the time of the request.
        if (processCpuTracker != null) {
            processCpuTracker.init();
            try {
                Thread.sleep(200);
            } catch (InterruptedException ignored) {
            }

            processCpuTracker.update();

            // We'll take the stack crawls of just the top apps using CPU.
            final int N = processCpuTracker.countWorkingStats();
            extraPids = new ArrayList<>();
            for (int i = 0; i < N && extraPids.size() < 5; i++) {
                ProcessCpuTracker.Stats stats = processCpuTracker.getWorkingStats(i);
                if (lastPids.indexOfKey(stats.pid) >= 0) {
                    if (DEBUG_ANR) Slog.d(TAG, "Collecting stacks for extra pid " + stats.pid);

                    extraPids.add(stats.pid);		//搜索cpu占比比较高的5个进程
                } else {
                    Slog.i(TAG, "Skipping next CPU consuming process, not a java proc: "
                            + stats.pid);
                }
            }
        }

        final File tracesDir = new File(ANR_TRACE_DIR);
        // Each set of ANR traces is written to a separate file and dumpstate will process
        // all such files and add them to a captured bug report if they're recent enough.
        maybePruneOldTraces(tracesDir);

        // NOTE: We should consider creating the file in native code atomically once we've
        // gotten rid of the old scheme of dumping and lot of the code that deals with paths
        // can be removed.
        File tracesFile = createAnrDumpFile(tracesDir);
        if (tracesFile == null) {
            return null;
        }

        dumpStackTraces(tracesFile.getAbsolutePath(), firstPids, nativePids, extraPids);   //继续dump进程堆栈
        return tracesFile;
    }

//分别dump firstPids,nativePids,extraPids进程堆栈
public static void dumpStackTraces(String tracesFile, ArrayList<Integer> firstPids,
            ArrayList<Integer> nativePids, ArrayList<Integer> extraPids) {

        Slog.i(TAG, "Dumping to " + tracesFile);

        // We don't need any sort of inotify based monitoring when we're dumping traces via
        // tombstoned. Data is piped to an "intercept" FD installed in tombstoned so we're in full
        // control of all writes to the file in question.

        // We must complete all stack dumps within 20 seconds.
        long remainingTime = 20 * 1000;

        // First collect all of the stacks of the most important pids.
        if (firstPids != null) {
            int num = firstPids.size();
            for (int i = 0; i < num; i++) {
                Slog.i(TAG, "Collecting stacks for pid " + firstPids.get(i));
                final long timeTaken = dumpJavaTracesTombstoned(firstPids.get(i), tracesFile,
                                                                remainingTime);

                remainingTime -= timeTaken;
                if (remainingTime <= 0) {
                    Slog.e(TAG, "Aborting stack trace dump (current firstPid=" + firstPids.get(i) +
                           "); deadline exceeded.");
                    return;
                }

                if (DEBUG_ANR) {
                    Slog.d(TAG, "Done with pid " + firstPids.get(i) + " in " + timeTaken + "ms");
                }
            }
        }

        // Next collect the stacks of the native pids
        if (nativePids != null) {
            for (int pid : nativePids) {
                Slog.i(TAG, "Collecting stacks for native pid " + pid);
                final long nativeDumpTimeoutMs = Math.min(NATIVE_DUMP_TIMEOUT_MS, remainingTime);

                final long start = SystemClock.elapsedRealtime();
                Debug.dumpNativeBacktraceToFileTimeout(
                        pid, tracesFile, (int) (nativeDumpTimeoutMs / 1000));
                final long timeTaken = SystemClock.elapsedRealtime() - start;

                remainingTime -= timeTaken;
                if (remainingTime <= 0) {
                    Slog.e(TAG, "Aborting stack trace dump (current native pid=" + pid +
                        "); deadline exceeded.");
                    return;
                }

                if (DEBUG_ANR) {
                    Slog.d(TAG, "Done with native pid " + pid + " in " + timeTaken + "ms");
                }
            }
        }

        // Lastly, dump stacks for all extra PIDs from the CPU tracker.
        if (extraPids != null) {
            for (int pid : extraPids) {
                Slog.i(TAG, "Collecting stacks for extra pid " + pid);

				//调用Debug.dumpJavaBacktraceToFileTimeout
                final long timeTaken = dumpJavaTracesTombstoned(pid, tracesFile, remainingTime);

                remainingTime -= timeTaken;
                if (remainingTime <= 0) {
                    Slog.e(TAG, "Aborting stack trace dump (current extra pid=" + pid +
                            "); deadline exceeded.");
                    return;
                }

                if (DEBUG_ANR) {
                    Slog.d(TAG, "Done with extra pid " + pid + " in " + timeTaken + "ms");
                }
            }
        }
        Slog.i(TAG, "Done dumping");
    }


//最后调用到native
system/core/debuggerd/client/debuggerd_client.cpp:
bool debuggerd_trigger_dump(pid_t tid, DebuggerdDumpType dump_type, unsigned int timeout_ms, unique_fd output_fd) {
    pid_t pid = tid;
    //......

    // Send the signal.
    //通过sigqueue向需要dump堆栈的进程发送SIGQUIT信号,每一个应用进程都会有一个SignalCatcher线程,专门处理SIGQUIT
    const int signal = (dump_type == kDebuggerdJavaBacktrace) ? SIGQUIT : BIONIC_SIGNAL_DEBUGGER;
    sigval val = {.sival_int = (dump_type == kDebuggerdNativeBacktrace) ? 1 : 0};
    if (sigqueue(pid, signal, val) != 0) {
      log_error(output_fd, errno, "failed to send signal to pid %d", pid);
      return false;
    }
    //......
    LOG(INFO) << TAG "done dumping process " << pid;
    return true;
}

//SignalCatcher线程处理SIGQUIT信号
art/runtime/signal_catcher.cc:

void* SignalCatcher::Run(void* arg) {
    //......
    // Set up mask with signals we want to handle.
    SignalSet signals;
    signals.Add(SIGQUIT);
    signals.Add(SIGUSR1);
    while (true) {
        int signal_number = signal_catcher->WaitForSignal(self, signals);
        if (signal_catcher->ShouldHalt()) {
            runtime->DetachCurrentThread();
            return nullptr;
        }
        switch (signal_number) {
            case SIGQUIT:
                  signal_catcher->HandleSigQuit();
                  break;
            case SIGUSR1:
                  signal_catcher->HandleSigUsr1();
                  break;
            default:
                  LOG(ERROR) << "Unexpected signal %d" << signal_number;
                  break;
        }
    }
}
针对上边的代码进行解释
1.appNotResponding会收集一些进行,比如anr发生的进行,父进程,Persistent 进程,CPU占比比较高的进程,等一些比较重要的进程
2.dumpStackTraces方法会dump进程的堆栈信息,通过发送SIGQUIT信号
3.SignalCatcher接收SIGQUIT信号,收集进程信息,写入trace文件
捕获SIGQUIT,获取Anr Trace代码实现
MatrixTracer.cc
bool SignalHandler::installHandlersLocked() {
    if (sHandlerInstalled) {
        return false;
    }

    if (sigaction(TARGET_SIG, nullptr, &sOldHandlers) == -1) {
        return false;
    }

    struct sigaction sa{};
    sa.sa_sigaction = signalHandler;
    sa.sa_flags = SA_ONSTACK | SA_SIGINFO | SA_RESTART;

    if (sigaction(TARGET_SIG, &sa, nullptr) == -1) {   //使用sigaction方法注册signal handler进行异步监听
        return false;
    }

    sHandlerInstalled = true;
    return true;
}
sigaction 注册SIGQUIT信号,(TARGET_SIG是定义的一个常量,值为SIGQUIT),发生anr时会调用signalHandler
void AnrDumper::handleSignal(int sig, const siginfo_t *info, void *uc) {
    int fromPid1 = info->_si_pad[3];
    int fromPid2 = info->_si_pad[4];
    int myPid = getpid();
    bool fromMySelf = fromPid1 == myPid || fromPid2 == myPid;
    if (sig == SIGQUIT) {
        pthread_t thd;
        if (!fromMySelf) {
            pthread_create(&thd, nullptr, anrCallback, nullptr);  //会执行anrcallback
        } else {
            pthread_create(&thd, nullptr, siUserCallback, nullptr);
        }
        pthread_detach(thd);
    }
}
anr发生会触发handleSignal,在子线程中调用anrCallback
static void *anrCallback(void* arg) {
    anrDumpCallback();   //调用java onANRDumped
    if (strlen(mAnrTraceFile) > 0) {
        hookAnrTraceWrite(false);   //hook Signal Catcher线程获取ANR Trace
    }
    sendSigToSignalCatcher();   //重新向SignalCatcher发送SIGQUIT
    return nullptr;
}
1.anrCallback 会调用hookAnrTraceWrite,Hook Signal Catcher线程获取Socket Write 函数 ANR Trace
2.重新发送SIGQUIT给SignalCatcher,保证原本的dump堆栈的逻辑继续执行
void hookAnrTraceWrite(bool isSiUser) {

    //......

    if (apiLevel >= 27) {
        xhook_grouped_register(HOOK_REQUEST_GROUPID_ANR_DUMP_TRACE, ".*libcutils\\.so$",
                               "connect", (void *) my_connect, (void **) (&original_connect));
    } else {
        xhook_grouped_register(HOOK_REQUEST_GROUPID_ANR_DUMP_TRACE, ".*libart\\.so$",
                               "open", (void *) my_open, (void **) (&original_open));
    }

    if (apiLevel >= 30 || apiLevel == 25 || apiLevel == 24) {
        xhook_grouped_register(HOOK_REQUEST_GROUPID_ANR_DUMP_TRACE, ".*libc\\.so$",
                               "write", (void *) my_write, (void **) (&original_write));
    } else if (apiLevel == 29) {
        xhook_grouped_register(HOOK_REQUEST_GROUPID_ANR_DUMP_TRACE, ".*libbase\\.so$",
                               "write", (void *) my_write, (void **) (&original_write));
    } else {
        xhook_grouped_register(HOOK_REQUEST_GROUPID_ANR_DUMP_TRACE, ".*libart\\.so$",
                               "write", (void *) my_write, (void **) (&original_write));
    }

    xhook_refresh(true);
}

int my_connect(int __fd, const struct sockaddr* __addr, socklen_t __addr_length) {
    if (__addr!= nullptr) {
        if (strcmp(__addr->sa_data, HOOK_CONNECT_PATH) == 0) {    //系统会先使用connet方法链接一个path为“/dev/socket/tombstoned_java_trace”的socket,我们可以hook connect方法,拿到这个socket的name
            signalCatcherTid = gettid();
            isTraceWrite = true;
        }
    }
    return original_connect(__fd, __addr, __addr_length);
}

int (*original_open)(const char *pathname, int flags, mode_t mode);

int my_open(const char *pathname, int flags, mode_t mode) {
    if (pathname!= nullptr) {
        if (strcmp(pathname, HOOK_OPEN_PATH) == 0) {   //判断 connect path /dev/socket/tombstoned_java_trace
            signalCatcherTid = gettid();
            isTraceWrite = true;
        }
    }
    return original_open(pathname, flags, mode);
}

ssize_t my_write(int fd, const void* const buf, size_t count) {
    if(isTraceWrite && gettid() == signalCatcherTid) {
        isTraceWrite = false;
        signalCatcherTid = 0;
        if (buf != nullptr) {
            std::string targetFilePath;
            if (fromMyPrintTrace) {
                targetFilePath = printTracePathString;
            } else {
                targetFilePath = anrTracePathString;
            }
            if (!targetFilePath.empty()) {
                char *content = (char *) buf;
                writeAnr(content, targetFilePath);
                if(!fromMyPrintTrace) {
                    anrDumpTraceCallback();
                } else {
                    printTraceCallback();
                }
                fromMyPrintTrace = false;
            }
        }
    }
    return original_write(fd, buf, count);
}
这里处理Signal Catcher线程open/connect后的第一次write,所有hook了connect/open,hook connect/open 会判断是否是Anr Trace文件路径,然后决定是否获取write内容
my_write 调用 writeAnr(content, targetFilePath); 写入anr trace信息到指定的文件
AnrDumper::AnrDumper(const char* anrTraceFile, const char* printTraceFile) {
    // must unblock SIGQUIT, otherwise the signal handler can not capture SIGQUIT
    mAnrTraceFile = anrTraceFile;
    mPrintTraceFile = printTraceFile;
    sigset_t sigSet;
    sigemptyset(&sigSet);
    sigaddset(&sigSet, SIGQUIT);
    pthread_sigmask(SIG_UNBLOCK, &sigSet , &old_sigSet);
}
这里还要注意一点,Android默认把SIGQUIT设置成了BLOCKED,所以只会响应sigwait而不会进入到我们设置的handler方法中。我们通过pthread_sigmask或者sigprocmask把SIGQUIT设置为UNBLOCK,那么再次收到SIGQUIT时,就一定会进入到我们的handler方法中
确认ANR是否发生
收到SIGQUIT不一定就发生了anr,需要进一步判断,这里主要有两种方案判断:
1.Anr Flag
appNotResponding 会执行makeAppNotRespondingLocked方法中,在这里会给发生ANR进程标记一个NOT_RESPONDING的flag。而这个flag我们可以通过ActivityManager来获取:
private static boolean checkErrorState() {
        try {
            MatrixLog.i(TAG, "[checkErrorState] start");
            Application application =
                    sApplication == null ? Matrix.with().getApplication() : sApplication;
            ActivityManager am = (ActivityManager) application
                    .getSystemService(Context.ACTIVITY_SERVICE);

            List<ActivityManager.ProcessErrorStateInfo> procs = am.getProcessesInErrorState();
            if (procs == null) {
                MatrixLog.i(TAG, "[checkErrorState] procs == null");
                return false;
            }

            longStrs.clear();
            for (ActivityManager.ProcessErrorStateInfo proc : procs) {
                longStrs.add(proc.longMsg);
                MatrixLog.i(TAG, "[checkErrorState] found Error State proccessName = %s, proc.condition = %d", proc.processName, proc.condition);

                if (proc.uid != android.os.Process.myUid()
                        && proc.condition == ActivityManager.ProcessErrorStateInfo.NOT_RESPONDING) {
                    MatrixLog.i(TAG, "maybe received other apps ANR signal");
                    return false;
                }

                if (proc.pid != android.os.Process.myPid()) continue;

                if (proc.condition != ActivityManager.ProcessErrorStateInfo.NOT_RESPONDING) {
                    continue;
                }

                MatrixLog.i(TAG, "error sate longMsg = %s", proc.longMsg);

                return true;
            }
            return false;
        } catch (Throwable t) {
            MatrixLog.e(TAG, "[checkErrorState] error : %s", t.getMessage());
        }
        return false;
    }
2.获取MessageQueue mMessages block时间判断
@RequiresApi(api = Build.VERSION_CODES.M)
    private static boolean isMainThreadBlocked() {
        try {
            MessageQueue mainQueue = Looper.getMainLooper().getQueue();
            Field field = mainQueue.getClass().getDeclaredField("mMessages");
            field.setAccessible(true);
            final Message mMessage = (Message) field.get(mainQueue);
            if (mMessage != null) {
                anrMessageString = mMessage.toString();
                MatrixLog.i(TAG, "anrMessageString = " + anrMessageString);
                long when = mMessage.getWhen();
                if (when == 0) {
                    return false;
                }
                long time = when - SystemClock.uptimeMillis();
                anrMessageWhen = time;
                long timeThreshold = BACKGROUND_MSG_THRESHOLD;
                if (currentForeground) {
                    timeThreshold = FOREGROUND_MSG_THRESHOLD;
                }
                return time < timeThreshold;
            } else {
                MatrixLog.i(TAG, "mMessage is null");
            }
        } catch (Exception e) {
            return false;
        }
        return false;
    }
ANR日志信息获取
1.获取ANR Info
 private static boolean checkErrorState() {
        try {
        	//......
            List<ActivityManager.ProcessErrorStateInfo> procs = am.getProcessesInErrorState();
            if (procs == null) {
                MatrixLog.i(TAG, "[checkErrorState] procs == null");
                return false;
            }

            longStrs.clear();
            for (ActivityManager.ProcessErrorStateInfo proc : procs) {
                longStrs.add(proc.longMsg);   //这里获取到anrInfo
                //......

                return true;
            }
            return false;
        } catch (Throwable t) {
            MatrixLog.e(TAG, "[checkErrorState] error : %s", t.getMessage());
        }
        return false;
    }
这里调用 longStrs.add(proc.longMsg); anrInfo加入到集合
2.获取主线程历史消息
首先看一下主线程Looper代码(这里分析的是 android31)
 public static void loop() {
        //......
        for (;;) {
            if (!loopOnce(me, ident, thresholdOverride)) {
                return;
            }
        }
    }
private static boolean loopOnce(final Looper me,
            final long ident, final int thresholdOverride) {
        Message msg = me.mQueue.next(); // might block
        //......
        final Printer logging = me.mLogging;
        if (logging != null) {
            logging.println(">>>>> Dispatching to " + msg.target + " "
                    + msg.callback + ": " + msg.what);   //消息执行前打印日志
        }
        // Make sure the observer won't change while processing a transaction.
        //......
        try {
            msg.target.dispatchMessage(msg);

        } catch (Exception exception) {

        } finally {
            ThreadLocalWorkSource.restore(origWorkSource);
            if (traceTag != 0) {
                Trace.traceEnd(traceTag);
            }
        }
        //......
        if (logging != null) {
            logging.println("<<<<< Finished to " + msg.target + " " + msg.callback);   //消息执行后打印日志
        }
        //......
        msg.recycleUnchecked();

        return true;
    }
可以看出来在消息的执行前后分别输出一段log,可以给looper设置log类,就可以知道消息的耗时情况
 private synchronized void resetPrinter() {
        Printer originPrinter = null;
        try {
            if (!isReflectLoggingError) {
                originPrinter = ReflectUtils.get(looper.getClass(), "mLogging", looper);
                if (originPrinter == printer && null != printer) {
                    return;
                }
                // Fix issues that printer loaded by different classloader
                if (originPrinter != null && printer != null) {
                    if (originPrinter.getClass().getName().equals(printer.getClass().getName())) {
                        MatrixLog.w(TAG, "LooperPrinter might be loaded by different classloader"
                                + ", my = " + printer.getClass().getClassLoader()
                                + ", other = " + originPrinter.getClass().getClassLoader());
                        return;
                    }
                }
            }
        } catch (Exception e) {
            isReflectLoggingError = true;
            Log.e(TAG, "[resetPrinter] %s", e);
        }

        if (null != printer) {
            MatrixLog.w(TAG, "maybe thread:%s printer[%s] was replace other[%s]!",
                    looper.getThread().getName(), printer, originPrinter);
        }
        looper.setMessageLogging(printer = new LooperPrinter(originPrinter));
        if (null != originPrinter) {
            MatrixLog.i(TAG, "reset printer, originPrinter[%s] in %s", originPrinter, looper.getThread().getName());
        }
    }
looper.setMessageLogging(printer = new LooperPrinter(originPrinter));
设置Looper mLogging
因此LooperPrinter println在执行消息的前后调用,根据输出的日志信息,判断是开始任务还是结束任务,调用dispatch isBegin参数表示是开始还是结束 log参数是当前输出的日志信息
private void dispatch(boolean isBegin, String log) {
        if (isBegin) {
            if (historyMsgRecorder) {
                messageStartTime = System.currentTimeMillis();
                if(messageEndTime-messageEndTime > 0){
                    recordMsg("IDLE", messageEndTime-messageStartTime);  //1处
                }
                latestMsgLog = log;
                recentMCount++;
            }
        } else {
            if (historyMsgRecorder) {
                messageEndTime = System.currentTimeMillis();
                recordMsg(log, System.currentTimeMillis() - messageStartTime);  //2处
            }
        }
    }
1.上述代码1处记录了上次消息结束到这次消息开始,耗费的时间
2.上述代码2处记录了这次消息耗时时间
private void recordMsg(final String log, final long duration) {

        historyMsgHandler.post(new Runnable() {
            @Override
            public void run() {
                totalTime+=duration;
                count++;
                if(log.contains("android.app.ActivityThread$H")){
                    enqueueHistoryMQ(new M(log, totalTime-duration,count--));
                    enqueueHistoryMQ(new M(log, duration,1));
                    count=0;
                    totalTime=0;
                }else if(totalTime >= 300){
                    if(totalTime>900){   //加上最后一次,明显大于300
                        enqueueHistoryMQ(new M(log, totalTime-duration,count--));
                        enqueueHistoryMQ(new M(log, duration,1));
                    }else{
                        enqueueHistoryMQ(new M(log, totalTime,count));
                    }
                    count=0;
                    totalTime=0;
                }

            }
        });


    }
1.recordMsg通过merge消息,减少内存的抖动
2.这里M对象记录了多条消息总的耗时,消息的数量
3.当有消息严重耗时,导致总耗时大于阀值的时候,需要把耗时大的消息记录起来
4. Activity,Service,Receiver,Provider 等组件消息单独记录
这里就实现了消息的聚合以及拆分
3.监控IdleHandler卡顿
Message next() {
        for (;;) {
            if (nextPollTimeoutMillis != 0) {
                Binder.flushPendingCommands();
            }
            nativePollOnce(ptr, nextPollTimeoutMillis);   // 1阻塞
            synchronized (this) {
                // Try to retrieve the next message.  Return if found.
                final long now = SystemClock.uptimeMillis();
                Message prevMsg = null;
                Message msg = mMessages;
                if (msg != null && msg.target == null) {
                    // Stalled by a barrier.  Find the next asynchronous message in the queue.
                    do {
                        prevMsg = msg;
                        msg = msg.next;
                    } while (msg != null && !msg.isAsynchronous());
                }
                if (msg != null) {
                    if (now < msg.when) {
                        // Next message is not ready.  Set a timeout to wake up when it is ready.
                        nextPollTimeoutMillis = (int) Math.min(msg.when - now, Integer.MAX_VALUE);
                    } else {
                        // Got a message.
                        mBlocked = false;
                        if (prevMsg != null) {
                            prevMsg.next = msg.next;
                        } else {
                            mMessages = msg.next;
                        }
                        msg.next = null;
                        if (DEBUG) Log.v(TAG, "Returning message: " + msg);
                        msg.markInUse();
                        return msg;
                    }
                } else {
                    // No more messages.
                    nextPollTimeoutMillis = -1;
                }

                // Process the quit message now that all pending messages have been handled.
                if (mQuitting) {
                    dispose();
                    return null;
                }

                // If first time idle, then get the number of idlers to run.
                // Idle handles only run if the queue is empty or if the first message
                // in the queue (possibly a barrier) is due to be handled in the future.
                if (pendingIdleHandlerCount < 0
                        && (mMessages == null || now < mMessages.when)) {
                    pendingIdleHandlerCount = mIdleHandlers.size();
                }
                if (pendingIdleHandlerCount <= 0) {
                    // No idle handlers to run.  Loop and wait some more.
                    mBlocked = true;
                    continue;
                }

                if (mPendingIdleHandlers == null) {
                    mPendingIdleHandlers = new IdleHandler[Math.max(pendingIdleHandlerCount, 4)];
                }
                mPendingIdleHandlers = mIdleHandlers.toArray(mPendingIdleHandlers);
            }

            // Run the idle handlers.
            // We only ever reach this code block during the first iteration.
            for (int i = 0; i < pendingIdleHandlerCount; i++) {
                final IdleHandler idler = mPendingIdleHandlers[i];
                mPendingIdleHandlers[i] = null; // release the reference to the handler

                boolean keep = false;
                try {
                    keep = idler.queueIdle();  // 2 IdleHandler消息
                } catch (Throwable t) {
                    Log.wtf(TAG, "IdleHandler threw exception", t);
                }

                if (!keep) {
                    synchronized (this) {
                        mIdleHandlers.remove(idler);
                    }
                }
            }

            // Reset the idle handler count to 0 so we do not run them again.
            pendingIdleHandlerCount = 0;

            // While calling an idle handler, a new message could have been delivered
            // so go back and look again for a pending message without waiting.
            nextPollTimeoutMillis = 0;
        }
    }
MessageQueue可以看出,大部分主线程操作是通过Message执行的,但是主线程空闲会执行IdleHandler,也是在主线程执行的,也会造成主线程耗时,所有这里要监控到耗时情况
private static void detectIdleHandler() {
        try {
            if (android.os.Build.VERSION.SDK_INT < android.os.Build.VERSION_CODES.M) {
                return;
            }
            MessageQueue mainQueue = Looper.getMainLooper().getQueue();
            Field field = MessageQueue.class.getDeclaredField("mIdleHandlers");
            field.setAccessible(true);
            MyArrayList<MessageQueue.IdleHandler> myIdleHandlerArrayList = new MyArrayList<>();
            field.set(mainQueue, myIdleHandlerArrayList);
            idleHandlerLagHandlerThread.start();
            idleHandlerLagHandler = new Handler(idleHandlerLagHandlerThread.getLooper());
        } catch (Throwable t) {
            MatrixLog.e(TAG, "reflect idle handler error = " + t.getMessage());
        }
    }
这里通过反射替换mIdleHandlers 集合为我们的集合,MyArrayList在add remove处理,最后拦截到IdleHandler queueIdle方法
4.监控TouchEvent卡顿
Touch事件处理也是在nativePollOnce 中
static void nativeInitTouchEventLagDetective(JNIEnv *env, jclass, jint threshold) {
    xhook_grouped_register(HOOK_REQUEST_GROUPID_TOUCH_EVENT_TRACE, ".*libinput\\.so$", "__sendto_chk",
                           (void *) my_sendto, (void **) (&original_sendto));
    xhook_grouped_register(HOOK_REQUEST_GROUPID_TOUCH_EVENT_TRACE, ".*libinput\\.so$", "sendto",
                           (void *) my_sendto, (void **) (&original_sendto));
    xhook_grouped_register(HOOK_REQUEST_GROUPID_TOUCH_EVENT_TRACE, ".*libinput\\.so$", "recvfrom",
                           (void *) my_recvfrom, (void **) (&original_recvfrom));
    xhook_refresh(true);

    TouchEventTracer::start(threshold);

}
Hook这对Socket的send和recv方法来监控Touch事件,关于Touch事件分发可以参考以下链接
参考文献:https://blog.csdn.net/liuwg1226/article/details/113774235
https://www.jianshu.com/p/b8b35d3ee052
5.监控SyncBarrier泄漏
后边会单独出一篇文章,详细分析下这个
6.耗时消息的堆栈信息收集
这里对耗时严重的消息进行堆栈信息的收集,主要方便分析历史消息导致的anr
	LooperAnrTracer:
	@Override
    public void onDispatchBegin(String log) {
        anrTask.beginRecord = AppMethodBeat.getInstance().maskIndex("AnrTracer#dispatchBegin");

        if (traceConfig.isDevEnv()) {
            MatrixLog.v(TAG, "* [dispatchBegin] index:%s", anrTask.beginRecord.index);
        }
        anrHandler.postDelayed(anrTask, Constants.DEFAULT_ANR);   //1处
        lagHandler.postDelayed(lagTask, Constants.DEFAULT_NORMAL_LAG);
    }

@Override
    public void onDispatchEnd(String log, long beginNs, long endNs) {
        if (traceConfig.isDevEnv()) {
            long cost = (endNs - beginNs) / Constants.TIME_MILLIS_TO_NANO;
            MatrixLog.v(TAG, "[dispatchEnd] beginNs:%s endNs:%s cost:%sms", beginNs, endNs, cost);
        }
        anrTask.getBeginRecord().release();
        anrHandler.removeCallbacks(anrTask);
        lagHandler.removeCallbacks(lagTask);
    }
Looper在消息开始前会调用onDispatchBegin,消息结束会调用 onDispatchEnd 。代码1处会发生一个定时消息,在超过时间阀值消息没有结束会触发调用anrTask run方法,收集堆栈等消息
@Override
        public void run() {
            long curTime = SystemClock.uptimeMillis();
            boolean isForeground = isForeground();
            // process
            int[] processStat = Utils.getProcessPriority(Process.myPid());

            // memory
            long[] memoryInfo = dumpMemory();   //dump内存情况

            // Thread state
            Thread.State status = Looper.getMainLooper().getThread().getState();     //获取主线程的状态
            String dumpStack;
            switch (traceConfig.getLooperPrinterStackStyle()) {   //获取主线程堆栈信息
                case TraceConfig.STACK_STYLE_WHOLE:
                    dumpStack = Utils.getWholeStack(Looper.getMainLooper().getThread().getStackTrace(), "|*\t\t");
                    break;
                case TraceConfig.STACK_STYLE_RAW:
                    dumpStack = Utils.getMainThreadJavaStackTrace();
                    break;
                case TraceConfig.STACK_STYLE_SIMPLE:
                default:
                    dumpStack = Utils.getStack(Looper.getMainLooper().getThread().getStackTrace(), "|*\t\t", 12);
            }


            // report
            try {
                TracePlugin plugin = Matrix.with().getPluginByClass(TracePlugin.class);
                if (null == plugin) {
                    return;
                }
                JSONObject jsonObject = new JSONObject();
                DeviceUtil.getDeviceInfo(jsonObject, Matrix.with().getApplication());
                jsonObject.put(SharePluginInfo.ISSUE_STACK_TYPE, Constants.Type.ANR);
                jsonObject.put(SharePluginInfo.ISSUE_THREAD_STACK, dumpStack);
                jsonObject.put(SharePluginInfo.ISSUE_PROCESS_PRIORITY, processStat[0]);
                jsonObject.put(SharePluginInfo.ISSUE_PROCESS_NICE, processStat[1]);
                jsonObject.put(SharePluginInfo.ISSUE_PROCESS_FOREGROUND, isForeground);
                // memory info
                JSONObject memJsonObject = new JSONObject();
                memJsonObject.put(SharePluginInfo.ISSUE_MEMORY_DALVIK, memoryInfo[0]);
                memJsonObject.put(SharePluginInfo.ISSUE_MEMORY_NATIVE, memoryInfo[1]);
                memJsonObject.put(SharePluginInfo.ISSUE_MEMORY_VM_SIZE, memoryInfo[2]);
                jsonObject.put(SharePluginInfo.ISSUE_MEMORY, memJsonObject);

                Issue issue = new Issue();
                issue.setKey(token + "");
                issue.setTag(SharePluginInfo.TAG_PLUGIN_EVIL_METHOD);
                issue.setContent(jsonObject);
                plugin.onDetectIssue(issue);

            } catch (JSONException e) {
                MatrixLog.e(TAG, "[JSONException error: %s", e);
            }

        }
这里收集了一些数据
1.进程的优先级,主线程的状态,java堆分配的内存,native分配的内存,主线程堆栈信息,CPU使用率,系统总内存,系统使用的内存大小等信息,辅助分析anr问题
7.获取主线程Block消息
获取主线程消息队列目前存在的未执行的消息也有助于我们分析Anr问题,如下可以获取到主线程消息队列未执行的消息
@RequiresApi(api = Build.VERSION_CODES.M)
    public static List<LooperMonitor.BlockMessage> getBlockMessage(){
        try {
            List<LooperMonitor.BlockMessage> list = new ArrayList<>();
            MessageQueue mainQueue = Looper.getMainLooper().getQueue();
            Field field = mainQueue.getClass().getDeclaredField("mMessages");
            field.setAccessible(true);
            Message mMessage = (Message) field.get(mainQueue);
            if(mMessage!=null){
                Field next = mMessage.getClass().getDeclaredField("next");
                next.setAccessible(true);
                Message nextMessage = mMessage;

                while (nextMessage != null){
                    long when = nextMessage.getWhen();
                    long blockTime = when - SystemClock.uptimeMillis();
                    LooperMonitor.BlockMessage blockMessage = new LooperMonitor.BlockMessage(blockTime,nextMessage.toString());
                    list.add(blockMessage);
                    nextMessage = (Message)next.get(nextMessage);

                }

            }
            return list;

        }catch (Exception e){
            return null;
        }


    }
案例分析
根据上述代码,我们可以获取到anrTrace文件,anrInfo文件,历史消息耗时情况,以及耗时消息的堆栈日志,当前消息队列block情况
1.案例一
我们在onclick中模拟一个耗时进行分析
findViewById(R.id.btn_anr).setOnClickListener(new View.OnClickListener() {
            @Override
            public void onClick(View v) {
                try {
                    Thread.sleep(10 * 1000);
                } catch (Exception e) {
                    e.printStackTrace();
                }
            }
        });
点击按钮两次会出现Anr
1.首先分析下Trace文件,
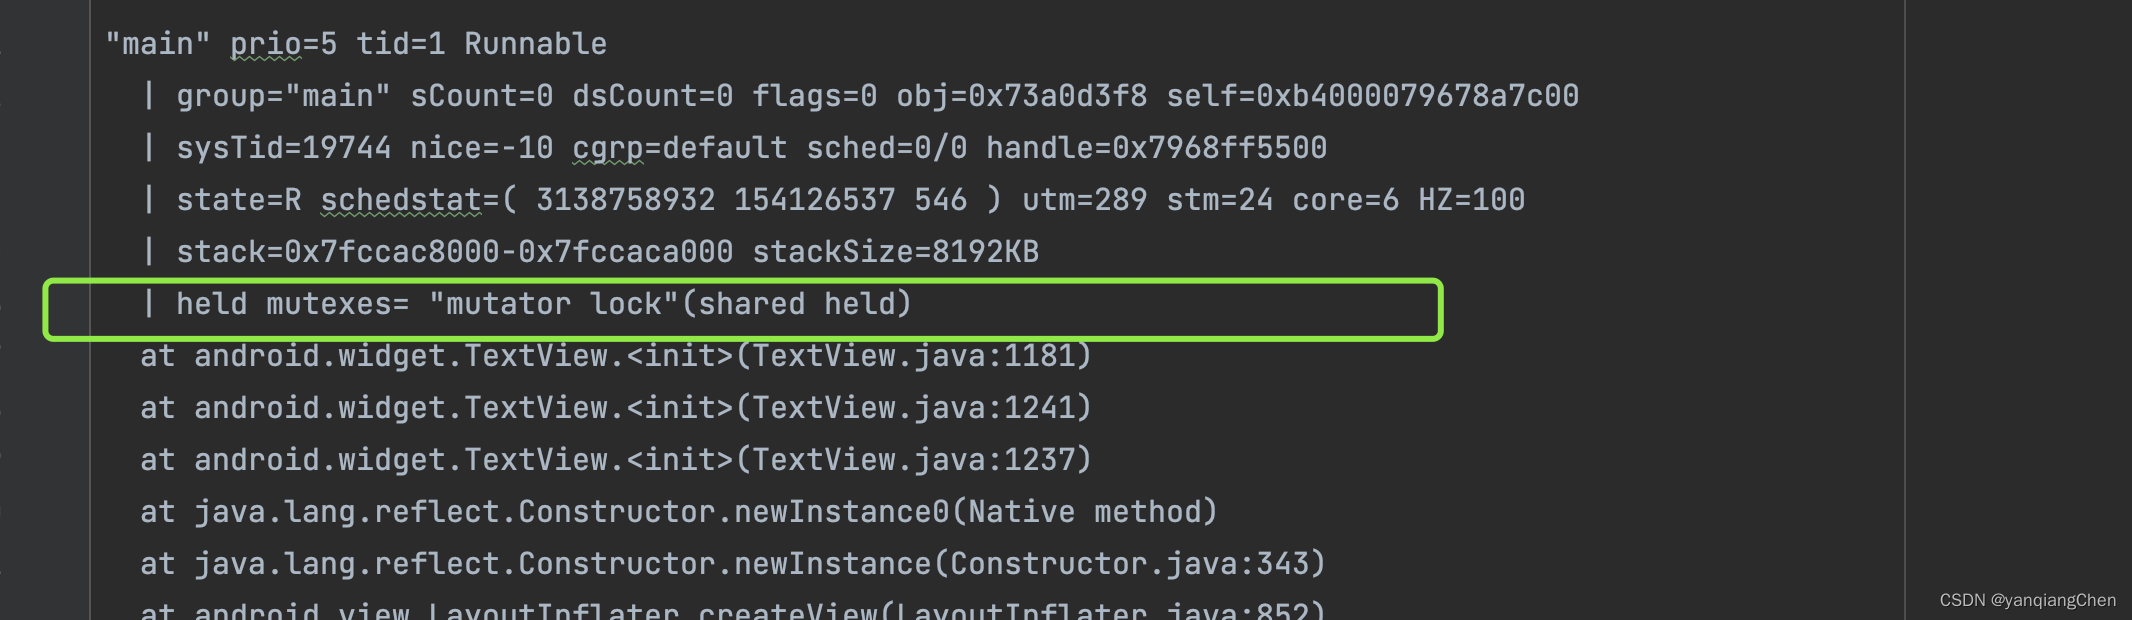
这里可以看到主线程被block,根据堆栈还可以定位到onClick方法
2.分析下anrInfo
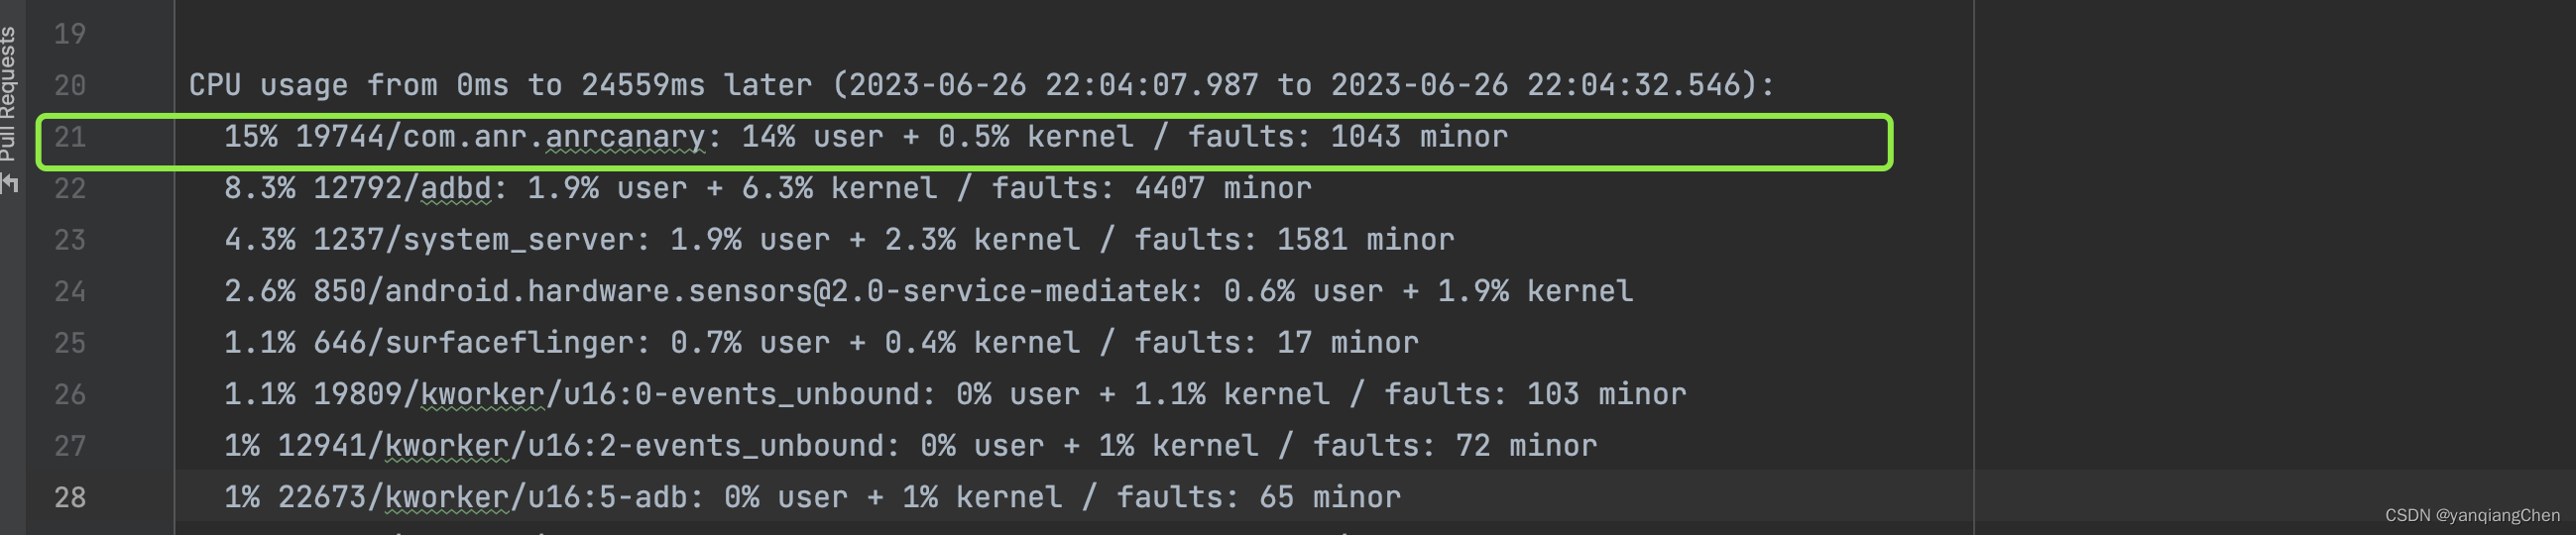
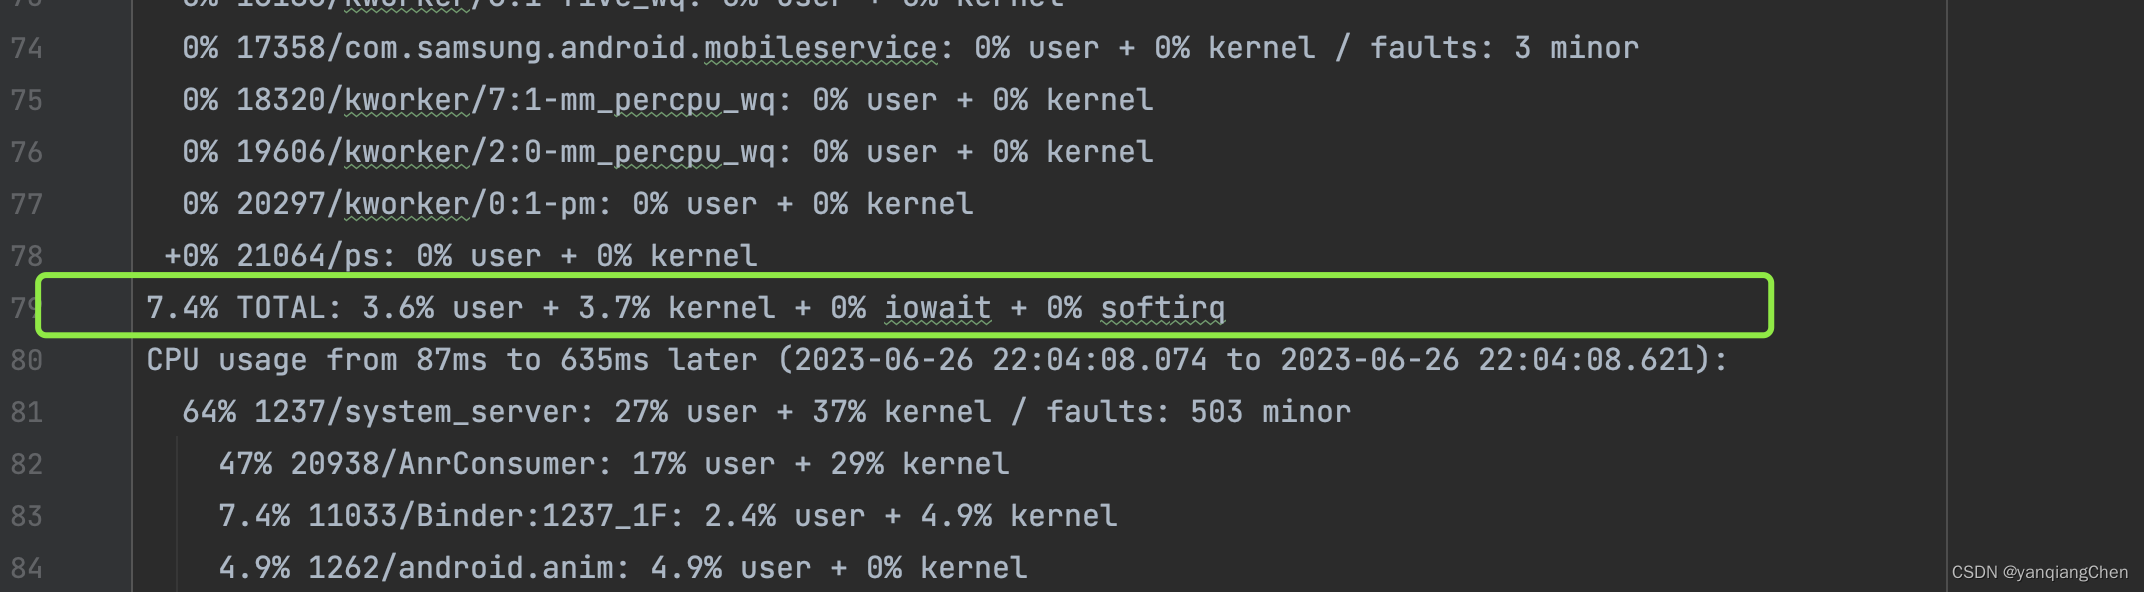
从这里可以看出cpu使用率 IO使用率都不是很高
3.分析历史堆栈
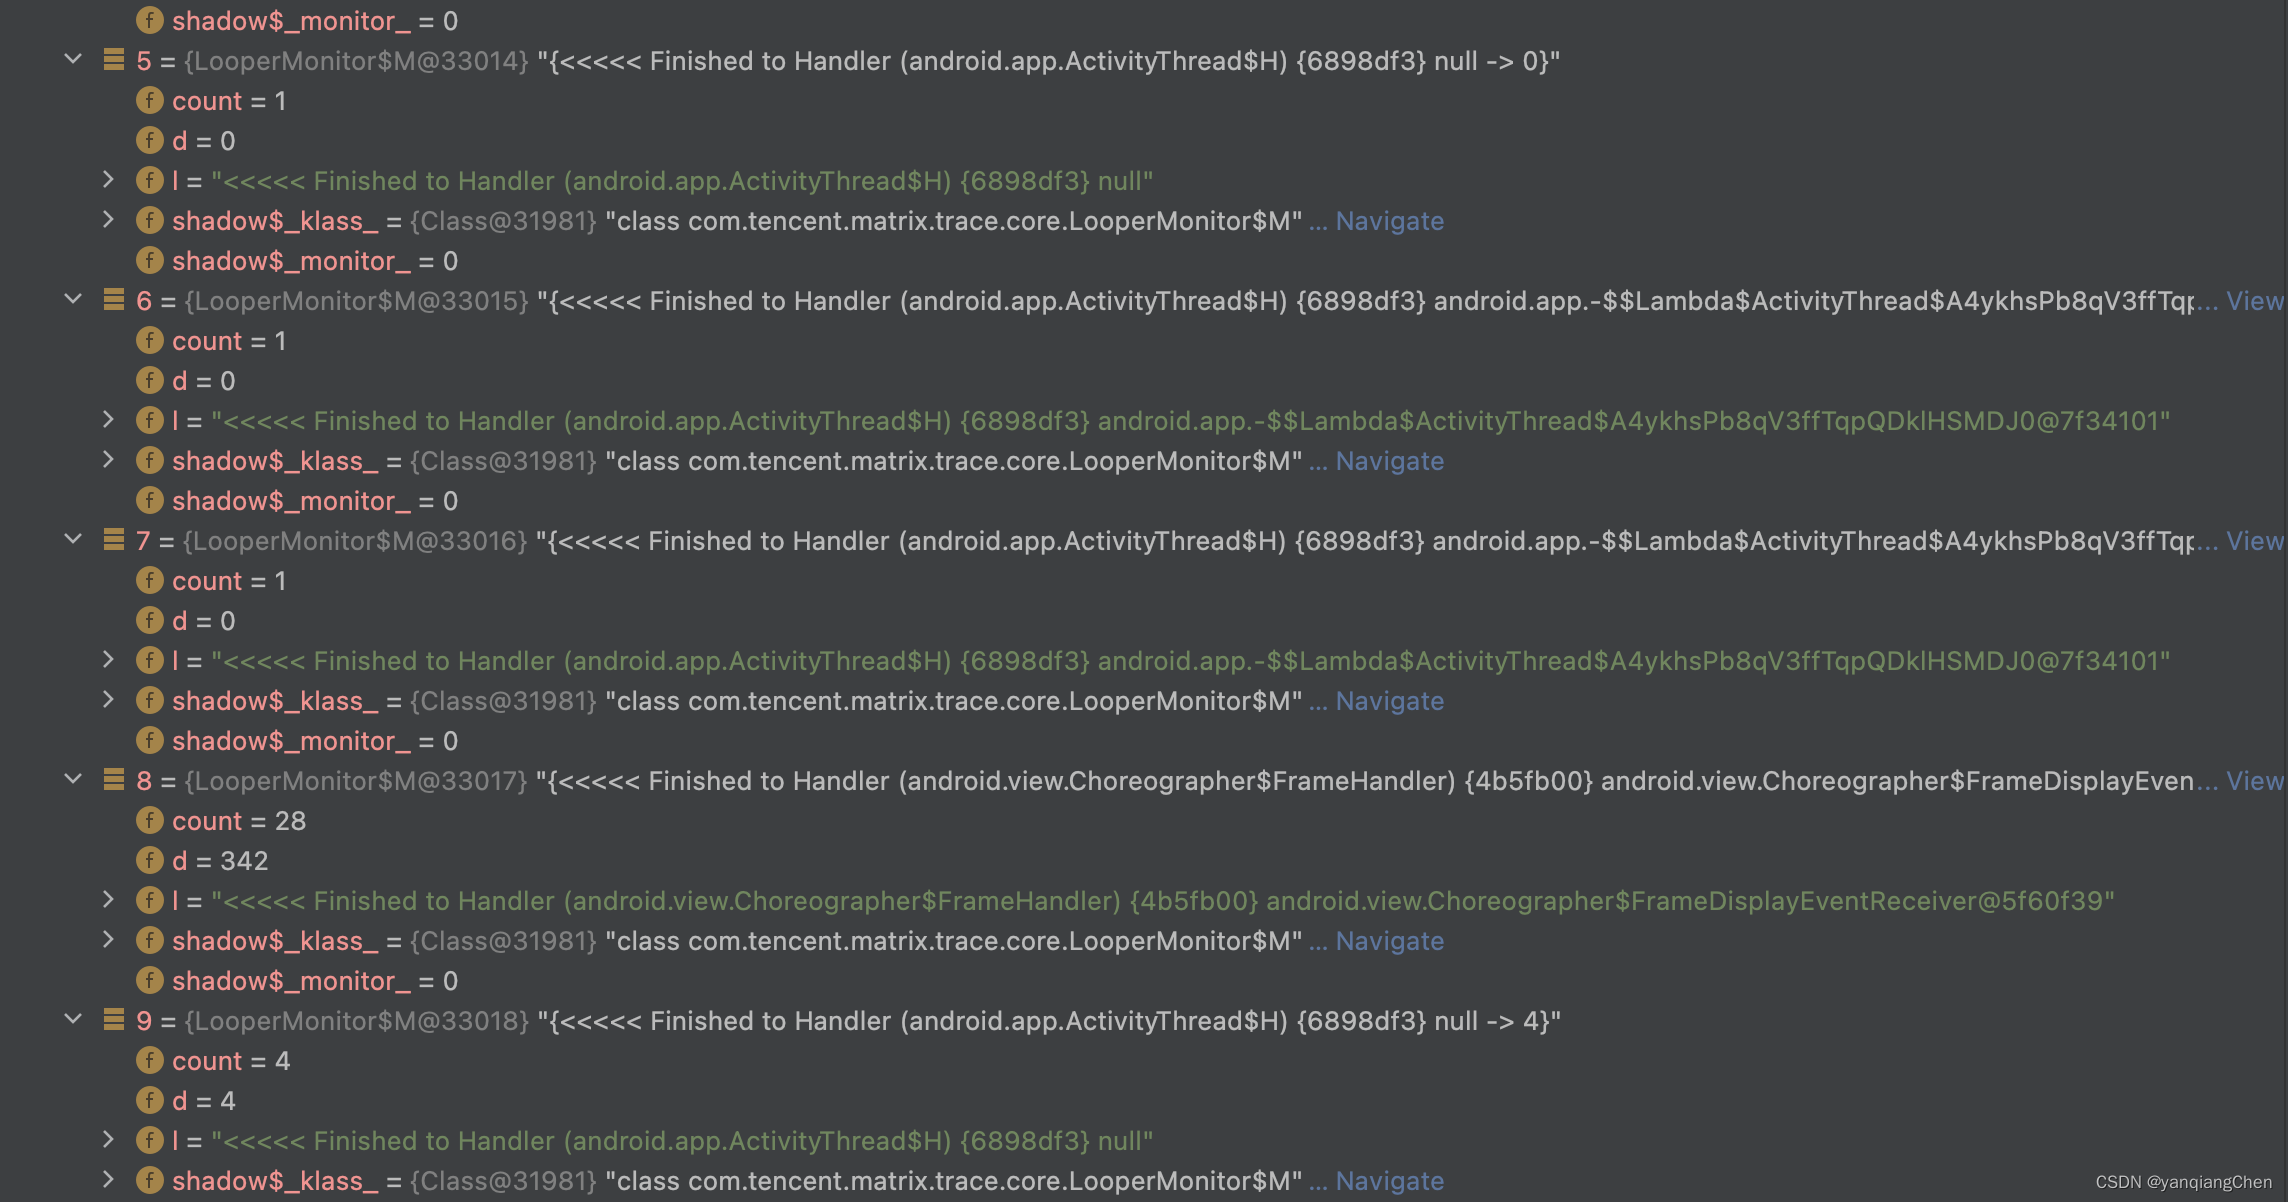
这里count表示消息数量 d表示耗时,历史主线程消息耗时都不高,说明是当前消息耗时导致anr
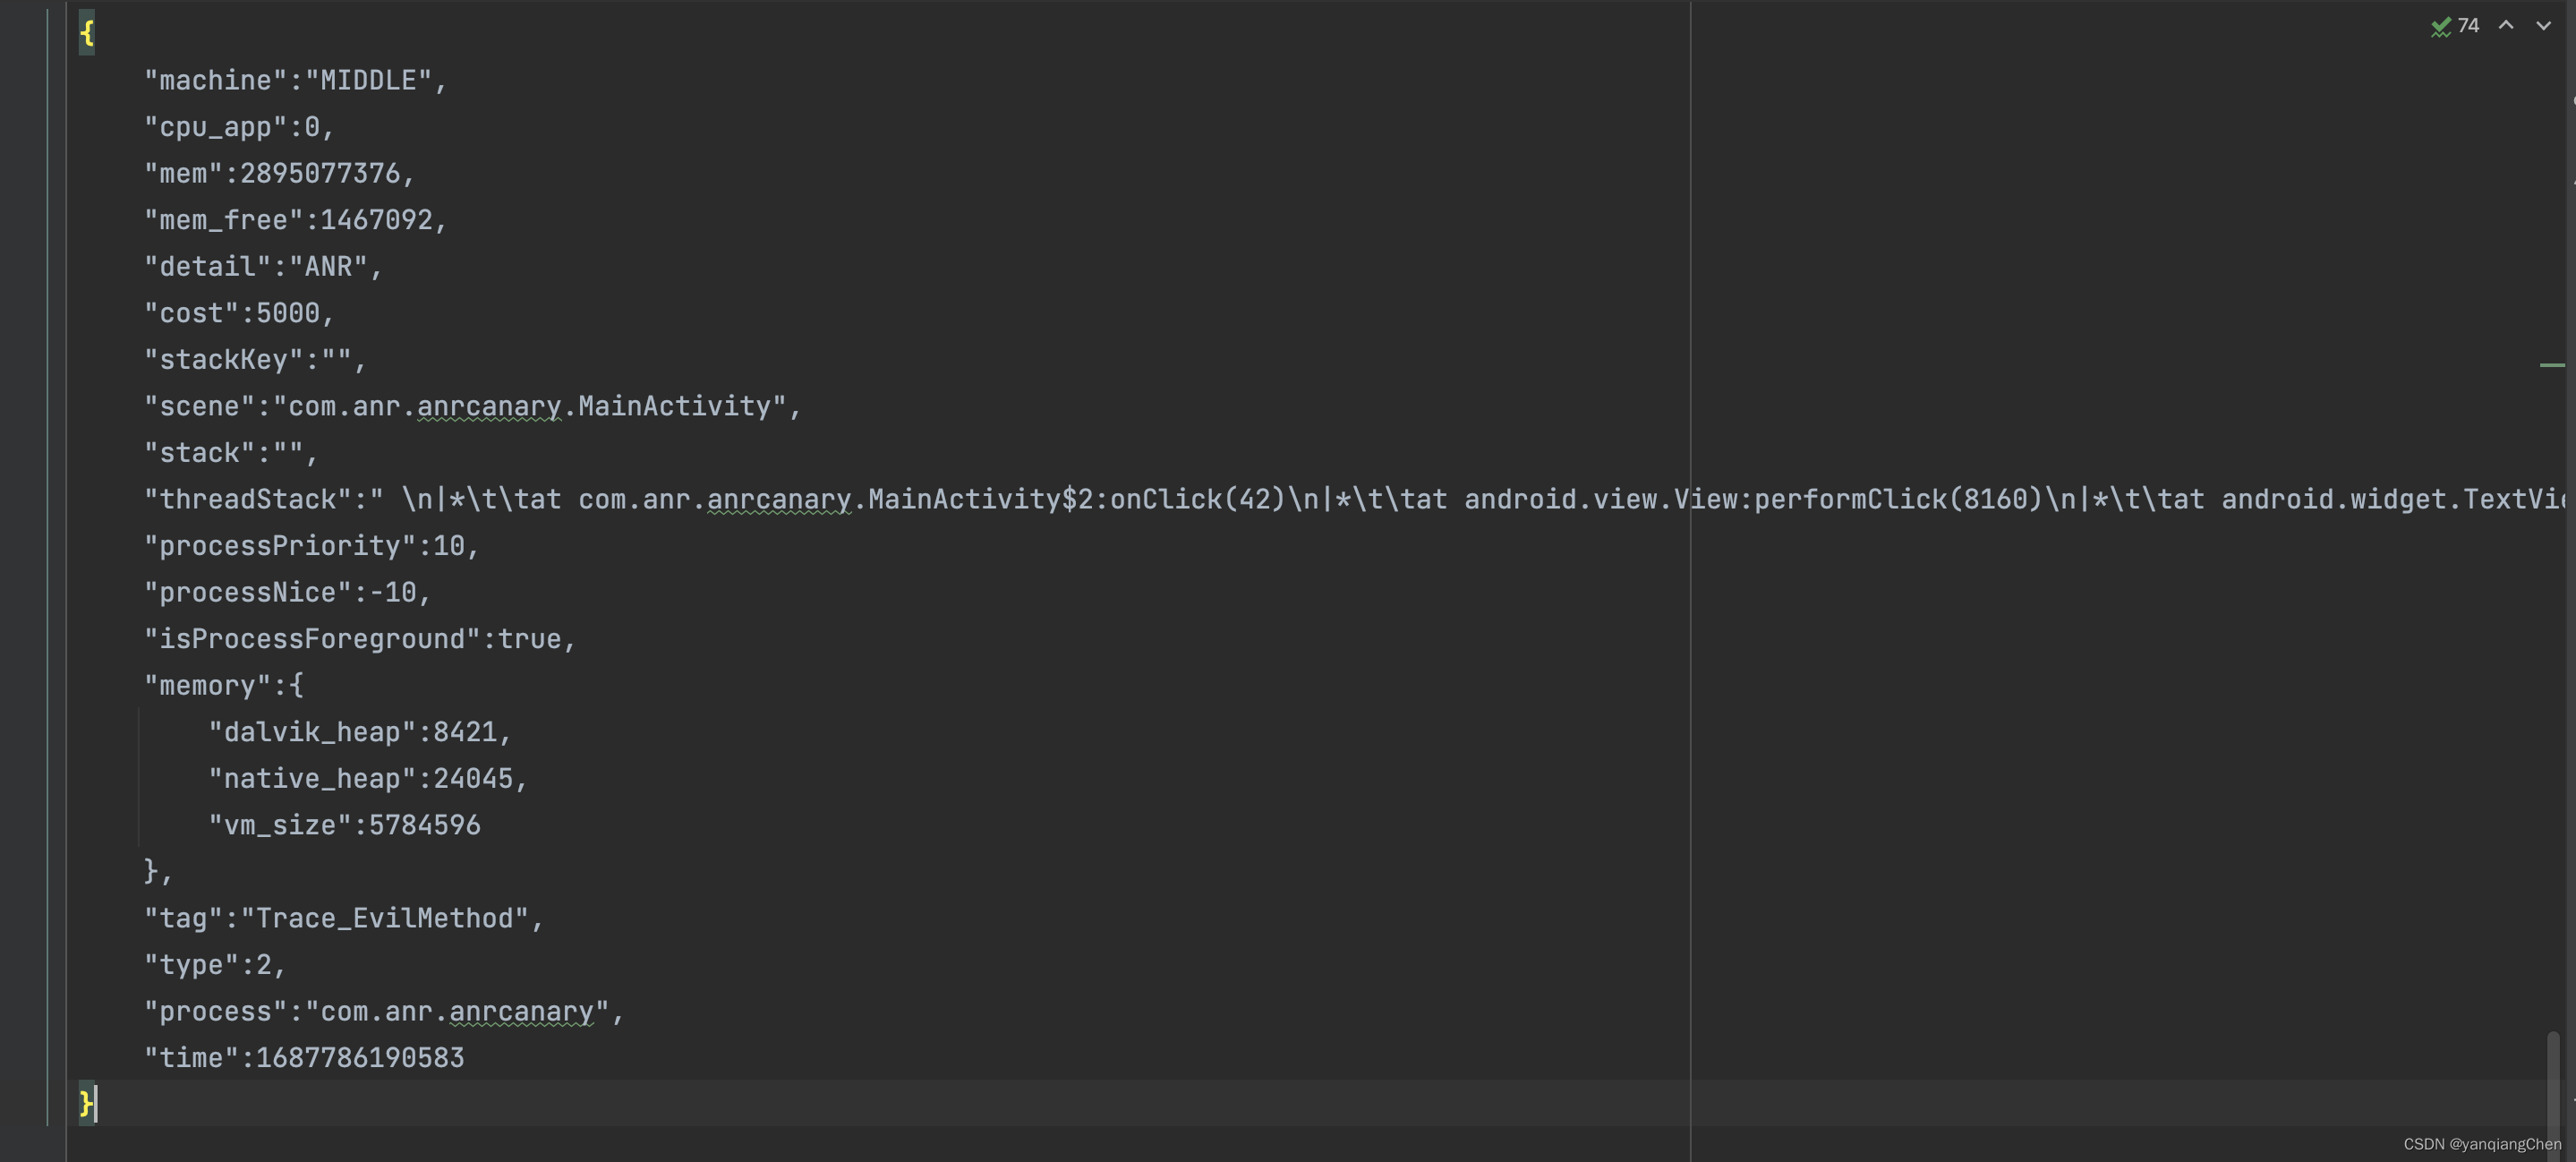
当前消息耗时堆栈,可以定位耗时的方法
参考文献:https://github.com/Tencent/matrix


 3058
3058


 被折叠的 条评论
为什么被折叠?
被折叠的 条评论
为什么被折叠?
 到【灌水乐园】发言


