


C++性能分析 valgrind
今天学一下C++内存分析工具,对于C++开发人员来说,必不可少。
valgrind 介绍
valgrind是非侵入式的,直接作用于可执行文件上,在检查前不需要重新编译、链接和修改你得程序。valgrind包含几个标准工具:
1、memcheck
2、callgrind
3、cachegrind
4、heigrind
官网:www.valgrind.org
使用方法:https://valgrind.org/docs/manual/manual.html
valgrind install
下载地址:https://www.valgrind.org/downloads/current.html
tar -jxvf  valgrind-3.17.0.tar.bz2
./configure && make && make install
memcheck
话不多说先写个demo小试牛刀,最近在学智能指针shared_ptr,正好借着这个机会试一下和new的区别;
new operator
// new_operator_test.cpp
#include <string>
#include <iostream>

int main(){
        std::string* tmp = new std::string("new operator demo");
        std::cout << *tmp << std::endl;
        return 0;
}
g++编译时,一定要加上-g参数,表示生成debug信息,否则后面的valgrind不能显示出出错行号。
执行 valgrind --tool=memcheck --leak-check=yes ./new_operator_test,结果如下:
[root@ouweiqi cpp_prime]# valgrind --tool=memcheck --leak-check=yes ./new_operator_test
==4205== Memcheck, a memory error detector
==4205== Copyright (C) 2002-2022, and GNU GPL'd, by Julian Seward et al.
==4205== Using Valgrind-3.19.0 and LibVEX; rerun with -h for copyright info
==4205== Command: ./new_operator_test
==4205==
new operator demo
==4205==
==4205== HEAP SUMMARY:
==4205==     in use at exit: 72,754 bytes in 3 blocks
==4205==   total heap usage: 3 allocs, 0 frees, 72,754 bytes allocated
==4205==
==4205== 50 (32 direct, 18 indirect) bytes in 1 blocks are definitely lost in loss record 2 of 3
==4205==    at 0x4C2B69B: operator new(unsigned long) (vg_replace_malloc.c:422)
==4205==    by 0x400ADA: main (new_operator_test.cpp:5)
==4205==
==4205== LEAK SUMMARY:
==4205==    definitely lost: 32 bytes in 1 blocks
==4205==    indirectly lost: 18 bytes in 1 blocks
==4205==      possibly lost: 0 bytes in 0 blocks
==4205==    still reachable: 72,704 bytes in 1 blocks
==4205==         suppressed: 0 bytes in 0 blocks
==4205== Reachable blocks (those to which a pointer was found) are not shown.
==4205== To see them, rerun with: --leak-check=full --show-leak-kinds=all
==4205==
==4205== For lists of detected and suppressed errors, rerun with: -s
==4205== ERROR SUMMARY: 1 errors from 1 contexts (suppressed: 0 from 0)
解释:
- definitely lost : 确认丢失。存在内存泄露,应该修复。当程序结束时如果一块动态分配的内存没有被释放且通过程序内的指针变量均无法访问这块内存则会报出这个错误;
- indirectly lost : 间接丢失。当试用了含有指针成员的类可能会报这个错误。这类错误总是与definitely lost 一起出现,只需修复definitely lost 即可。
- possibly lost :可能丢失。大多数情况下应视大多数情况下应视为与"definitely lost"一样需要尽快修复,除非你的程序让一个指针指向一块动态分配的内存(但不是这块内存起始地址),然后通过运算得到这块内存起始地址,再释放它。例子可参考我的例程。当程序结束时如果一块动态分配的内存没有被释放且通过程序内的指针变量均无法访问这块内存的起始地址,但可以访问其中的某一部分数据,则会报这个错误。
- still reachable:可以访问,未丢失但也未释放。如果程序是正常结束的,那么它可能不会造成程序崩溃,但长时间运行有可能耗尽系统资源,因此笔者建议修复它。如果程序是崩溃(如访问非法的地址而崩溃)而非正常结束的,则应当暂时忽略它,先修复导致程序崩溃的错误,然后重新检测。
- suppressed:已被解决。出现了内存泄露但系统自动处理了。可以无视这类错误。这类错误我没能用例程触发,看官方的解释也不太清楚是操作系统处理的还是valgrind,也没有遇到过。所以无视他吧~
摘自:http://valgrind.org/docs/manual/faq.html#faq.deflost
shared_ptr
// shared_ptr_test.cpp
#include <memory>
#include <string>
#include <iostream>

int main() {
    // effective c++ the 17th rule: Store newed objects in smart pointers in standalone statements.
    std::shared_ptr<std::string> name(new std::string("shared_ptr first demo"));
    std::cout << *name.get() << std::endl;
    return 0;
}
执行 valgrind --tool=memcheck --leak-check=yes ./new_operator_test,结果如下:
[root@ouweiqi cpp_prime]# valgrind --tool=memcheck --leak-check=yes ./shared_ptr_test
==3276== Memcheck, a memory error detector
==3276== Copyright (C) 2002-2022, and GNU GPL'd, by Julian Seward et al.
==3276== Using Valgrind-3.19.0 and LibVEX; rerun with -h for copyright info
==3276== Command: ./shared_ptr_test
==3276==
shared_ptr first demo
==3276==
==3276== HEAP SUMMARY:
==3276==     in use at exit: 72,704 bytes in 1 blocks
==3276==   total heap usage: 4 allocs, 3 frees, 72,782 bytes allocated
==3276==
==3276== LEAK SUMMARY:
==3276==    definitely lost: 0 bytes in 0 blocks
==3276==    indirectly lost: 0 bytes in 0 blocks
==3276==      possibly lost: 0 bytes in 0 blocks
==3276==    still reachable: 72,704 bytes in 1 blocks
==3276==         suppressed: 0 bytes in 0 blocks
==3276== Reachable blocks (those to which a pointer was found) are not shown.
==3276== To see them, rerun with: --leak-check=full --show-leak-kinds=all
==3276==
==3276== For lists of detected and suppressed errors, rerun with: -s
==3276== ERROR SUMMARY: 0 errors from 0 contexts (suppressed: 0 from 0)
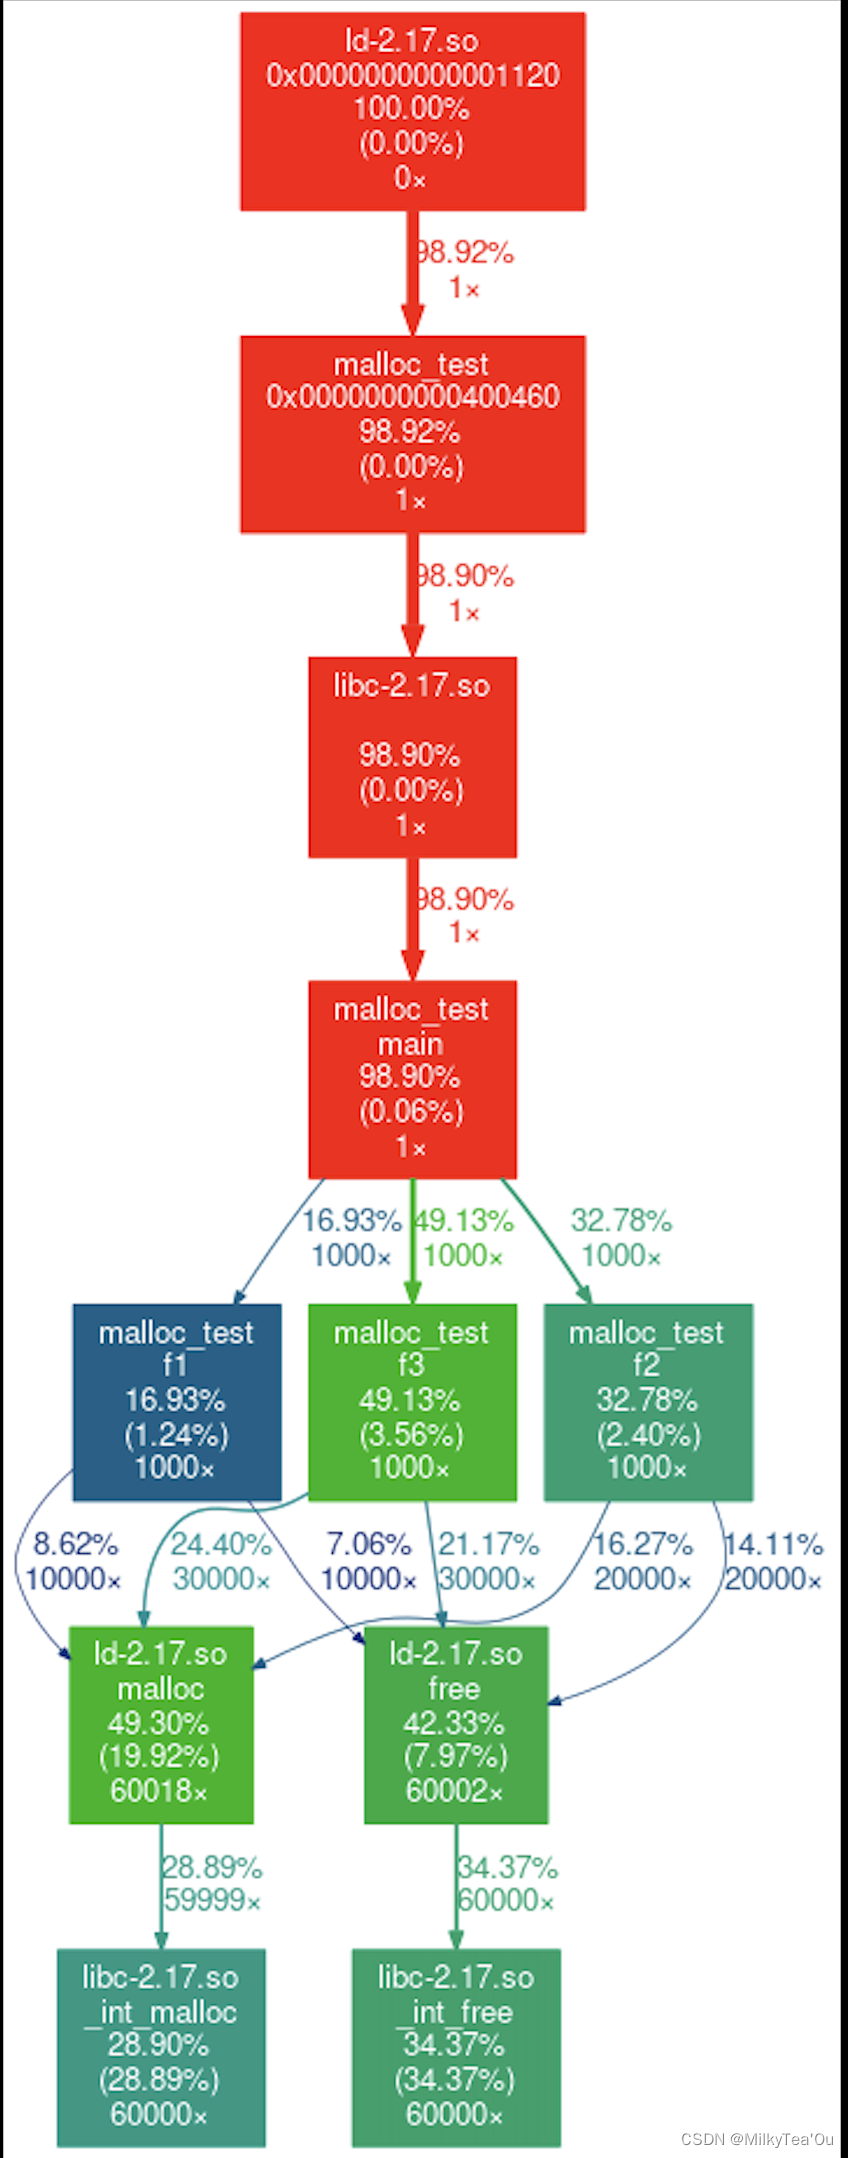
callgrind
callgrind通过x86和amd64平台明确的返回和调用指令,能否发现函数调用的关系,可以用来统计程序的函数调用关系以及执行耗时;
// malloc_test.cc
#include <stdio.h>
#include <stdlib.h>

void f1() {
  int i;
  int *p;
  for (i = 0; i < 10; i++) {
    p = (int*)malloc(sizeof(int));
    *p = 10;
    free(p);
  }
}

void f2() {
  int i;
  int *p;
  for (i = 0; i < 20; i++) {
    p = (int*)malloc(sizeof(int));
    *p = 10;
    free(p);
  }
}

void f3() {
  int i;
  int *p;
  for (i = 0; i < 30; i++) {
    p = (int*)malloc(sizeof(int));
    *p = 10;
    free(p);
  }
}

int main() {
  int i;
  for (i = 0; i < 1000; i++) {
    f1();
    f2();
    f3();
  }
  return 0;
}
编译:gcc -g malloc_test.cc -o malloc_test
然后执行valgrind --tool=callgrind ./malloc_test --dump-instr=yes --trace-jump=yes,生成callgrind.out.2606性能分析文件(2606表示进程号)
gprof2dot
该工具把profile结果生成图片,工具来自https://github.com/jrfonseca/gprof2dot
install
执行gprof2dot.py脚本需要安装python2或Python3,以及graphviz
yum install python3 graphviz
pip install --upgrade pip
use
gprof2dot -f callgrind -n10 -s callgrind.out.2606 > valgrind.dot
dot -Tpng valgrind.dot -o valgrind.png
参考:https://www.cnblogs.com/willhua/p/9818530.html


 642
642


 被折叠的 条评论
为什么被折叠?
被折叠的 条评论
为什么被折叠?
 到【灌水乐园】发言


