


- Partition or subpartition the fact table on STATE#. (preferred option)
- Create a summary table with partitioning or subpartitoning on STATE#. (uses most space and slows data load, but very flexible and powerful)
- Create a function-based index on fact to perform the lookup, and query that value instead. (a bit flaky, but it works without major system impact)
- Rebuild the fact table based on the STATE_NAME instead. (still limited in multi-level hierarchies)
Oracle SQL tuning with column histogramsOracle Tips by Burleson Consulting |
October 31, 2003 - Updated December 30, 2006
The distribution of values within an index will often affect the cost-based optimizer (CBO) decision whether to use an index or perform a full-table scan to satisfy a query. This can happen whenever the column referenced within a SQL query WHERE clause has a non-uniform distribution of values, making a full-table scan faster than index access.
Column histograms should be created only when you have highly-skewed values in a column. This rarely occurs, and a common mistake that a DBA can make is the unnecessary collection of histograms in the statistics. Histograms tell the CBO when a column's values aren't distributed evenly, and the CBO will then use the literal value in the query's WHERE clause and compare it to the histogram statistics buckets.
Using histograms to improve table join order
Histograms can help the cost-based optimizer estimate the number of rows returned from a table join (called "cardinality") and histograms can help. For example, assume that we have a five-way table join whose result set will be only 10 rows. Oracle will want to join the tables together in such a way as to make the result set cardinality of the first join as small as possible.
By carrying less baggage in the intermediate result sets, the query will run faster. To minimize intermediate results, the optimizer attempts to estimate the cardinality of each result set during the parse phase of SQL execution. Having histograms on skewed column will greatly aid the optimizer in making a proper decision. (Remember, you can create a histogram even if the column does not have an index and does not participate as a join key.)
Oracle 10g has also introduced dynamic sampling to improve the CBO's estimates of inter-table row join results. Even with the best schema statistics, it can be impossible to predict a priori the optimal table-join order (the one that has the smallest intermediate baggage). Reducing the size of the intermediate row-sets can greatly improve the speed of the query.
select
   stuff
from
   customer
natural join
   orders
natural join
   item
natural join
   product
where
   credit_rating * extended_credit > .07
and
   (qty_in_stock * velocity) /.075 < 30
or
   (sku_price / 47) * (qty_in_stock / velocity) > 47;
In this example, the four-way table join only returns 18 rows, but the query carries 9,000 rows in intermediate result sets, slowing-down the SQL execution speed:
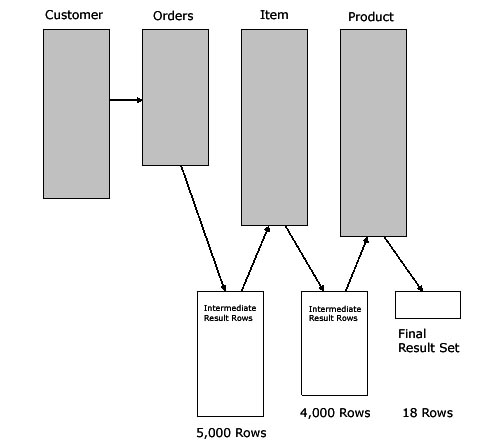
Sub-optimal intermediate row sets.
If we were somehow able to predict the sizes of the intermediate results, we can re-sequence the table-join order to carry less intermediate baggage during the four-way table join, in this example carrying only 3,000 intermediate rows between the table joins:
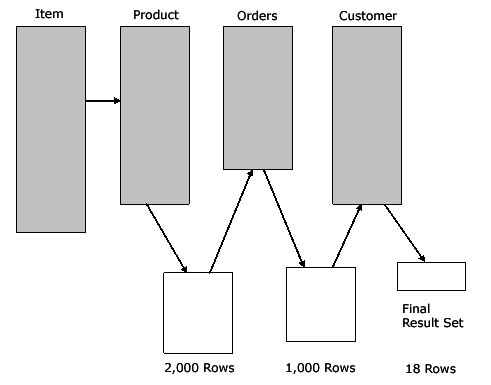
Optimal intermediate row sets.
Finding "missing" table join predicates (too add histograms)
Oracle expert and author John Kanagaraj has an very sophisticated query to detect columns that are used as table join predicates:
You should be able to use SYS.COL_USAGE$ to work out which columns are being used in Join predicates using the following SQL:
select
r.name owner,
o.name table ,
c.name column,
equality_preds,
equijoin_preds,
nonequijoin_preds,
range_preds,
like_preds,
null_preds,
timestamp
from
sys.col_usage$ u,
sys.obj$ o,
sys.col$ c,
sys.user$ r
where
o.obj# = u.obj#
and c.obj# = u.obj#
and c.col# = u.intcol#
and o.owner# = r.user#
and (u.equijoin_preds > 0
or u.nonequijoin_preds > 0);
A MINUS against DBA_IND_COLUMNS should show up which columns *might* need Histograms....
In a blog titled "Histograms for table join predicates" the author explains the problem and how to use histograms as a solution. The thrust of the argument is that histograms will help detect "skew" in table join columns when using synthetic keys (STATE#). Aldridge shares his conclusions and solutions to sub-optimal table join order:
Oracle histograms and cardinality
Histograms are used to predict cardinality and the number of rows returned to a query. Let's assume that we have a vehicle_type index and that 65 percent of the values are for the CAR type. Whenever a query with where vehicle_type = 'CAR' is specified, a full-table scan would be the fastest execution plan, while a query with where vehicle_type = 'TRUCK' would be faster when using access via an index.
Histograms affect performance and should only be used when they are required for a faster CBO execution plan. They incur additional overhead during the parsing phase of an SQL query. Histograms can be used effectively only when:
-
- A table column is referenced in one or more queriesNever create histograms if queries don't reference the column. Novice DBAs may mistakenly create histograms on a skewed column, even if it's not referenced in a query.
- A column's values cause the CBO to make an incorrect guessIf the CBO makes an incorrect assumption regarding the size of an intermediate result set, it may choose a sub-optimal execution plan. A histogram added to the column often provides the additional information required for the CBO to choose the best plan.
- Significant skewing exists in the distribution of a column's data valuesThe skew must of course, be significant enough to make the CBO choose a different execution plan.
- A table column is referenced in one or more queriesNever create histograms if queries don't reference the column. Novice DBAs may mistakenly create histograms on a skewed column, even if it's not referenced in a query.
A new feature of the dbms_stats package is the ability to look for columns that should have histograms, and then automatically create the histograms. Oracle introduced some new method_opt parameter options for the dbms_stats package. These new options are auto, repeat and skewonly and are coded as follows:
method_opt=>'for all columns size auto'
method_opt=>'for all columns size repeat'
method_opt=>'for all columns size skewonly'
Automatic histogram generation
The auto option is used only when monitoring has been invoked via the alter tablemonitoring command. Histograms are created based upon both the data distribution (see Figure A) and the workload on the column as determined by monitoring, like this.
execute dbms_stats.gather_schema_stats(
ownname => 'SCOTT',
estimate_percent => DBMS_STATS.AUTO_SAMPLE_SIZE,
method_opt => 'for all columns size auto',
degree => DBMS_STATS.DEFAULT_DEGREE);

Evenly distributed data vs. skewed data distribution
Using the dbms_stats repeat option, histograms are collected only on the columns that already have histograms. Histograms are static, like any other CBO statistic, and need to be refreshed when column value distributions change. The repeat option would be used when refreshing statistics, as in this example:
execute dbms_stats.gather_schema_stats(
ownname => 'SCOTT',
estimate_percent => DBMS_STATS.AUTO_SAMPLE_SIZE,
method_opt => 'for all columns size repeat',
degree => DBMS_STATS.DEFAULT_DEGREE);
The skewonly option introduces a very time-consuming build process because it examines the data distribution of values for every column within every index. When the dbms_stats package finds an index whose column values are distributed unevenly, it creates histograms to help the CBO make a table access decision (i.e., index versus a full-table scan). From the earlier vehicle_type example, if an index has one column value (e.g., CAR) that exists in 65 percent of the rows, a full-table scan will be faster than an index scan to access those rows, as in this example:
execute dbms_stats.gather_schema_stats(
ownname => 'SCOTT',
estimate_percent => DBMS_STATS.AUTO_SAMPLE_SIZE,
method_opt => 'for all columns size skewonly',
degree => DBMS_STATS.DEFAULT_DEGREE);
Tools to assist in CBO histogram tuning
There are many tools to assist with SQL tuning, but the best tools will expose all of the internal metrics of the data dictionary. The Ion tool does a great job at aiding SQL tuning:

Ion screen for SQL tuning
The Ion tool is an easy way to analyze Oracle SQL performance and Ion also allows you to spot hidden SQL performance trends.
BC References on tuning with histograms
"Oracle Tuning: The Definitive Reference", 2009, Donald K. Burleson, Rampant TechPress


 914
914

 被折叠的 条评论
为什么被折叠?
被折叠的 条评论
为什么被折叠?
 到【灌水乐园】发言


