


相关作图文章:
一、坐标轴的设置
参考博文
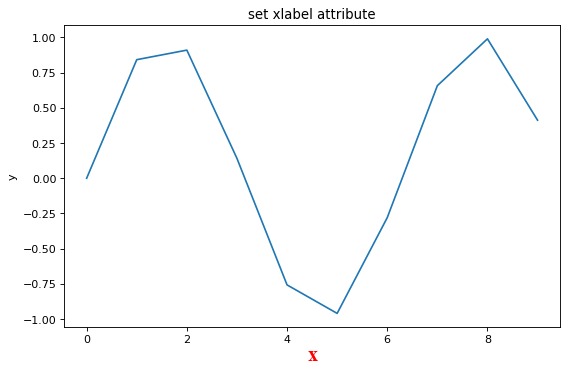
1.1 坐标轴的文本
ax.set_xlabel("x") 或者 ax.set_ylabel("y") ,用法相同
- 含义
set_xlabel(xlabel, fontdict=None, labelpad=None, **kwargs)
xlabel: 字符串,x轴的标签名
fontdict:字典,标签的属性
labelpad:标量,标签和x轴之间的点间距
- 栗子
fig, ax =plt.subplots(figsize=(8, 5), dpi=80)
x = np.arange(10)
y = np.sin(x)
ax.plot(y,label=r"$sin x$", color="C0")
font = {'family' : 'Times New Roman',
        'weight' : 'normal',
        'size'   : 18,
        'color':'red'}
ax.set_xlabel("x",fontdict=font,labelpad=1)
ax.set_ylabel("y")
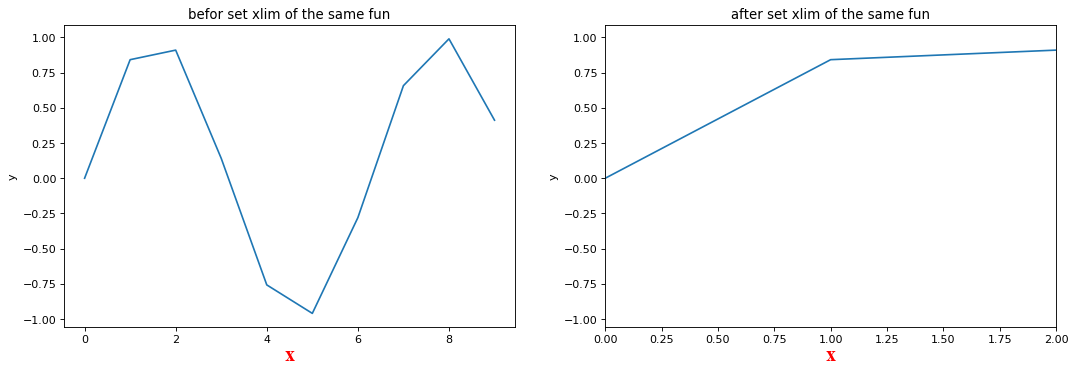
1.2 坐标轴的取值范围
ax.set_xlim()或ax.set_ylim()
- 含义
set_xlim(left=None, right=None, emit=True, auto=False, **kw)
left:标量,x轴左侧界限
right:标量,x轴右侧界限
emit:布尔值,是否将限额变更通知观察员
auto:布尔值,是否启用x轴的自动缩放。True开启
xlimits :元组,左xlim和右xlim可以作为元组(`left`、`right`)作为第一个位置参数(或者作为`left`关键字参数)传递。
- 栗子
x = np.arange(10)
y = np.sin(x)
fig, (ax1,ax2) =plt.subplots(1,2,figsize=(16, 5), dpi=80)
###
ax1.plot(y,label=r"$sin x$", color="C0")
font = {'family' : 'Times New Roman',
        'weight' : 'normal',
        'size'   : 18,
        'color':'red'}
ax1.set_xlabel("x",fontdict=font,labelpad=1)
ax1.set_ylabel("y")
ax1.set_title("befor set xlim of the same fun")

ax2.plot(y,label=r"$sin x$", color="C0")
ax2.set_xlabel("x",fontdict=font,labelpad=1)
ax2.set_ylabel("y")
ax2.set_xlim(0,2)
ax2.set_title("after set xlim of the same fun")
设置背景颜色
set_backgroundcolor(self, color)
画一个边界框
set_bbox(self, rectprops)
设置艺术家的剪辑
set_clip_box(self, clipbox)
设置艺术家是否使用剪辑。
set_clip_on(self, b)
设置艺术家的剪辑路径,该路径可能是
set_clip_path(self, path, transform=None)
设置文本的前景色
set_color(self, color)
设置字体系列。
set_family(self, fontname)
设置字体属性
`set_font_properties(self, fp)``
set_fontsize(self, fontsize)


 290
290


 被折叠的 条评论
为什么被折叠?
被折叠的 条评论
为什么被折叠?
 到【灌水乐园】发言


