


 本文介绍了Storm EVent ImagRy (SEVIR)数据集,它由时空匹配的卫星和雷达数据组成,可在注册AWS后从指定地址下载。文中说明了数据格式、与NOAA风暴事件数据库的关联,还介绍了数据描述、H5文件结构,给出处理SEVIR数据的代码示例及地理引用等运用方法。
The Storm EVent ImagRy (SEVIR) dataset 是由时空匹配过的卫星(GOES-16)和雷达数据( NEXRAD weather radars)(包含天气现象时的),注册AWS可以下载。
下载地址: https://registry.opendata.aws/sevir/
教程 Tutorial: https://nbviewer.jupyter.org/github/MIT-AI-Accelerator/eie-sevir/blob/master/examples/SEVIR_Tutorial.ipynb
SEVIR Challenges (BETA): https://sevir.mit.edu
数据格式为: 4 hours 数据块, 5分钟间隔,空间范围: 384 km x 384 ,美国上空是5种探测器
五种探测器如下:
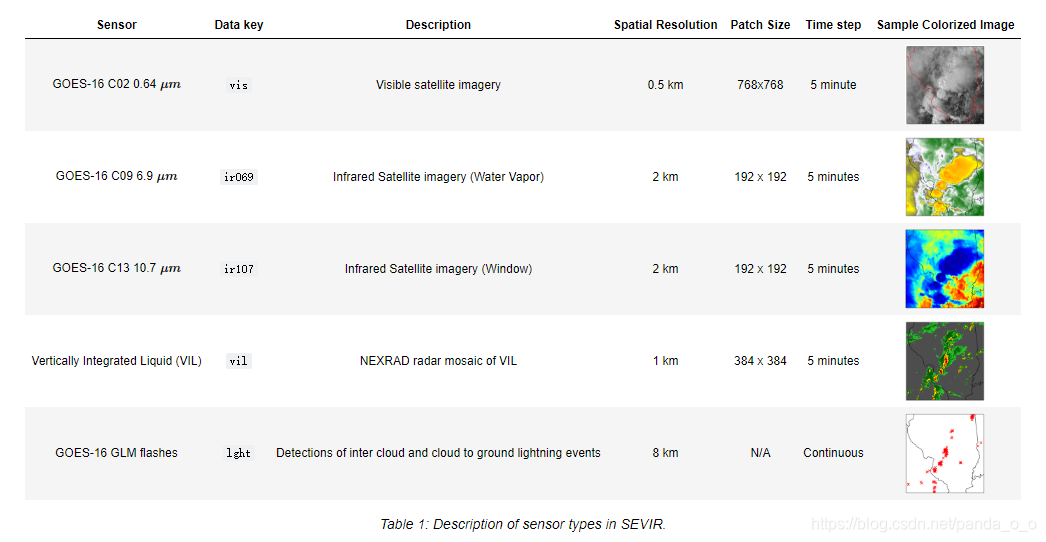
主要是GOES16的三个通道图,以及其上的GLM flashes(闪电)监测。以及地基radar数据,除了lght以外都是 raster (image) types,数据为L x L x 49,L为数据尺寸,49为时间维度(240/5+1=49)
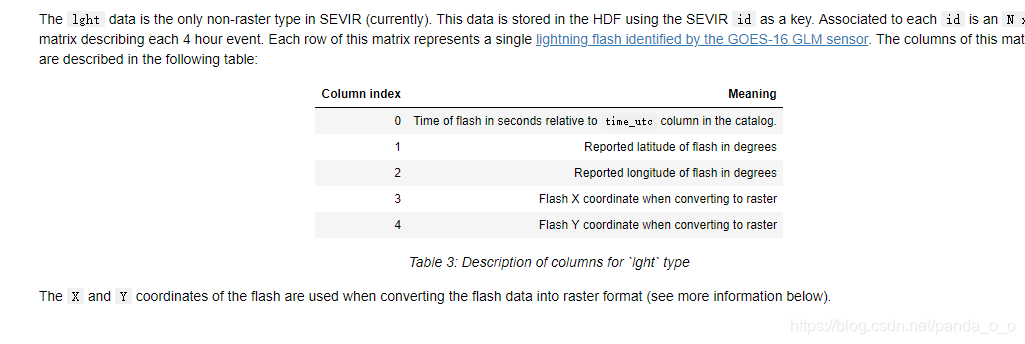
lght 格式为NX5矩阵,包含时间,位置 等
NOAA风暴事件数据库
SEVIR中的许多事件都可以使用国家气象局(NS)收集的数据进行增强。大约20%的SEVIR例是根据美国国家气象局(NWS)标记的“风暴事件”进行选择的,
这些事件在这里存档:https://www.ncdc.noaa.gov/stormevents。此数据库包括额外的信息,包括:恶劣天气的类型(如大风、番茄、冰雹等)。
例如,下面是与图1所示事件相关的NWS风暴事件数据库的一个条目。点击
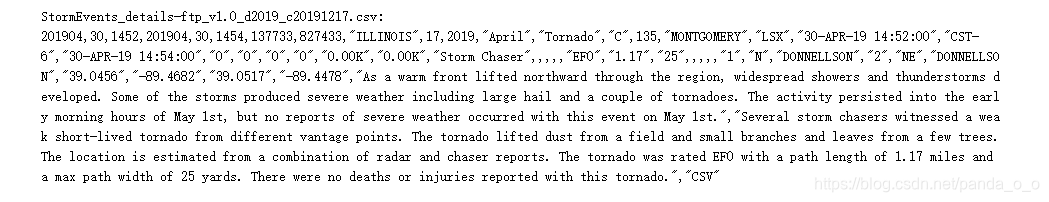
文本里有时间位置等信息描述
每一个事件在SEVIR中都有一个id,id以S开头与NWS风暴事件相关。R开头则是随机选取的与NWS无关
Downloading SEVIR
如果有亚马逊云,是直接使用:
aws s3 sync --no-sign-request s3://sevir .下载指定 modalitiy,例如 vil,执行
aws s3 cp --no-sign-request s3://sevir/CATALOG.csv CATALOG.csv
aws s3 sync --no-sign-request s3://sevir/data/vil .
数据描述:
SEVIR 包含以下两部分:
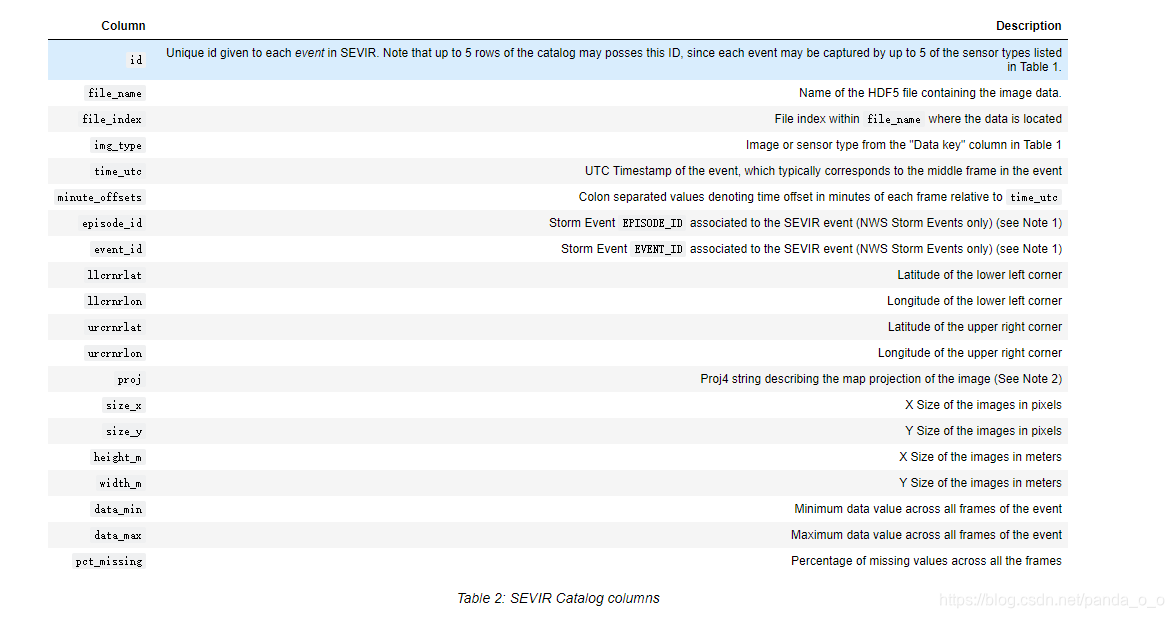
- Catalog: A CSV file with rows describing the metadata of an event
- Data Files: A set of HDF5 files containing events for a certain sensor type
注意:在SEVIR可能会有额外的风暴事件id与4小时事件重叠。目录将只提供一个这样的id。通过将风暴事件的时间和地点与SEVIR事件的元数据进行比较,可以找到其他的数据。
SEVIR所有的投影(目前)都是Lambert Azmuthial等面积。如果将来的数据使用不同的投影。
H5文件结构
data
+-- img_type
|   +-- year
文件名
SEVIR_<IMG_TYPE>_<EVENT_TYPE>_<YEAR>_<START>_<END>.h5其中
<TYPE>是图像or 他探测器 (vil, vis, ir069, etc..),
<EVENT_TYPE> is either STORMEVENTS, if the events are linked with NWS storm events, RANDOMEVENTS, if the events are randomly sampled, or ALLEVENTS if the two types are mixed into the same file.
<YEAR>_<START>_<END> Denotes the year, start date and end date of the events in the file.
Each file contains the id's of the events, as well as the event data. For example a summary of one such file is:
$ h5ls SEVIR_VIL_STORMEVENTS_2018_0101_0630.h5
id                       Dataset {793}
vil                      Dataset {793, 384, 384, 49}
All raster types in SEVIR (vis, ir069, ir107 & vil) store the data 4D tensors with shapes N x L x W x T, where N is the number of events in the file, LxLis the image size (see patch size column in Table 1), and T is the number of time steps in the image sequence.
Lightning Data
数据
本节包括处理SEVIR数据的代码示例。SEVIR数据可以从本地存储或通过Amazon S3云存储下载和访问。本教程将假定SEVIR数据已下载到本地或网络文件系统。下面的例子需要设置以下变量:
# Enter path to the SEVIR data location
DATA_PATH    = '../data'
CATALOG_PATH = '../CATALOG.csv'

# On some Linux systems setting file locking to false is also necessary:
import os
os.environ["HDF5_USE_FILE_LOCKING"]='FALSE'
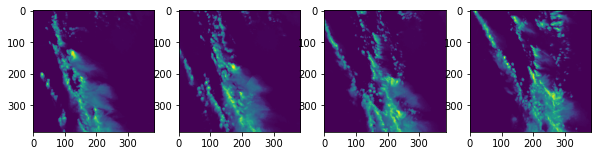
下面的代码展示了如何直接打开H5数据文件,而不用使用目录来可视化使用h5py模块捕获的单个类型事件的帧:
import os
import h5py # needs conda/pip install h5py
import matplotlib.pyplot as plt

file_index = 0
with h5py.File('%s/vil/2018/SEVIR_VIL_STORMEVENTS_2018_0101_0630.h5' % DATA_PATH,'r') as hf:
    event_id = hf['id'][file_index]
    vil      = hf['vil'][file_index]

print('Event ID:',event_id)
print('Image shape:',vil.shape)

fig,axs=plt.subplots(1,4,figsize=(10,5))
axs[0].imshow(vil[:,:,10])
axs[1].imshow(vil[:,:,20])
axs[2].imshow(vil[:,:,30])
axs[3].imshow(vil[:,:,40])
plt.show()
Event ID: b'S728503' Image shape: (384, 384, 49)
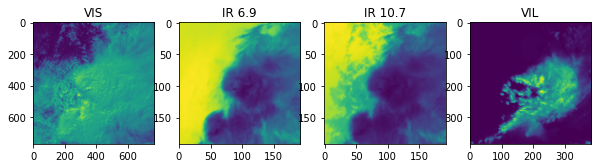
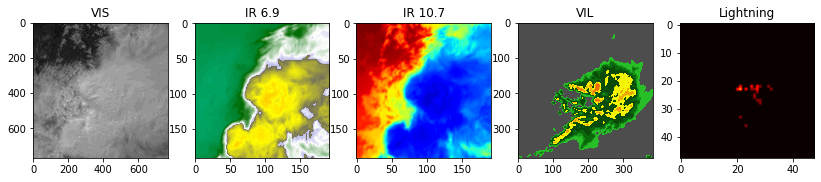
下面的代码展示了如何提取由四种图像类型(vis、vil、ir069和ir107)观察到的事件
import h5py # needs conda/pip install h5py
import matplotlib.pyplot as plt
import pandas as pd

# Read catalog
catalog = pd.read_csv(CATALOG_PATH,parse_dates=['time_utc'],low_memory=False)

# Desired image types
img_types = set(['vis','ir069','ir107','vil'])

# Group by event id, and filter to only events that have all desired img_types
events = catalog.groupby('id').filter(lambda x: img_types.issubset(set(x['img_type']))).groupby('id')
event_ids = list(events.groups.keys())
print('Found %d events matching' % len(event_ids),img_types)

# Grab a sample event and view catalog entries
sample_event = events.get_group( event_ids[-1])
print('Sample Event:',event_ids[-1])
sample_event
Found 12739 events matching {'ir069', 'ir107', 'vis', 'vil'}
Sample Event: S858968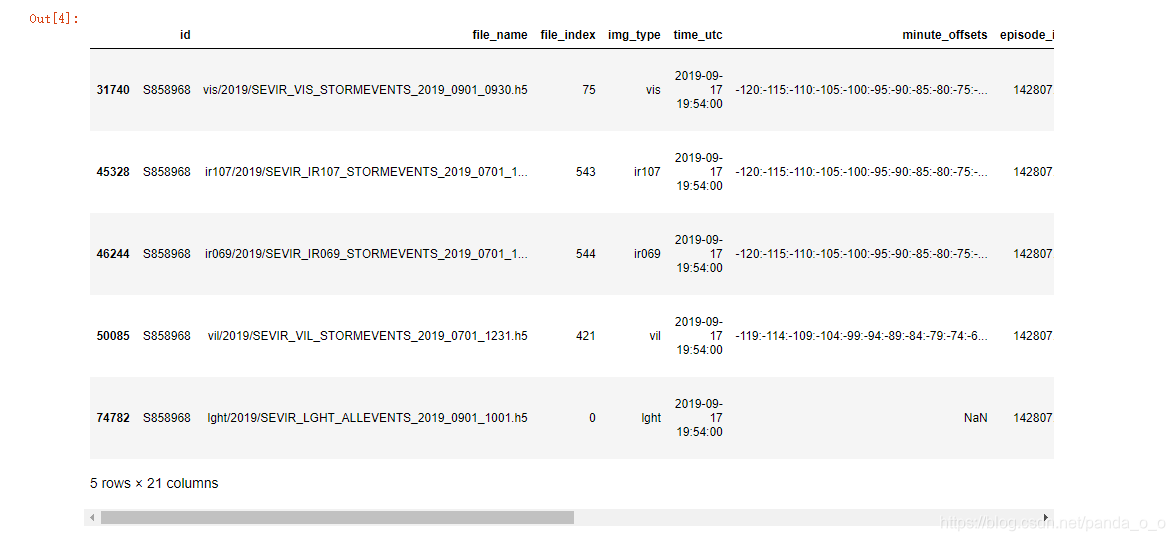
这个数据帧包含SEVIR中对应于列出的id的每种图像类型的行。下面的代码使用sample_event的行来提取每种类型的图像数据:
def read_data( sample_event, img_type, data_path=DATA_PATH ):
    """
    Reads single SEVIR event for a given image type.

    Parameters
    ----------
    sample_event   pd.DataFrame
        SEVIR catalog rows matching a single ID
    img_type   str
        SEVIR image type
    data_path  str
        Location of SEVIR data

    Returns
    -------
    np.array
       LxLx49 tensor containing event data
    """
    fn = sample_event[sample_event.img_type==img_type].squeeze().file_name
    fi = sample_event[sample_event.img_type==img_type].squeeze().file_index
    with h5py.File(data_path + '/' + fn,'r') as hf:
        data=hf[img_type][fi]
    return data

vis = read_data(sample_event, 'vis')
ir069 = read_data(sample_event, 'ir069')
ir107 = read_data(sample_event, 'ir107')
vil = read_data(sample_event, 'vil')

# plot a frame from each img_type
fig,axs = plt.subplots(1,4,figsize=(10,5))
frame_idx = 30
axs[0].imshow(vis[:,:,frame_idx]), axs[0].set_title('VIS')
axs[1].imshow(ir069[:,:,frame_idx]), axs[1].set_title('IR 6.9')
axs[2].imshow(ir107[:,:,frame_idx]), axs[2].set_title('IR 10.7')
axs[3].imshow(vil[:,:,frame_idx]), axs[3].set_title('VIL')
(<matplotlib.image.AxesImage at 0x7f6a11ab79e8>, Text(0.5, 1.0, 'VIL'))
、
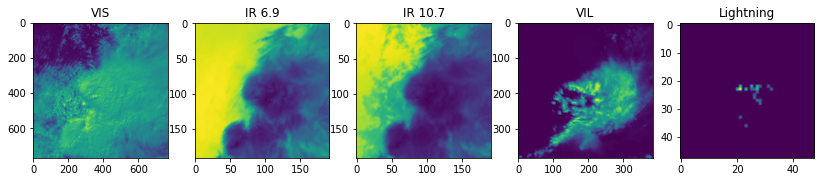
Lightning
为了将闪电包含在的数据中,我们首先需要将其转换为栅格类型,以便将其与其他图像类型一起显示。下面的代码通过将flash数据转换为每5分钟帧中每像素的flash计数来实现这一点:
import numpy as np
def lght_to_grid(data):
    """
    Converts SEVIR lightning data stored in Nx5 matrix to an LxLx49 tensor representing
    flash counts per pixel per frame

    Parameters
    ----------
    data  np.array
       SEVIR lightning event (Nx5 matrix)

    Returns
    -------
    np.array
       LxLx49 tensor containing pixel counts
    """
    FRAME_TIMES = np.arange(-120.0,125.0,5) * 60 # in seconds
    out_size = (48,48,len(FRAME_TIMES))
    if data.shape[0]==0:
        return np.zeros(out_size,dtype=np.float32)

    # filter out points outside the grid
    x,y=data[:,3],data[:,4]
    m=np.logical_and.reduce( [x>=0,x<out_size[0],y>=0,y<out_size[1]] )
    data=data[m,:]
    if data.shape[0]==0:
        return np.zeros(out_size,dtype=np.float32)

    # Filter/separate times
    # compute z coodinate based on bin locaiton times
    t=data[:,0]
    z=np.digitize(t,FRAME_TIMES)-1
    z[z==-1]=0 # special case:  frame 0 uses lght from frame 1

    x=data[:,3].astype(np.int64)
    y=data[:,4].astype(np.int64)

    k=np.ravel_multi_index(np.array([y,x,z]),out_size)
    n = np.bincount(k,minlength=np.prod(out_size))
    return np.reshape(n,out_size).astype(np.float32)

def read_lght_data( sample_event, data_path=DATA_PATH ):
    """
    Reads lght data from SEVIR and maps flash counts onto a grid

    Parameters
    ----------
    sample_event   pd.DataFrame
        SEVIR catalog rows matching a single ID
    data_path  str
        Location of SEVIR data

    Returns
    -------
    np.array
       LxLx49 tensor containing pixel counts for selected event

    """
    fn = sample_event[sample_event.img_type=='lght'].squeeze().file_name
    id = sample_event[sample_event.img_type=='lght'].squeeze().id
    with h5py.File(data_path + '/' + fn,'r') as hf:
        data      = hf[id][:]
    return lght_to_grid(data)

lght = read_lght_data(sample_event)

# include lightning counts in plot
fig,axs = plt.subplots(1,5,figsize=(14,5))
frame_idx = 30
axs[0].imshow(vis[:,:,frame_idx]), axs[0].set_title('VIS')
axs[1].imshow(ir069[:,:,frame_idx]), axs[1].set_title('IR 6.9')
axs[2].imshow(ir107[:,:,frame_idx]), axs[2].set_title('IR 10.7')
axs[3].imshow(vil[:,:,frame_idx]), axs[3].set_title('VIL')
axs[4].imshow(lght[:,:,frame_idx]), axs[4].set_title('Lightning')
<matplotlib.image.AxesImage at 0x7f69e00c8470>, Text(0.5, 1.0, 'Lightning'))
示例使用默认的colormap来显示数据。要显示类似于的彩色图像,颜色映射可在位于https://github.com/MIT-AI-Accelerator/eie-sevir的repo中获得。
import sys
sys.path.append('../') # add sevir module to path
from sevir.display import get_cmap
# Get colormaps for encoded types
vis_cmap,vis_norm,vis_vmin,vis_vmax = get_cmap('vis',encoded=True)
ir069_cmap,ir069_norm,ir069_vmin,ir069_vmax = get_cmap('ir069',encoded=True)
ir107_cmap,ir107_norm,ir107_vmin,ir107_vmax = get_cmap('ir107',encoded=True)
vil_cmap,vil_norm,vil_vmin,vil_vmax = get_cmap('vil',encoded=True)
lght_cmap,lght_norm,lght_vmin,lght_vmax = get_cmap('lght',encoded=True)

fig,axs = plt.subplots(1,5,figsize=(14,5))
frame_idx = 30
axs[0].imshow(vis[:,:,frame_idx],cmap=vis_cmap,norm=vis_norm,vmin=vis_vmin,vmax=vis_vmax), axs[0].set_title('VIS')
axs[1].imshow(ir069[:,:,frame_idx],cmap=ir069_cmap,norm=ir069_norm,vmin=ir069_vmin,vmax=ir069_vmax), axs[1].set_title('IR 6.9')
axs[2].imshow(ir107[:,:,frame_idx],cmap=ir107_cmap,norm=ir107_norm,vmin=ir107_vmin,vmax=ir107_vmax), axs[2].set_title('IR 10.7')
axs[3].imshow(vil[:,:,frame_idx],cmap=vil_cmap,norm=vil_norm,vmin=vil_vmin,vmax=vil_vmax), axs[3].set_title('VIL')
axs[4].imshow(lght[:,:,frame_idx],cmap=lght_cmap,norm=lght_norm,vmin=lght_vmin,vmax=lght_vmax), axs[4].set_title('Lightning')
matplotlib.image.AxesImage at 0x7f6a12427208>, Text(0.5, 1.0, 'Lightning'))
运用SEVIR事件
在许多应用程序中,有必要知道SEVIR补丁中像素的纬度/经度位置。目录提供了执行数据地理引用所需的信息。
目前,SEVIR中的所有补丁都使用相同的地图投影,一个以(纬度,lon)=(38,-98)为中心的兰伯特等面积投影。这个投影细节存储在proj列中:
sample_event.proj.values[0]
import re
import numpy as np
class LaeaProjection():
    """
    Translates between pixel coordinates (X,Y) and Lat lon coordinates for a given SEVIR event
    projected in laea.

    Parameters
    ----------
    event  pd.Series
        One row from SEVIR catalog
    """
    def __init__(self,event):
        self.proj = event.proj
        self.lat0 = float(re.compile('\+lat_0=([+-]?\d+)').search(self.proj).groups()[0])
        self.lon0 = float(re.compile('\+lon_0=([+-]?\d+)').search(self.proj).groups()[0])
        self.R = float(re.compile('\+a=(\d+)').search(self.proj).groups()[0])
        self.llcrnlat = event.llcrnrlat
        self.llcrnlon = event.llcrnrlon
        self.refX, self.refY = self.forward(self.llcrnlon,self.llcrnlat,pixel=False)
        self.binX = event.width_m / event.size_x
        self.binY = event.height_m / event.size_y

    def forward(self,lon,lat,pixel=True):
        """
        Maps lat/lon to pixel x,y.  For projection coordinates instead of pixel, set pixel=False.
        """
        sind = lambda t: np.sin(t*np.pi/180)
        cosd = lambda t: np.cos(t*np.pi/180)
        k = self.R * np.sqrt(2/(1+sind(self.lat0)*sind(lat)+cosd(self.lat0)*cosd(lat)*cosd(lon-self.lon0)))
        x = k*cosd(lat)*sind(lon-self.lon0)
        y = k*(cosd(self.lat0)*sind(lat) - sind(self.lat0)*cosd(lat)*cosd(lon-self.lon0))
        if pixel:
            x = (x-self.refX) / self.binX
            y = (y-self.refY) / self.binY
        return x,y
    def inverse(self,x,y,pixel=True):
        """
        Maps pixel coordinates to (lon,lat) position.  If passing projection corrdinates, set pixel=False.
        """
        if pixel:
            x = x*self.binX + self.refX
            y = y*self.binY + self.refY
        x/=self.R
        y/=self.R
        sind = lambda t: np.sin(t*np.pi/180)
        cosd = lambda t: np.cos(t*np.pi/180)
        rho = np.sqrt(x*x+y*y)
        c = 2*np.arcsin(0.5*rho)
        sinc = np.sin(c)
        cosc = np.cos(c)
        lat = 180/np.pi*np.arcsin(cosc*sind(self.lat0)+y*sinc*cosd(self.lat0)/rho)
        lon = self.lon0+180/np.pi*np.arctan(x*sinc/(rho*cosd(self.lat0)*cosc - y*sind(self.lat0)*sinc))
        return lon,lat
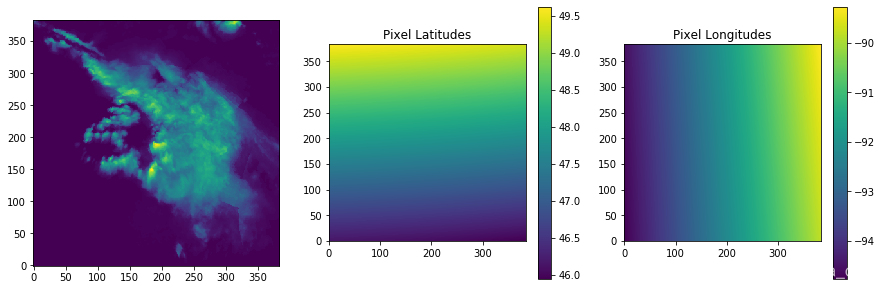
运行一个事件
proj = LaeaProjection( sample_event[sample_event.img_type=='vil'].squeeze() )
X,Y = np.meshgrid(np.arange(vil.shape[0]),np.arange(vil.shape[0]))
lons,lats = proj.inverse(X,Y)

# Plot with origin='lower' so up corresponds to north.
fig,ax=plt.subplots(1,3,figsize=(15,5))
ax[0].imshow(vil[:,:,20],origin='lower')
la = ax[1].imshow(lats,origin='lower')
fig.colorbar(la,ax=ax[1])
ax[1].set_title('Pixel Latitudes')
lo = ax[2].imshow(lons,origin='lower')
fig.colorbar(lo,ax=ax[2])
ax[2].set_title('Pixel Longitudes')
Text(0.5, 1.0, 'Pixel Longitudes')
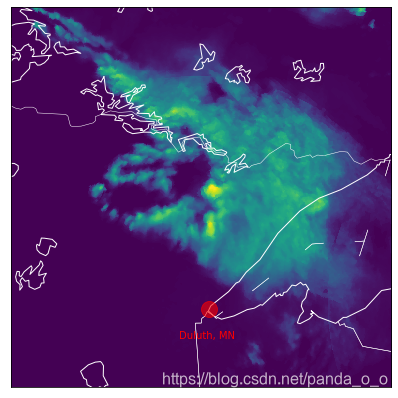
This particular domain overlaps with north eastern Minnesota. We can add markers for particular locations by converting from lat/lon coordinates into the image pixel coordinates:
In [18]:
lat,lon = 46.7867, -92.1005 # Duluth, MN
x,y=proj.forward(lon,lat)
print('x=%f,y=%f' % (x,y))
# Plot with origin='lower' so up corresponds to north.
fig,ax=plt.subplots(1,1,figsize=(5,5))
ax.imshow(vil[:,:,20],origin='lower')
ax.plot(x,y,linestyle='none', marker="o", markersize=16, alpha=0.6, c="red")
ax.text(x-30,y-30,'Duluth, MN',color='r')
x=200.021527,y=79.057562
Out[18]:
Text(170.02152736199426, 49.057561772525304, 'Duluth, MN')
Use Basemap instead
In [22]:
# Note:  Requires basemap module to run
import warnings
warnings.filterwarnings('ignore')
from mpl_toolkits.basemap import Basemap # conda/pip install basemap basemap-data-hires
# Create Basemap Object
s=sample_event[sample_event.img_type=='vil'].squeeze()
fig,ax=plt.subplots(1,1,figsize=(7,7))
m = Basemap(llcrnrlat=s.llcrnrlat, llcrnrlon=s.llcrnrlon,
            urcrnrlat=s.urcrnrlat,urcrnrlon=s.urcrnrlon,
            width=s.width_m, height=s.height_m,
            lat_0=38, lon_0=-98,
            projection='laea',
            resolution='i',
            ax=ax)
m.drawstates(color='w')
m.drawcoastlines(color='w')
m.drawcountries(color='w')
m.imshow(vil[:,:,24])

lat,lon = 46.7867, -92.1005 # Duluth, MN
x,y=m(lon,lat) # will be in projection coordinates
m.plot(x,y,linestyle='none', marker="o", markersize=16, alpha=0.6, c="red")
ax.text(x-30e3,y-30e3,'Duluth, MN',color='r')
Out[22]:
Text(170021.5273619945, 49057.56177252438, 'Duluth, MN')
- NOAA's Storm Event Database: https://www.ncdc.noaa.gov/stormevents/ftp.jsp


 被折叠的 条评论
为什么被折叠?
被折叠的 条评论
为什么被折叠?
 到【灌水乐园】发言


