


【可视化大屏开发】可视化大屏配置之静态图柱形图1定制
柱状图bar引入到html中
一、需求
将柱状图引入到设计好模块的index.html网页中
二、代码实现
柱状图图表(两大步骤)
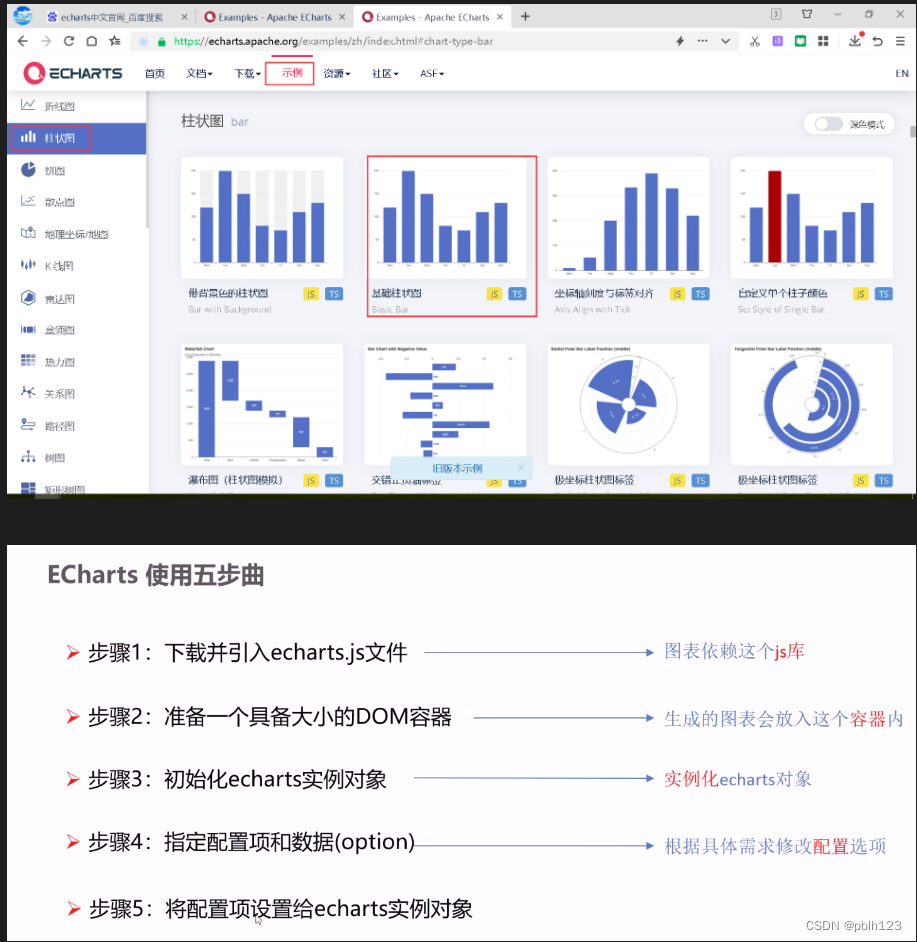
- 官网找到类似实例, 适当分析,并且引入到HTML页面中
- 根据需求定制图表
定制图表
- 在index.html文件中引入echarts.min.js代码
- 在js目录下,新建index.js文件
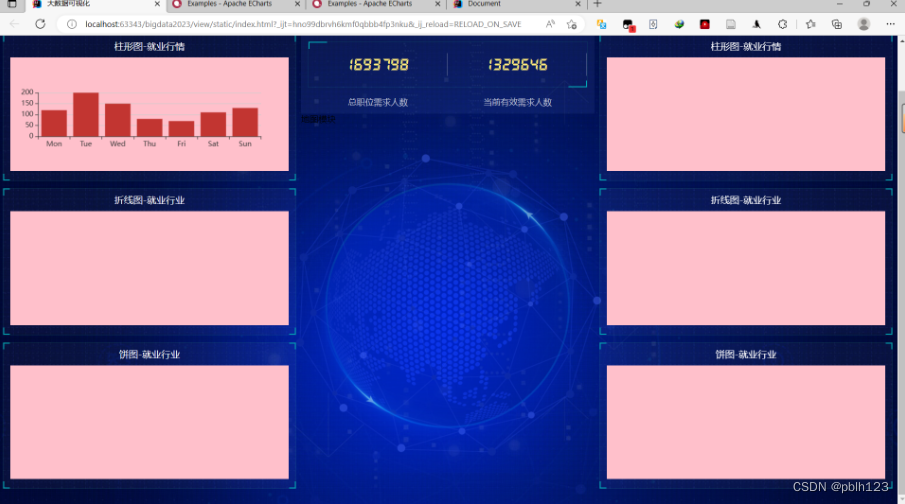
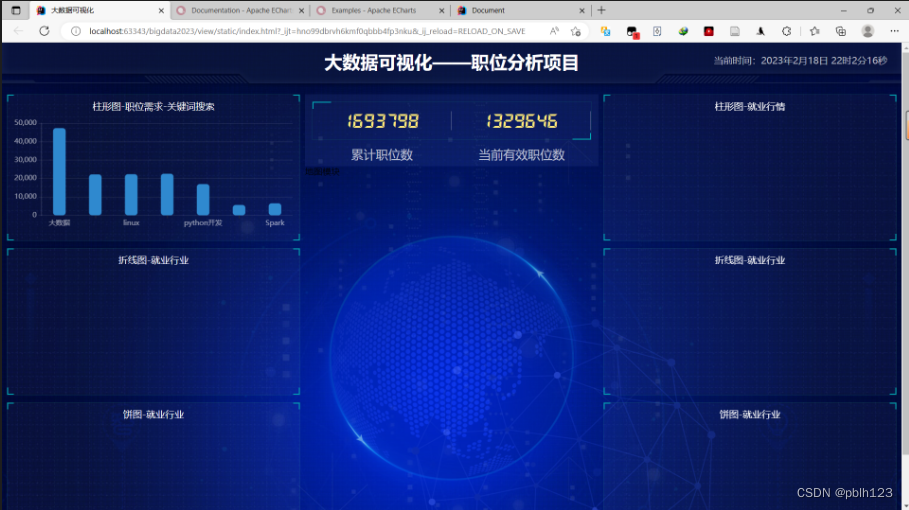
index.html
<body>
<selection class="mainbox">
<div class="column">
<div class="panel bar">
<h2>柱形图-就业行情</h2>
<div class="chart"></div>
<div class="panel-footer"></div>
</div> <div class="panel line">
<h2>折线图-就业行业</h2>
<div class="chart"></div>
<div class="panel-footer"></div>
</div> <div class="panel pie">
<h2>饼图-就业行业</h2>
<div class="chart"></div>
<div class="panel-footer"></div>
</div> </div> <div class="column">
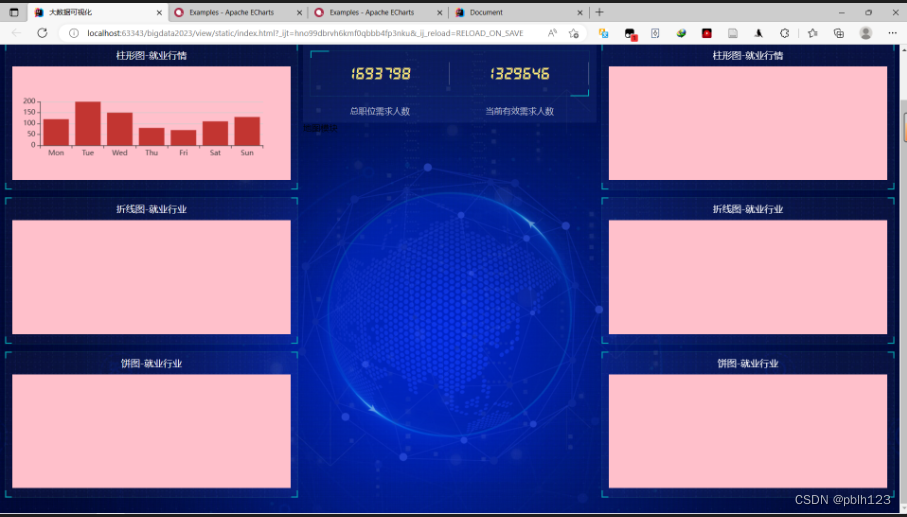
<!-- 数字模块-->
<div class="no">
<div class="no-hd">
<ul> <li>1693798</li>
<li>1329646</li>
</ul> </div> <div class="no-bd">
<ul> <li>总职位需求人数</li>
<li>当前有效需求人数</li>
</ul> </div> </div> <div class="map">
<div class="map1"></div>
<div class="map2"></div>
<div class="map3"></div>
<div class="echart">地图模块</div>
</div> </div> <div class="column">
<div class="panel bar">
<h2>柱形图-就业行情</h2>
<div class="chart"></div>
<div class="panel-footer"></div>
</div> <div class="panel line">
<h2>折线图-就业行业</h2>
<div class="chart"></div>
<div class="panel-footer"></div>
</div> <div class="panel pie">
<h2>饼图-就业行业</h2>
<div class="chart"></div>
<div class="panel-footer"></div>
</div> </div></selection>
<script src="js/flexible.js"></script>
<script src="js/echarts.min.js"></script>
<script src="js/index.js"></script>
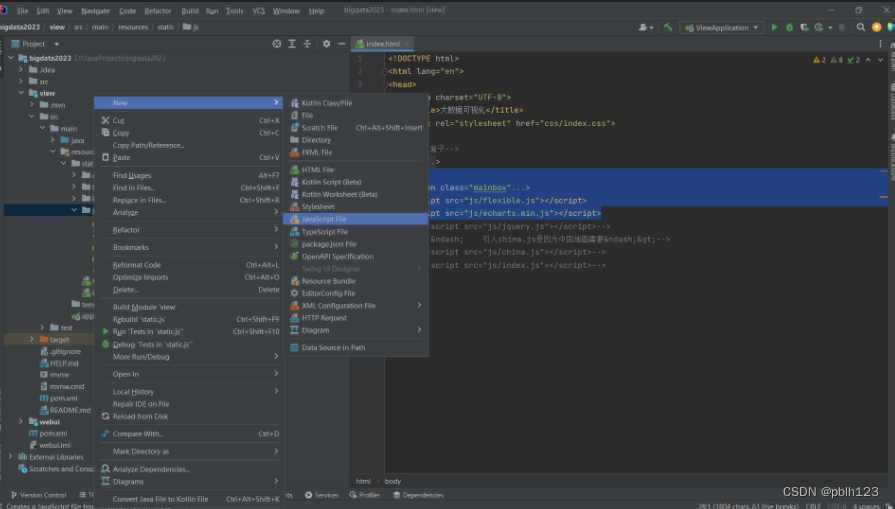
在index.js中编写立即执行函数
index.js
// 柱状图模块1
(function() {
// 1实例化对象
    var myChart = echarts.init(document.querySelector(".bar .chart"));


})();
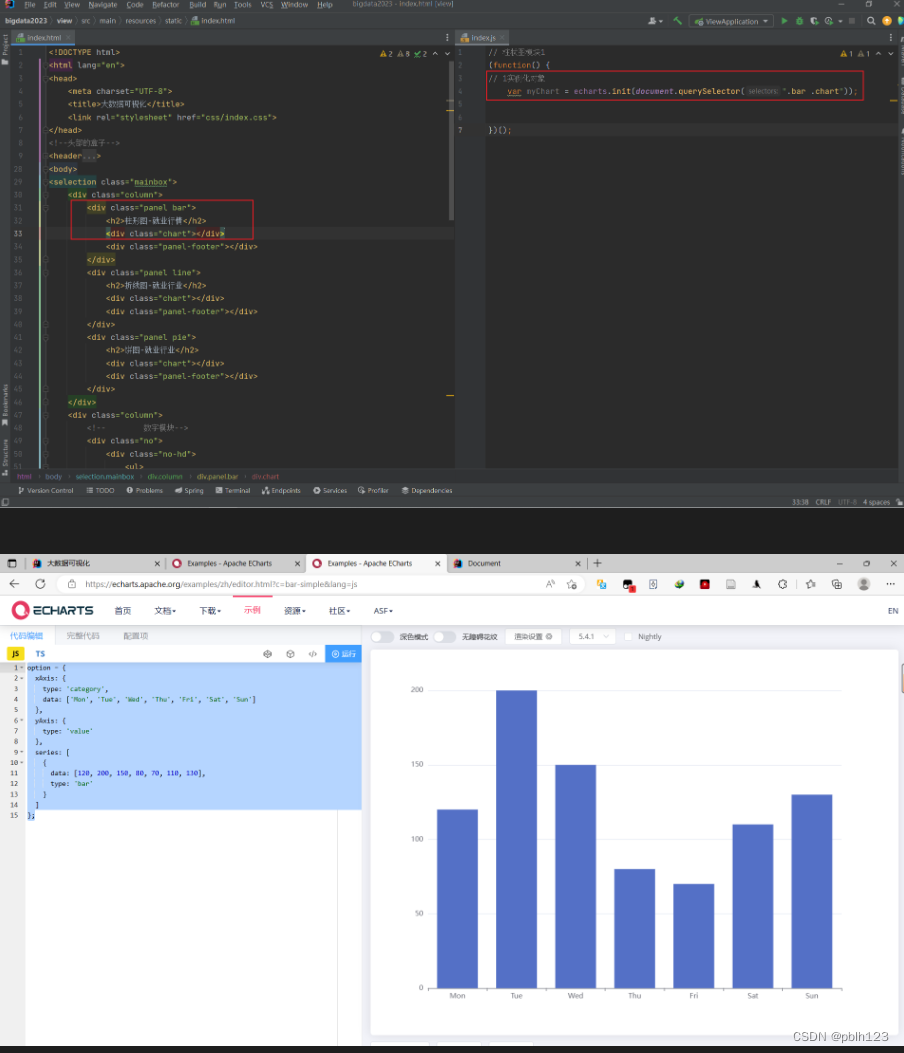
index.js
// 柱状图模块1
(function() {
// 1实例化对象
    var myChart = echarts.init(document.querySelector(".bar .chart"));

    // 2.指定配置项和数据
    option = {
        xAxis: {
            type: 'category',
            data: ['Mon', 'Tue', 'Wed', 'Thu', 'Fri', 'Sat', 'Sun']
        },
        yAxis: {
            type: 'value'
        },
        series: [
            {
                data: [120, 200, 150, 80, 70, 110, 130],
                type: 'bar'
            }
        ]
    };

    // 3.将配置项给实例对象
    myChart.setOption(option)
})();
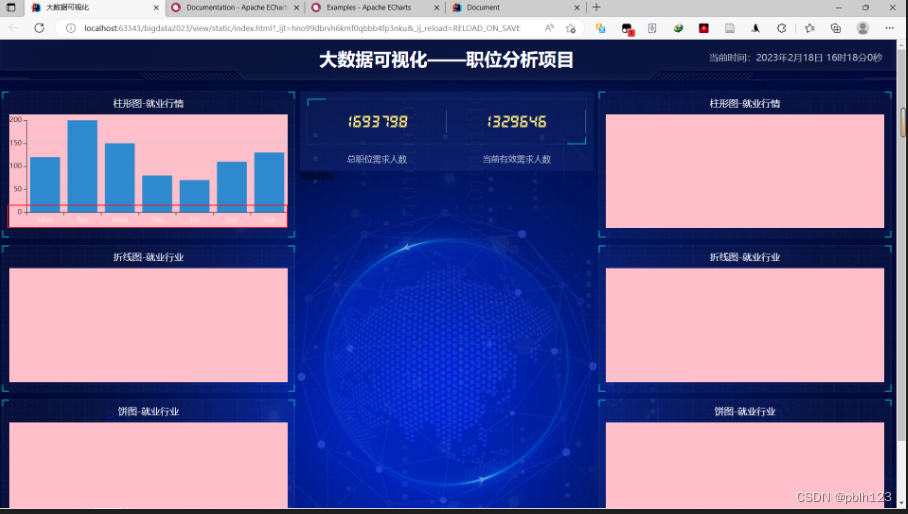
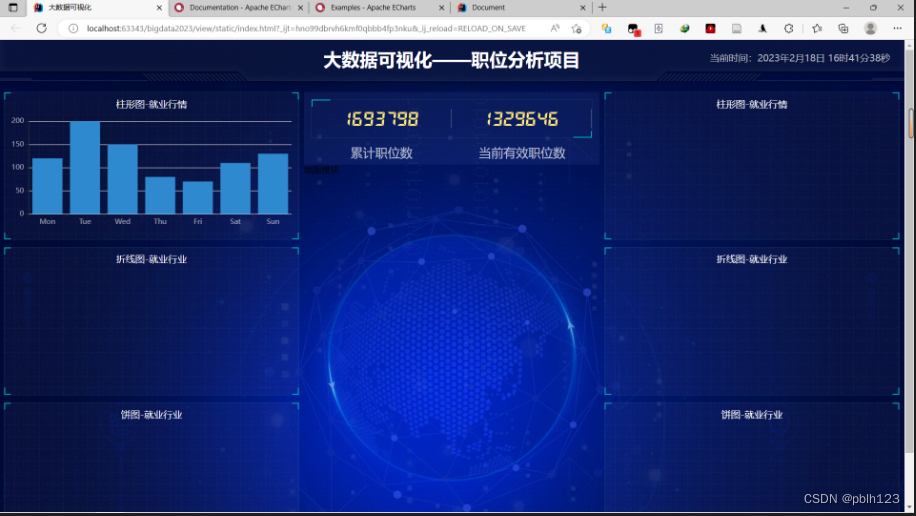
效果
定制1柱状图bar1-X轴相关定制
一、需求
- 需求1:- 修改图表柱形颜色 #2f89cf
- 需求2:- 修改图表大小 top 为 10px bottom 为 4% grid决定我们的柱状图的大小
二、代码实现
代码修改前
修改index.js代码
// 2.指定配置项和数据
option = {
    xAxis: {
        type: 'category',
        data: ['Mon', 'Tue', 'Wed', 'Thu', 'Fri', 'Sat', 'Sun']
    },
    yAxis: {
        type: 'value'
    },
    series: [
        {
            data: [120, 200, 150, 80, 70, 110, 130],
            type: 'bar'
        }
    ],
    color: ["#2f89cf"],
};
效果

修改图表大小 top 为 10px bottom 为 4% grid决定我们的柱状图的大小
// 2.指定配置项和数据
option = {
    xAxis: {
        type: 'category',
        data: ['Mon', 'Tue', 'Wed', 'Thu', 'Fri', 'Sat', 'Sun']
    },
    yAxis: {
        type: 'value'
    },
    series: [
        {
            data: [120, 200, 150, 80, 70, 110, 130],
            type: 'bar'
        }
    ],
    color: ["#2f89cf"],
    grid: {
        left: "0%",
        top: "10px",
        right: "0%",
        bottom: "4%",
        containLabel: true
    },
};
效果

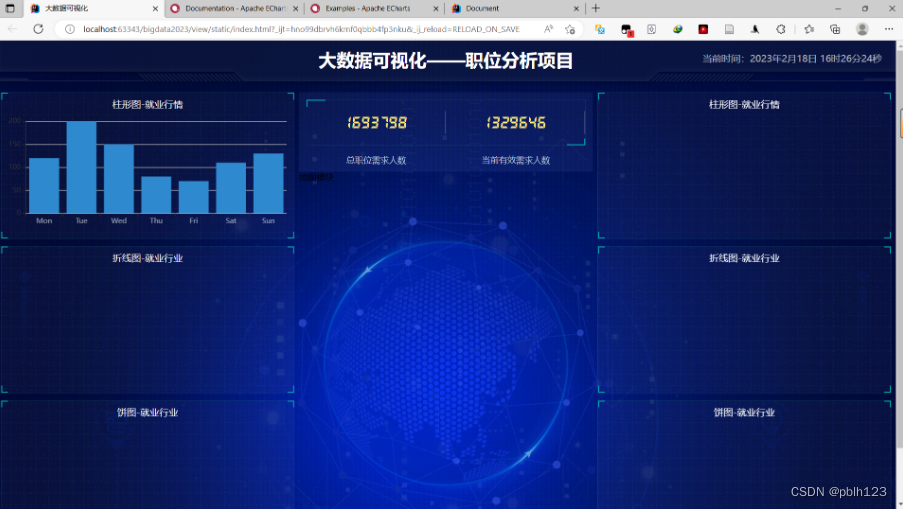
需求:X轴相关设置 xAxis
- 文本颜色设置为 rgba(255,255,255,.6) 字体大小为 12px
index.js
// 2.指定配置项和数据
option = {
    xAxis: {
        type: 'category',
        data: ['Mon', 'Tue', 'Wed', 'Thu', 'Fri', 'Sat', 'Sun'],
        // 修改刻度标签 相关样式
        axisLabel: {
            color: "rgba(255,255,255,.6) ",
            fontSize: "12"
        },
    },
    yAxis: {
        type: 'value'
    },
    series: [
        {
            data: [120, 200, 150, 80, 70, 110, 130],
            type: 'bar'
        }
    ],
    color: ["#2f89cf"],
    grid: {
        left: "0%",
        top: "10px",
        right: "0%",
        bottom: "4%",
        containLabel: true
    },
};
效果
样式不好看,把底色(粉色)删掉即可,找到less文件,找到char
index.less
    &::after{
      position: absolute;
      right: 0;
      bottom: 0;
      width: 10px;
      height: 10px;
      border-right: 2px solid #02a6b5;
      border-bottom: 2px solid #02a6b5;
      content: "";
    }
  }
  h2 {
    height: 0.6rem;
    color: #fff;
    line-height: 0.6rem;
    text-align: center;
    font-size: 0.25rem;
    font-weight: 400;
  }
  .chart {
    height: 3rem;
    //background-color: pink;
  }
}
//数字模块
效果

X轴线的样式 不显示
index.js
// 2.指定配置项和数据
option = {
    xAxis: {
        type: 'category',
        data: ['Mon', 'Tue', 'Wed', 'Thu', 'Fri', 'Sat', 'Sun'],
        // 修改刻度标签 相关样式
        axisLabel: {
            color: "rgba(255,255,255,.6) ",
            fontSize: "12"
        },
        // 不顯示x坐標軸
        axisLine: {
            show: false
        },
    },
效果
会出现map旋转框一段时间分开,旋转中心不同现象。等一段时间即可自动恢复
当前修改后代码
index.html
<!DOCTYPE html>
<html lang="en">
<head>
<meta charset="UTF-8">
<title>大数据可视化</title>
<link rel="stylesheet" href="css/index.css">
</head>
<!--头部的盒子-->
<header>
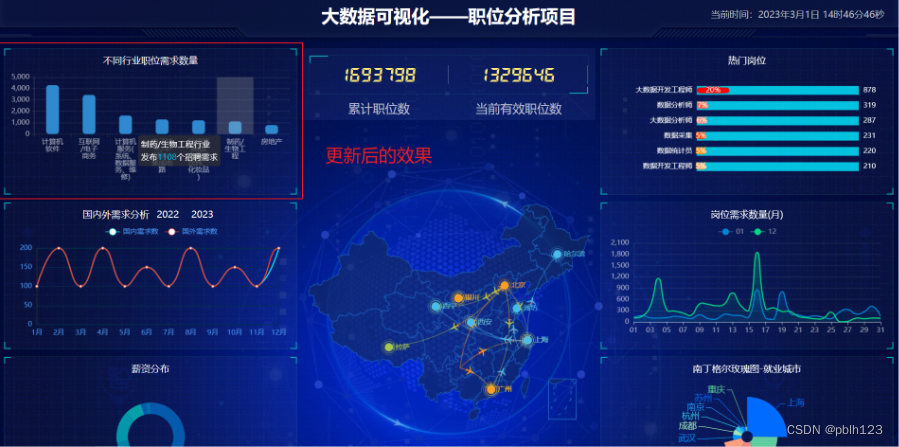
<h1>大数据可视化——职位分析项目</h1>
<div class="showTime"></div>
<script> var t = null;
t = setTimeout(time, 1000); //开始运行
function time() {
clearTimeout(t); //清楚计时器
dt = new Date()
var y = dt.getFullYear();
var mt = dt.getMonth() + 1;
var day = dt.getDate();
var h = dt.getHours();
var m = dt.getMinutes();
var s = dt.getSeconds();
document.querySelector(".showTime").innerHTML = "当前时间:" + y + '年' + mt + '月' + day + '日 ' + h + '时' + m + '分' + s + '秒'
}
</script>
</header>
<body>
<selection class="mainbox">
<div class="column">
<div class="panel bar">
<h2>柱形图-就业行情</h2>
<div class="chart"></div>
<div class="panel-footer"></div>
</div> <div class="panel line">
<h2>折线图-就业行业</h2>
<div class="chart"></div>
<div class="panel-footer"></div>
</div> <div class="panel pie">
<h2>饼图-就业行业</h2>
<div class="chart"></div>
<div class="panel-footer"></div>
</div> </div> <div class="column">
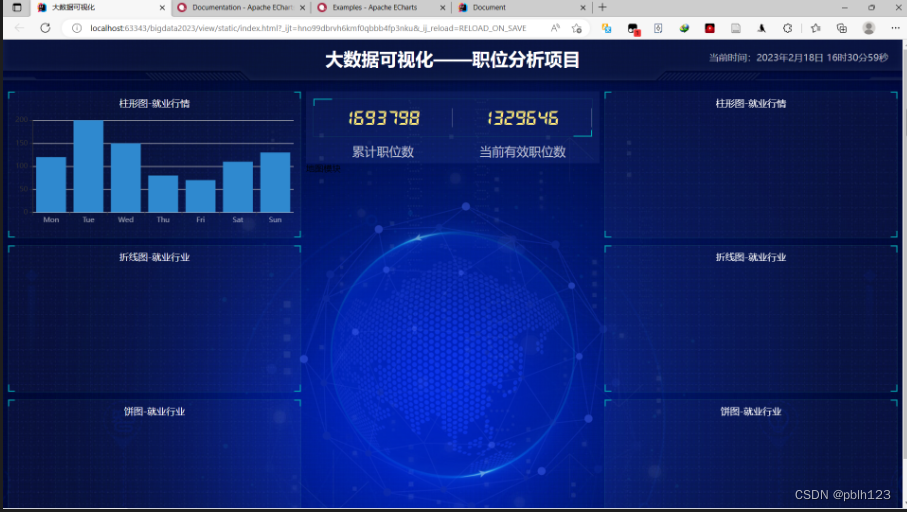
<!-- 数字模块-->
<div class="no">
<div class="no-hd">
<ul> <li>1693798</li>
<li>1329646</li>
</ul> </div> <div class="no-bd">
<ul> <li>累计职位数</li>
<li>当前有效职位数</li>
</ul> </div> </div> <div class="map">
<div class="map1"></div>
<div class="map2"></div>
<div class="map3"></div>
<div class="echart">地图模块</div>
</div> </div> <div class="column">
<div class="panel bar">
<h2>柱形图-就业行情</h2>
<div class="chart"></div>
<div class="panel-footer"></div>
</div> <div class="panel line">
<h2>折线图-就业行业</h2>
<div class="chart"></div>
<div class="panel-footer"></div>
</div> <div class="panel pie">
<h2>饼图-就业行业</h2>
<div class="chart"></div>
<div class="panel-footer"></div>
</div> </div></selection>
<script src="js/flexible.js"></script>
<script src="js/echarts.min.js"></script>
<script src="js/index.js"></script>
<!-- <script src="js/jquery.js"></script>-->
<!--<!– 引入china.js是因为中国地图需要–>-->
<!-- <script src="js/china.js"></script>-->
</body>
</html>
index.less
//声明字体
@font-face{
  font-family: electronicFont;
  src: url("../font/DS-DIGIT.TTF");
}
// css初始化
*{
  margin: 0;
  padding: 0;
  box-sizing: border-box;
}

.box{
  width: 1rem;
  height: 1rem;
  background-color: pink;
}

body{
  background:url(../images/bg.jpg) no-repeat top center;
  line-height: 1.15;
}

//头部盒子
header{
  position: relative;
  height: 1.25rem;
  height: 80px;
  background: url(../images/head_bg.png) no-repeat;
  background-size: 100% 100%;
}
header h1{
  font-size: 0.475rem;
  color: #fff;
  text-align: center;
  line-height: 1rem;
}
header .showTime{
  position: absolute;
  right: 0.375rem;
  top: 0;
  line-height: 0.9375rem;
  color: rgba(255,255,255,0.7);
  font-size: 0.25rem;
}

//页面mainbox主题布局
.mainbox{
  display: flex;
  min-width: 1024px;
  max-width: 1920px;
  margin: 0 auto;
  padding: 0.125rem 0.125rem 0;
}
.column{
  flex: 5;
}
.column:nth-child(2){
  flex: 5;
  margin: 0 0.125rem 0.1875rem;
}
.panel{
  position: relative;
  height: 3.875rem;
  padding: 0 0.1875rem 0.5rem;
  border: 1px solid rgba(25,186,139,0.17);
  margin-bottom: 0.1875rem;
  background: url(../images/line.png) rgba(255,255,255,0.03);
  //制作左上角
  &::before{
    position: absolute;
    top: 0;
    left: 0;
    width: 10px;
    height: 10px;
    border-left: 2px solid #02a6b5;
    border-top: 2px solid #02a6b5;
    content: "";
  }
  //制作右上角
  &::after{
    position: absolute;
    top: 0;
    right: 0;
    width: 10px;
    height: 10px;
    border-right: 2px solid #02a6b5;
    border-top:  2px solid #02a6b5;
    content: "";
  }
  .panel-footer{
    position: absolute;
    bottom: 0;
    left: 0;
    width: 100%;
    &::before{
      position: absolute;
      left: 0;
      bottom: 0;
      width: 10px;
      height: 10px;
      border-left: 2px solid #02a6b5;
      border-bottom: 2px solid #02a6b5;
      content: "";
    }
    &::after{
      position: absolute;
      right: 0;
      bottom: 0;
      width: 10px;
      height: 10px;
      border-right: 2px solid #02a6b5;
      border-bottom: 2px solid #02a6b5;
      content: "";
    }
  }
  h2 {
    height: 0.6rem;
    color: #fff;
    line-height: 0.6rem;
    text-align: center;
    font-size: 0.25rem;
    font-weight: 400;
  }
  .chart {
    height: 3rem;
  }
}
//数字模块
.no{
  background: rgba(101,132,226,0.1);
  padding: 0.1875rem;
}
.no-hd{
  position: relative;
  border: 1px solid rgba(25,186,139,0.17);
  ul{
    display: flex;
  }
  li{
    position: relative;
    flex: 1;
    line-height: 1rem; // 行高
    font-size: 0.575rem; // 字体大小
    color: #ffeb7b;
    text-align: center;
    font-family: electronicFont;
    &::after{
      content: "";
      position: absolute;
      top: 25%;
      right: 0;
      height: 50%;
      width: 2px;
      background: rgba(255,255,255,0.2);
    }
  }
  li{
    list-style: none;
  }
  &::before{
    position: absolute;
    top: 0;
    left: 0;
    content: "";
    width: 30px;
    height: 10px;
    border-top: 2px solid #02a6b5;
    border-left: 2px solid #02a6b5;
  }
  &::after{
    position: absolute;
    bottom: 0;
    right: 0;
    content: "";
    width: 30px;
    height: 10px;
    border-right: 2px solid #02a6b5;
    border-bottom: 2px solid #02a6b5;
  }
}
.no-bd{
  ul {
    display: flex;
    li {
      flex: 1;
      text-align: center;
      color: rgba(255, 255, 255, 0.7);
      font-size: 0.325rem;
      height: 0.5rem;
      line-height: 0.5rem;
      padding-top: 0.125rem;
    }
    li{
      list-style: none;
    }
  }
}
// map模块配置
.map{
  position: relative;
  height: 10.125rem;
}
.map1 {
  width: 6.475rem;
  height: 6.475rem;
  position: absolute;
  top: 50%;
  left: 50%;
  transform: translate(-50%, -50%);
  background: url(../images/map.png);
  background-size: 100% 100%;
  opacity: 0.3;
}
.map2{
  position: absolute;
  top: 50%;
  left: 50%;
  transform: translate(-50%, -50%);
  width: 8.0375rem;
  height: 8.0375rem;
  background: url(../images/lbx.png);
  background-size: 100% 100%;
  animation: rotate1 15s linear infinite;
  opacity: 0.6;
}
@keyframes rotate1 {
  from{
    transform: translate(-50%, -50%) rotate(0deg);
  }
  to {
    transform: translate(-50%, -50%) rotate(360deg);
  }
}
.map3 {
  position: absolute;
  top: 50%;
  left: 50%;
  transform: translate(-50%, -50%);
  width: 7.075rem;
  height: 7.075rem;
  background: url(../images/jt.png);
  background-size: 100% 100%;
  animation: rotate2 10s linear infinite;
  opacity: 0.6;
}
@keyframes rotate2 {
  form {
    transform: translate(-50%, -50%) rotate(0deg);
  }
  to {
    transform: translate(-50%, -50%) rotate(-360deg);
  }
}
.echart{
  position: absolute;
  top: 0;
  left: 0;
  width: 100%;
  height: 10.125rem;
}
当前效果
定制2柱状图bar1-Y轴相关定制
一、需求
- 文本颜色设置为 rgba(255,255,255,.6) 字体大小为 12px
- Y 轴线条样式 更改为 1像素的 rgba(255,255,255,.1) 边框
- 分隔线的颜色修饰为 1像素的 rgba(255,255,255,.1)
二、代码实现
需求1:文本颜色设置为 rgba(255,255,255,.6) 字体大小为 12px
在index.js中修改代码如下
yAxis: {
    type: 'value',
    // 修改刻度标签 相关样式
    axisLabel: {
        color: "rgba(255,255,255,.6) ",
        fontSize: 12,
    },
},
效果
需求2:Y 轴线条样式 更改为 1像素的
rgba(255,255,255,.1) 边框
在index.js文件中,找到Y轴的位置yAxis: ,增加一下代码
yAxis: {
    type: 'value',
    // 修改刻度标签 相关样式
    axisLabel: {
        color: "rgba(255,255,255,.6) ",
        fontSize: 12,
    },
    // y轴的线条改为了 2像素
    axisLine: {
        lineStyle: {
            color: "rgba(255,255,255,.1)"
        },
    }
},
效果
y轴太细了,增加 width: 2
修改后的代码如下
yAxis: {
    type: 'value',
    // 修改刻度标签 相关样式
    axisLabel: {
        color: "rgba(255,255,255,.6) ",
        fontSize: 12,
    },
    // y轴的线条改为了 2像素
    axisLine: {
        lineStyle: {
            color: "rgba(255,255,255,.1)",
            width: 2,
        },
    },
},
效果

这里其实效果不明显,可以通过width: 12 到2 看看变化,更明显
需求3:分隔线的颜色修饰为 1像素的 rgba(255,255,255,.1)
在index.js文件中,找到Y轴的位置yAxis: ,增加一下代码
yAxis: {
    type: 'value',
    // 修改刻度标签 相关样式
    axisLabel: {
        color: "rgba(255,255,255,.6) ",
        fontSize: 12,
    },
    // y轴的线条改为了 2像素
    axisLine: {
        lineStyle: {
            color: "rgba(255,255,255,.1)",
            width: 2,
        },
    },
    // y轴分割线的颜色
    splitLine: {
        lineStyle: {
            color: "rgba(255,255,255,.1)",
        }
    }
},
效果

定制3柱状图bar1-柱形及宽度定制
一、需求
- 修改柱形为圆角以及柱子宽度 series 里面设置
- 修改柱子为圆角
- 更换对应数据
二、代码实现
需求1:修改柱形为圆角以及柱子宽度 series 里面设置
修改index.js
series: [
    {
        data: [120, 200, 150, 80, 70, 110, 130],
        type: 'bar',
        name: 'Direct',
        barWidth: '35%',
    }
],
效果
需求2:修改柱子为圆角,在 series 里面 增加以下代码,
series: [
    {
        data: [120, 200, 150, 80, 70, 110, 130],
        type: 'bar',
        name: 'Direct',
        barWidth: '35%',
        itemStyle: {
            // 修改柱子圆角,可以修改不同大小值,看圆角效果
            barBorderRadius: 5,
        },
    },
],

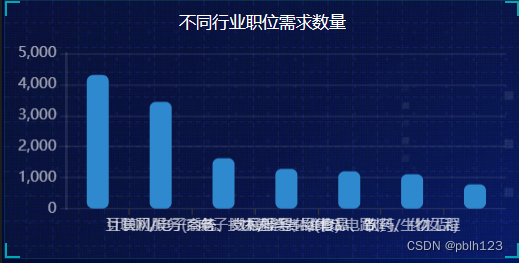
需求3:更换对应数据
代码如下
// 2.指定配置项和数据
option = {
xAxis: {
type: 'category',
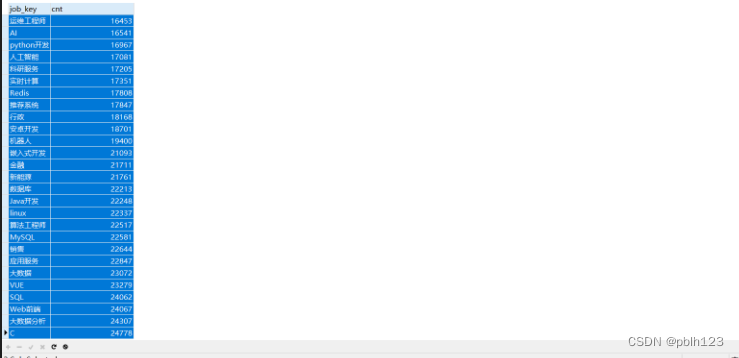
data: ['大数据', 'Java开发', 'linux', 'MySQL', 'python开发', 'hive', 'Spark'],
// 修改刻度标签 相关样式
axisLabel: {
color: "rgba(255,255,255,.6) ",
fontSize: "12"
},
// 不顯示x坐標軸
axisLine: {
show: false
},
},
yAxis: {
type: 'value',
// 修改刻度标签 相关样式
axisLabel: {
color: "rgba(255,255,255,.6) ",
fontSize: 12,
},
// y轴的线条改为了 2像素
axisLine: {
lineStyle: {
color: "rgba(255,255,255,.1)",
width: 2,
},
},
// y轴分割线的颜色
splitLine: {
lineStyle: {
color: "rgba(255,255,255,.1)",
}
}
},
series: [
{
data: [47379, 22248, 22337, 22581, 16967, 5623, 6521],
type: 'bar',
name: 'Direct',
barWidth: '35%',
itemStyle: {
// 修改柱子圆角,可以修改不同大小值,看圆角效果
barBorderRadius: 5,
},
},
],
color: ["#2f89cf"],
grid: {
left: "0%",
top: "10px",
right: "0%",
bottom: "4%",
containLabel: true
},
};
效果
debug
需要思考怎么解决,问题
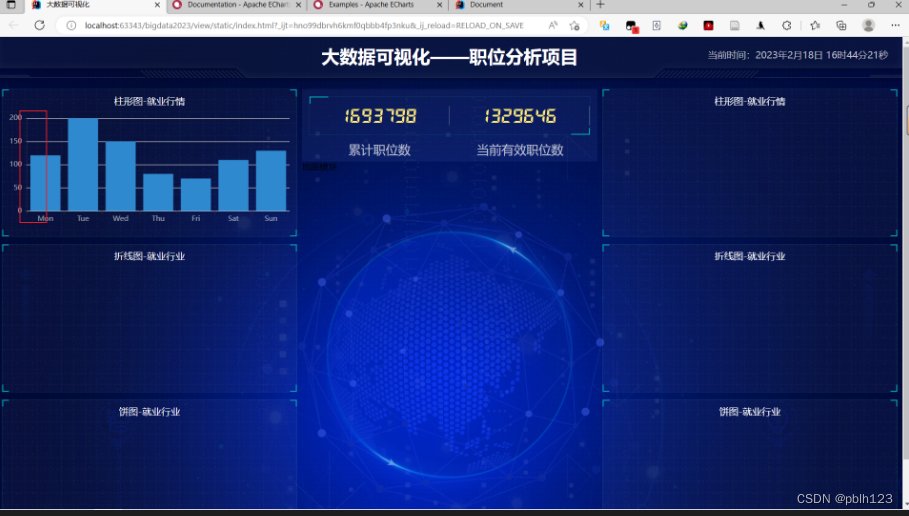
Echarts图形随浏览器缩放适应
一、需求
- 让图表跟随屏幕自适应
没设置前
![[Pasted image 20230218220626.png]]
二、代码实现
但屏幕缩小的时候,图标未能跟着缩放,不符合实际使用,实际使用中,图标需要跟着屏幕一起缩放才行
问题展示
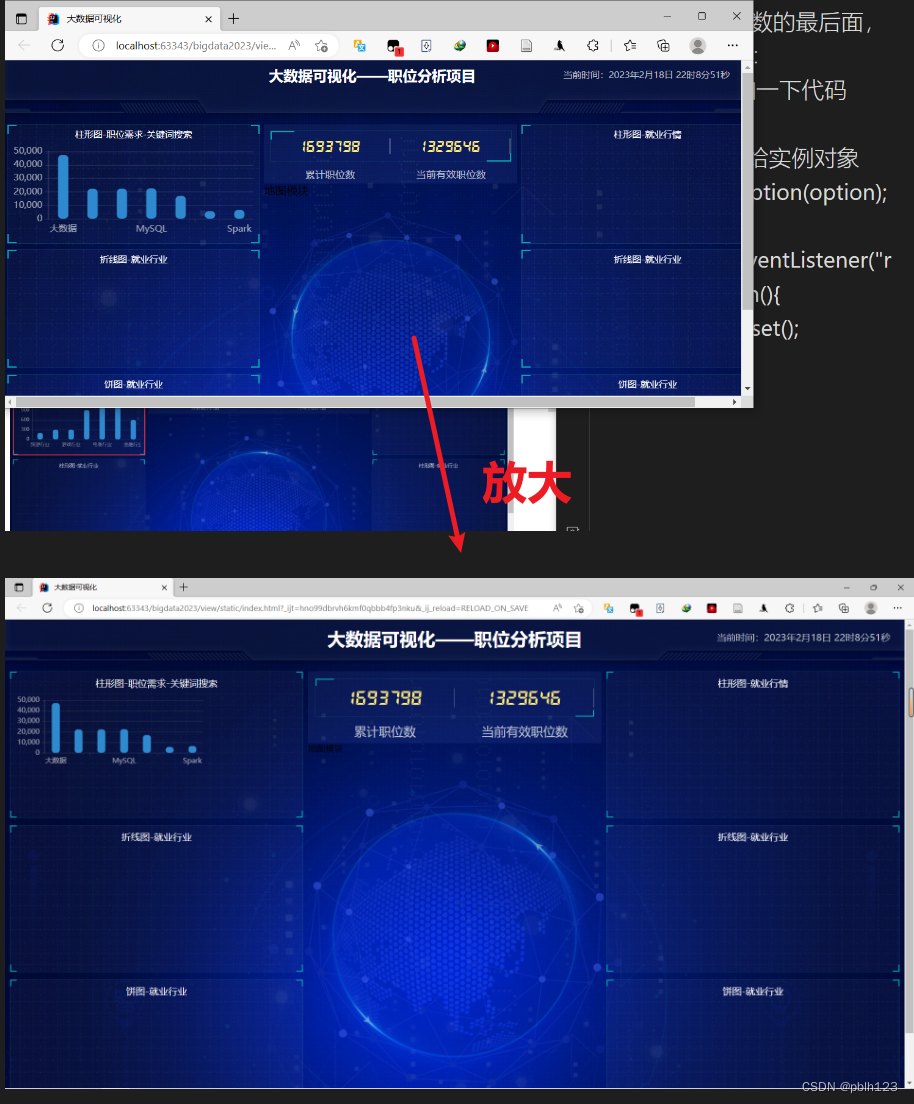
代码实现
在立即执行函数的最后面,增加以下代码:
index.js中添加一下代码
// 3.将配置项给实例对象
window.addEventListener("resize",function () {
    myChart.resize();
    // console.log("监控窗口变化,实现图形自适应窗口大小");
})
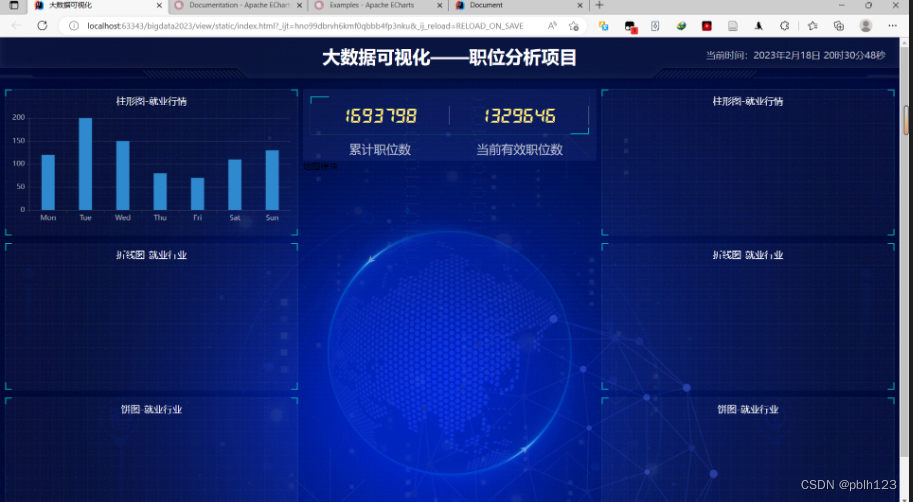
图形可随着浏览器自适应变化效果
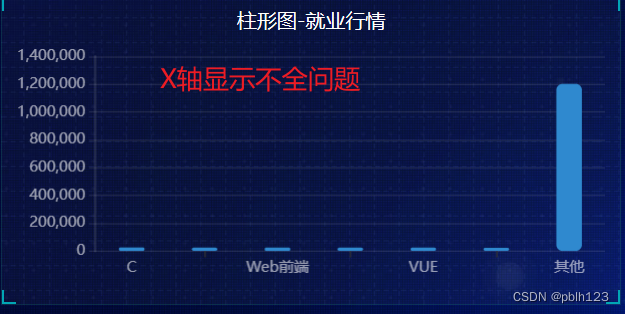
X轴标签显示不完全问题优化
柱状图,
tooltip: {
    trigger: 'axis',
    axisPointer: {
        type: 'shadow'  // shadow: 阴影指示器, line:直线指示器,cross:十字指示器
    },
},
xAxis: {
    type: 'category',
    data: ['大数据', 'Java开发', 'linux', 'MySQL', 'python开发', 'hive', 'Spark'],
    // 修改刻度标签 相关样式
    axisLabel: {
        color: "rgba(255,255,255,.6) ",
        fontSize: "12",
        show: true,
        interval: 0,  // X轴label显示全
    },
    // 不顯示x坐標軸
    axisLine: {
        show: false
    },
},
x轴标签有重叠效果,显示不好,在修改
tooltip: {
    trigger: 'axis',
    axisPointer: {
        type: 'shadow'  // shadow: 阴影指示器, line:直线指示器,cross:十字指示器
    },
    // 定义tooltip鼠标放上去后的提示显示效果
    formatter: function (params) {
        return '<div>'+ params[0].name +'行业<br>' + '发布' + '<span style="color: #00BFFF;">'+params[0].value + '</span>个招聘需求'+'</div>';
    }
},
xAxis: {
    type: 'category',
    data: ['大数据', 'Java开发', 'linux', 'MySQL', 'python开发', 'hive', 'Spark'],
    // 修改刻度标签 相关样式
    axisLabel: {
        color: "rgba(255,255,255,.6) ",
        fontSize: "12",
        show: true,
        interval: 0,  // X轴label显示全
        formatter: function (params) {
            var newParamsName = "";
            var paramsNameNumber = params.length;
            var provideNumber = 3;
            var rowNumber = Math.ceil(paramsNameNumber / provideNumber);
            if (paramsNameNumber > provideNumber){
                for (var p = 0;p < rowNumber; p++){
                    var tempStr = "";
                    var start = p * provideNumber;
                    var end = start + provideNumber;
                    if (p == rowNumber - 1 ){
                        tempStr = params.substring(start, paramsNameNumber);
                    } else{
                        tempStr = params.substring(start, end) + "\n"
                    }
                    newParamsName += tempStr;
                }
            } else {
                newParamsName = params;
            }
            return newParamsName;
        }

    },
    // 不顯示x坐標軸
    axisLine: {
        show: false
    },
},
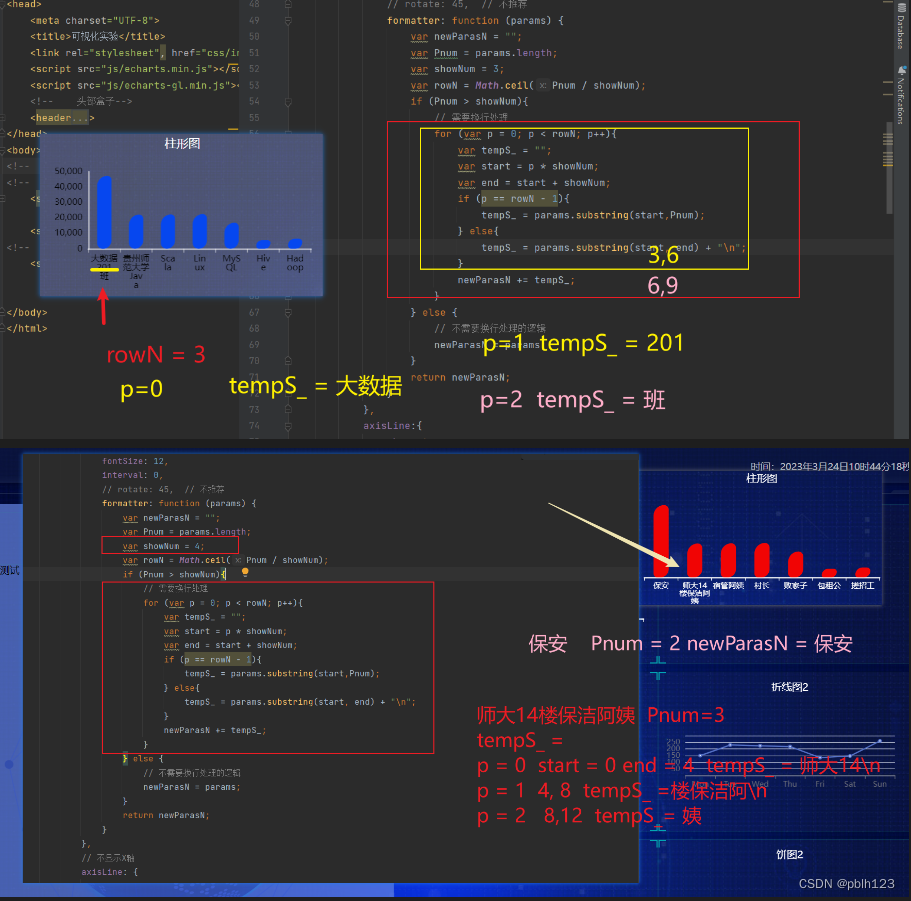
效果
可视化大屏项目参考链接
【可视化大屏开发】1.基础开发环境准备_pblh123的博客-CSDN博客
【可视化大屏开发】2.基础项目配置及大屏布局_pblh123的博客-CSDN博客
【可视化大屏开发】3.大屏配置之数字模块配置_pblh123的博客-CSDN博客
【可视化大屏开发】4.大屏配置之地球模块配置_pblh123的博客-CSDN博客
【可视化大屏开发】5.大屏配置之Echarts入门学习_pblh123的博客-CSDN博客
【可视化大屏开发】6.可视化大屏配置之静态图柱形图1定制_pblh123的博客-CSDN博客
【可视化大屏开发】7.可视化大屏配置之静态图条形图定制_pblh123的博客-CSDN博客
【可视化大屏开发】8. 可视化大屏配置之静态图折线图1定制_pblh123的博客-CSDN博客
【可视化大屏开发】9. 可视化大屏配置之静态图折线图2定制_pblh123的博客-CSDN博客
【可视化大屏开发】10. 可视化大屏配置之静态图饼图1定制_pblh123的博客-CSDN博客
【可视化大屏开发】11. 可视化大屏配置之静态图饼图2定制_pblh123的博客-CSDN博客
【可视化大屏开发】12. 可视化大屏配置之静态图中国地图定制_pblh123的博客-CSDN博客
【可视化大屏开发】13. 可视化大屏配置之打通前后端更新静态图数据_pblh123的博客-CSDN博客
【可视化大屏开发】14. Maven打包可视化大屏项目-发布jar包_pblh123的博客-CSDN博客
【可视化大屏开发】15.可视化大屏项目-网络访问静态数据无法更新问题修复_pblh123的博客-CSDN博客
【可视化大屏开发】16. 可视化大屏项目共性优化问题_pblh123的博客-CSDN博客
17.可视化大屏配置之代码整理资源-CSDN文库
可视化大屏项目动态数据样例资源-CSDN文库


 2763
2763


 被折叠的 条评论
为什么被折叠?
被折叠的 条评论
为什么被折叠?
 到【灌水乐园】发言


