


启动服务
GRPCChannelManager
功能:监听网络状态,通知其它服务重连。
步骤:
- 创建1个定时线程(每30s),根据是否reconnect=true来创建新的grpc managedChannel。
- 通知所有监听的服务,这些服务会拿这个新的managedChannel重新创建grpc stub,这样就实现了网络重连。
- 同时,如果这些服务出现了异常,会调用GRPCChannelManager#reportError方法重置reconnect=true,这样GRPCChannelManager就能感知到网络故障了。
注册的监听服务如下:
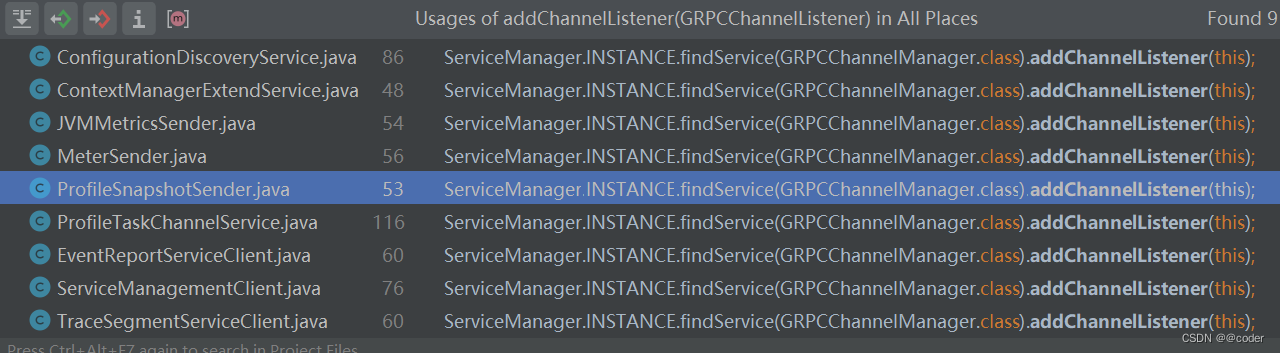
ServiceManagementClient
功能:定时发送心跳给OAP,接收OAP下发的命令。
步骤:
- 创建1个定时线程(每30s),往OAP发送心跳。
- 如果正常,将会收到OAP的命令,然后转交给CommandService执行。
- 如果异常,告诉GRPCChannelManager网络异常了。
CommandService
功能:不断获取命令执行,其它服务可通过receiveCommand方法提交命令。
步骤:
- 创建1个线程,不断从LinkedBlockingQueue中获取命令,交给CommandExecutorService进行分发(同一个命令不会重复执行,根据命令编号来确认)。
- CommandExecutorService根据命令类型分发给不同的CommandExecutor。
命令和命令执行器如下:
- ProfileTaskCommand => ProfileTaskCommandExecutor
- ConfigurationDiscoveryCommand => ConfigurationDiscoveryCommandExecutor
- 其它命令 => NoopCommandExecutor(啥也没干)
TraceSegmentServiceClient
功能:把TraceSegment发给OAP。
步骤:
- 创建1个数据池DataCarrier(默认5个队列,每个队列大小为300)。
- 把数据池的队列绑定到消费线程上(默认是1个,即它要消费所有队列)。
- 这些消费线程共用1个TraceSegmentServiceClient,把TraceSegment发给OAP。如果发送成功,会收到OAP下发的命令,继而转交给CommandService执行。如果发送失败,会告诉GRPCChannelManager网络异常了。
    @Override
    public void boot() {
        lastLogTime = System.currentTimeMillis();
        segmentUplinkedCounter = 0;
        segmentAbandonedCounter = 0;
        // 创建数据池,默认有5个消费队列,每个消费队列大小为300
        carrier = new DataCarrier<>(CHANNEL_SIZE, BUFFER_SIZE, BufferStrategy.IF_POSSIBLE);
        // 参数2定义了有几个消费线程,每个线程会消费自己所分配的队列。由于第1个参数是自身,所以这些线程最终都会共用TraceSegmentServiceClient把Trace数据发送给OAP
        carrier.consume(this, 1);
    }

	// 把Trace数据发送给OAP
    @Override
    public void consume(List<TraceSegment> data) {
        if (CONNECTED.equals(status)) {
            final GRPCStreamServiceStatus status = new GRPCStreamServiceStatus(false);
            // 客户端grpc流,客户端分批次发送请求数据,服务端接完所有数据后统一响应一次
            StreamObserver<SegmentObject> upstreamSegmentStreamObserver = serviceStub.withDeadlineAfter(
                Config.Collector.GRPC_UPSTREAM_TIMEOUT, TimeUnit.SECONDS
            ).collect(new StreamObserver<Commands>() {
                @Override
                public void onNext(Commands commands) {
                    ServiceManager.INSTANCE.findService(CommandService.class)
                                           .receiveCommand(commands);
                }

                @Override
                public void onError(
                    Throwable throwable) {
                    status.finished();
                    if (LOGGER.isErrorEnable()) {
                        LOGGER.error(
                            throwable,
                            "Send UpstreamSegment to collector fail with a grpc internal exception."
                        );
                    }
                    ServiceManager.INSTANCE
                        .findService(GRPCChannelManager.class)
                        .reportError(throwable);
                }

                @Override
                public void onCompleted() {
                    status.finished();
                }
            });

            try {
                for (TraceSegment segment : data) {
                    // 把segment转换成proto数据
                    SegmentObject upstreamSegment = segment.transform();
                    // GRPC发送到OAP
                    upstreamSegmentStreamObserver.onNext(upstreamSegment);
                }
            } catch (Throwable t) {
                LOGGER.error(t, "Transform and send UpstreamSegment to collector fail.");
            }

            // 告诉GRPC流已经完全写入进去了,回调上面的StreamObserver
            upstreamSegmentStreamObserver.onCompleted();
            // 强制等待所有的traceSegment都发送完成
            status.wait4Finish();
            segmentUplinkedCounter += data.size();
        } else {
            segmentAbandonedCounter += data.size();
        }

        printUplinkStatus();
    }

	//在1个TraceSegment结束的时候,会调用到此方法。TracingContext.ListenerManager.notifyFinish(finishedSegment);
    @Override
    public void afterFinished(TraceSegment traceSegment) {
        if (traceSegment.isIgnore()) {
            return;
        }
        // 往数据池灌traceSegment
        if (!carrier.produce(traceSegment)) {
            if (LOGGER.isDebugEnable()) {
                LOGGER.debug("One trace segment has been abandoned, cause by buffer is full.");
            }
        }
    }
DataCarrier代码如下
public class DataCarrier<T> {
	private Channels<T> channels;

    public DataCarrier consume(Class<? extends IConsumer<T>> consumerClass, int num, long consumeCycle) {
        if (driver != null) {
            driver.close(channels);
        }
        driver = new ConsumeDriver<T>(this.name, this.channels, consumerClass, num, consumeCycle);
        //把队列绑定到几个消费线程上
        driver.begin(channels);
        return this;
    }
}
ProfileTaskChannelService
功能:1. 定时获取OAP新建的Trace Profiling任务,返回ProfileTaskCommand。2. 定时发送线程快照给OAP
步骤
- 新建1个定时线程(默认20s),线程去获取OAP端的Trace Profiling任务,返回ProfileTaskCommand
- 把ProfileTaskCommand交给CommandService执行
- CommandService会把ProfileTaskCommand交给ProfileTaskCommandExecutor,ProfileTaskCommandExecutor负责把ProfileTaskCommand转换为ProfileTask,最后把ProfileTask交给ProfileTaskExecutionService真正的执行
- 新建1个定时线程(默认500ms),从BlockingQueue< TracingThreadSnapshot>队列中取线程快照,交给ProfileSnapshotSender服务发给OAP。
ProfileTaskExecutionService
功能:真正地执行ProfileTask。
步骤:
- 先结束上1个ProfileTask
- new ProfileTaskExecutionContext(ProfileTask),更新全局引用AtomicReference< ProfileTaskExecutionContext> taskExecutionContext
- new ProfileThread(ProfileTaskExecutionContext)
- 把ProfileThread提交给线程池开始运行
- ProfileThread会从ProfileTaskExecutionContext中获取所有的slots,即AtomicReferenceArray profilingSegmentSlots,默认有5个slot,所以最多能采集5个线程。
这个profilingSegmentSlots是何时插入值的呢?
在agent拦截入口方法前(比如tomcat),如果请求是被1个新线程处理,那么这个线程会去new TracingContext(先从全局引用taskExecutionContext中拿到当前的ProfileTaskExecutionContext,然后把当前线程封装成ThreadProfiler,根据请求端点和最大采样次数来判断本次是否插入profilingSegmentSlots)。 - 遍历profilingSegmentSlots,利用ThreadProfiler来构建快照,主要是获取线程堆栈,然后往ProfileTaskChannelService中添加,这样线程的快照信息就可以发送给OAP了。
- 在采样持续时间达到后取消线程
public class ProfileTaskCommandExecutor implements CommandExecutor {

    @Override
    public void execute(BaseCommand command) throws CommandExecutionException {
        final ProfileTaskCommand profileTaskCommand = (ProfileTaskCommand) command;

        // build profile task
        final ProfileTask profileTask = new ProfileTask();
        profileTask.setTaskId(profileTaskCommand.getTaskId());
        // 采样的端点
        profileTask.setFirstSpanOPName(profileTaskCommand.getEndpointName());
        // 采样持续时间
        profileTask.setDuration(profileTaskCommand.getDuration());
        // 最小采样时间门限(当前时间-请求进入的时间必须大于此值,才认为这个请求是需要采样的)
        profileTask.setMinDurationThreshold(profileTaskCommand.getMinDurationThreshold());
        // 采样间隔
        profileTask.setThreadDumpPeriod(profileTaskCommand.getDumpPeriod());
        // 最大采样数
        profileTask.setMaxSamplingCount(profileTaskCommand.getMaxSamplingCount());
        // 采样开始时间
        profileTask.setStartTime(profileTaskCommand.getStartTime());
        profileTask.setCreateTime(profileTaskCommand.getCreateTime());

        // send to executor
        ServiceManager.INSTANCE.findService(ProfileTaskExecutionService.class).addProfileTask(profileTask);
    }

}

public class ProfileTaskExecutionService implements BootService, TracingThreadListener {
	 // 缓存
 	 private final AtomicReference<ProfileTaskExecutionContext> taskExecutionContext = new AtomicReference<>();

     public void addProfileTask(ProfileTask task) {
        // update last command create time
        if (task.getCreateTime() > lastCommandCreateTime) {
            lastCommandCreateTime = task.getCreateTime();
        }

        // check profile task limit
        final CheckResult dataError = checkProfileTaskSuccess(task);
        if (!dataError.isSuccess()) {
            LOGGER.warn(
                "check command error, cannot process this profile task. reason: {}", dataError.getErrorReason());
            return;
        }

        // add task to list
        profileTaskList.add(task);

        // 在指定的startTime开始执行
        long timeToProcessMills = task.getStartTime() - System.currentTimeMillis();
        PROFILE_TASK_SCHEDULE.schedule(() -> processProfileTask(task), timeToProcessMills, TimeUnit.MILLISECONDS);
    }

    private synchronized void processProfileTask(ProfileTask task) {
        // make sure prev profile task already stopped
        stopCurrentProfileTask(taskExecutionContext.get());

        // make stop task schedule and task context
        final ProfileTaskExecutionContext currentStartedTaskContext = new ProfileTaskExecutionContext(task);
        taskExecutionContext.set(currentStartedTaskContext);

        // start profiling this task
        currentStartedTaskContext.startProfiling(PROFILE_EXECUTOR);

		// 在持续时间达到后取消线程运行
        PROFILE_TASK_SCHEDULE.schedule(
            () -> stopCurrentProfileTask(currentStartedTaskContext), task.getDuration(), TimeUnit.MINUTES);
    }

public class ProfileTaskExecutionContext {
	private final ProfileTask task;
	private volatile AtomicReferenceArray<ThreadProfiler> profilingSegmentSlots;

    public ProfileTaskExecutionContext(ProfileTask task) {
        this.task = task;
        profilingSegmentSlots = new AtomicReferenceArray<>(Config.Profile.MAX_PARALLEL);
    }

    public ProfileStatusReference attemptProfiling(TracingContext tracingContext,
                                                   String traceSegmentId,
                                                   String firstSpanOPName) {
        // check has available slot
        final int usingSlotCount = currentProfilingCount.get();
        if (usingSlotCount >= Config.Profile.MAX_PARALLEL) {
            return ProfileStatusReference.createWithNone();
        }

        // check first operation name matches
        if (!Objects.equals(task.getFirstSpanOPName(), firstSpanOPName)) {
            return ProfileStatusReference.createWithNone();
        }

        // if out limit started profiling count then stop add profiling
        if (totalStartedProfilingCount.get() > task.getMaxSamplingCount()) {
            return ProfileStatusReference.createWithNone();
        }

        // try to occupy slot
        if (!currentProfilingCount.compareAndSet(usingSlotCount, usingSlotCount + 1)) {
            return ProfileStatusReference.createWithNone();
        }

        final ThreadProfiler threadProfiler = new ThreadProfiler(
            tracingContext, traceSegmentId, Thread.currentThread(), this);
        int slotLength = profilingSegmentSlots.length();
        for (int slot = 0; slot < slotLength; slot++) {
            if (profilingSegmentSlots.compareAndSet(slot, null, threadProfiler)) {
                return threadProfiler.profilingStatus();
            }
        }
        return ProfileStatusReference.createWithNone();
    }
}

public class ProfileThread implements Runnable {
    public ProfileThread(ProfileTaskExecutionContext taskExecutionContext) {
        this.taskExecutionContext = taskExecutionContext;
        profileTaskExecutionService = ServiceManager.INSTANCE.findService(ProfileTaskExecutionService.class);
        profileTaskChannelService = ServiceManager.INSTANCE.findService(ProfileTaskChannelService.class);
    }

    @Override
    public void run() {
        try {
            profiling(taskExecutionContext);
        } catch (InterruptedException e) {
            // ignore interrupted
            // means current task has stopped
        } catch (Exception e) {
            LOGGER.error(e, "Profiling task fail. taskId:{}", taskExecutionContext.getTask().getTaskId());
        } finally {
            // finally stop current profiling task, tell execution service task has stop
            profileTaskExecutionService.stopCurrentProfileTask(taskExecutionContext);
        }

    }

    private void profiling(ProfileTaskExecutionContext executionContext) throws InterruptedException {

        int maxSleepPeriod = executionContext.getTask().getThreadDumpPeriod();

        // run loop when current thread still running
        long currentLoopStartTime = -1;
        while (!Thread.currentThread().isInterrupted()) {
            currentLoopStartTime = System.currentTimeMillis();

            // each all slot采集插槽,profilingSegmentSlots什么时候插入呢?
            //在agent拦截入口方法前(比如tomcat),new TracingContext时会插入slot到profilingSegmentSlots(通过Thread.currentThread()获取线程栈信息)
            AtomicReferenceArray<ThreadProfiler> profilers = executionContext.threadProfilerSlots();
            int profilerCount = profilers.length();
            for (int slot = 0; slot < profilerCount; slot++) {
                ThreadProfiler currentProfiler = profilers.get(slot);
                if (currentProfiler == null) {
                    continue;
                }

                switch (currentProfiler.profilingStatus().get()) {
                    case PENDING:
                        /**
                         if (System.currentTimeMillis() - tracingContext.createTime() > executionContext.getTask()
.getMinDurationThreshold()),更新状态为PROFILING
                        */
                        currentProfiler.startProfilingIfNeed();
                        break;

                    case PROFILING:
                        // 构建线程快照,然后往ProfileTaskChannelService中添加,这样就能被发送给OAP了
                        TracingThreadSnapshot snapshot = currentProfiler.buildSnapshot();
                        if (snapshot != null) {
                            profileTaskChannelService.addProfilingSnapshot(snapshot);
                        } else {
                            // tell execution context current tracing thread dump failed, stop it
                            executionContext.stopTracingProfile(currentProfiler.tracingContext());
                        }
                        break;

                }
            }

            // sleep to next period
            // if out of period, sleep one period
            long needToSleep = (currentLoopStartTime + maxSleepPeriod) - System.currentTimeMillis();
            needToSleep = needToSleep > 0 ? needToSleep : maxSleepPeriod;
            Thread.sleep(needToSleep);
        }
    }
 }
ProfileSnapshotSender
功能:发送线程快照给OAP
ConfigurationDiscoveryService
功能:定时拉取远端的配置,配置有变化的话交给对应的watcher处理。
步骤:
- 开启1个定时线程(默认20s),拉取OAP最新配置,OAP返回1个ConfigurationDiscoveryCommand交给CommandService。如果配置没有任何变化,那么ConfigurationDiscoveryCommand的UUID是一样的。
- CommandService最终会调用ConfigurationDiscoveryService#handleConfigurationDiscoveryCommand方法,根据uuid来判断是否有配置变化,如果无则直接返回,否则下一步
- 把ConfigurationDiscoveryCommand转成kv格式
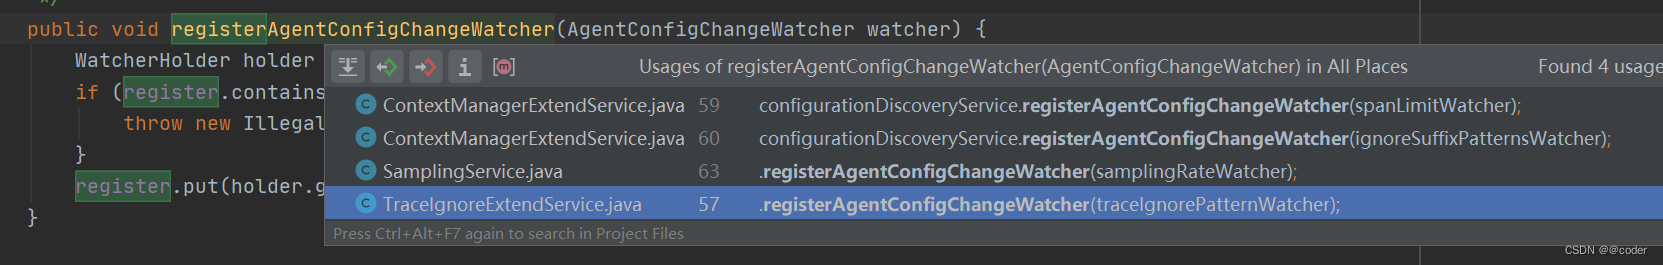
- 遍历所有的key,找到对这个key感兴趣的watcher,如果key值和watcher默认值不同,说明有变化,watcher更新默认值。其它服务可通过registerAgentConfigChangeWatcher方法注册watcher


 603
603


 被折叠的 条评论
为什么被折叠?
被折叠的 条评论
为什么被折叠?
 到【灌水乐园】发言


