


Linux下的Valgrind真是利器啊(不知道Valgrind的请自觉查看参考文献(1)(2)),帮我找出了不少C++中的内存管理错误,前一阵子还在纠结为什么VS 2013下运行良好的程序到了Linux下用g++编译运行却崩溃了,给出一堆汇编代码也看不懂。久久不得解过后,想想肯定是内存方面的错误,VS在这方面一般都不检查的,就算你的程序千疮百孔,各种内存泄露、内存管理错误,只要不影响运行,没有读到不该读的东西VS就不会告诉你(应该是VS内部没实现这个内存检测功能),因此用VS写出的程序可能不是完美或健壮的。
------------------------------------------------------------------------------------------------------------------------------
更新:感谢博客园好心网友@shines77的热心推荐,即VS中有内存泄漏检测工具插件VLD(Visual Leak Detector),需要下载安装,安装方法请看官方介绍,使用非常简单,在第一个入口文件里加上#include <vld.h>就可以了,检测报告在输出窗口中。我安装使用了下,不知道是安装错误还是什么,无论程序有无内存泄露,输出都是“No memory leaks detected.”
下面是我通过 Valgrind第一次检测得到的结果和一点点修改后得到的结果(还没改完,所以还有不少内存泄露问题……):
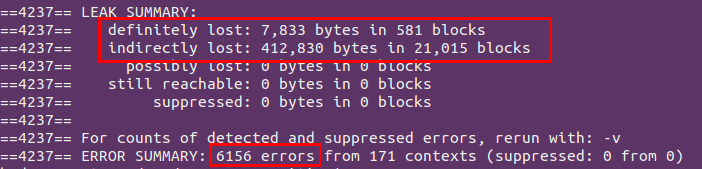
第一次检测结果:惨不忍睹,因为程序规模有些大。
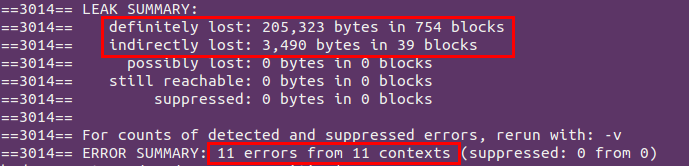
根据提示一点点修改过后,虽然还有个别错误和内存泄露问题,但还在修改中,至少已经能成功运行了……
真感谢Valgrind帮我成功找出了一堆内存问题,查找过程中也为自己犯的低级错误而感到羞愧,所以记录下来以便谨记。
1. 最多最低级的错误:不匹配地使用malloc/new/new[] 和 free/delete/delete[]
这样的错误主要源于我对C++的new/new[]、delete/delete[]机制不熟悉,凡是new/new[]分配内存的类型变量我一概用delete进行释放,或者有的变量用malloc进行分配,结果释放的时候却用delete,导致申请、释放很多地方不匹配,很多内存空间没能释放掉。为了维护方便,我后来一律使用new/new[]和delete/delete[],抛弃C中的malloc和free。
如果将用户new的类型分为基本数据类型和自定义数据类型两种,那么对于下面的操作相信大家都很熟悉,也没有任何问题。
(1)基本数据类型
一维指针:
- // 申请空间
- int *d = new int[5];
- // 释放空间
- delete[] d;
二维指针:
- // 申请空间
- int **d = new int*[5];
- for (int i = 0; i < 5; i++)
- d[i] = new int[10];
- // 释放空间
- for (int i = 0; i < 5; i++)
- delete[] d[i];
- delete[] d;
(2)自定义数据类型
比如下面这样一个类型:
- class DFA {
- bool is_mark;
- char *s;
- public:
- ~DFA() { printf("delete it.\n"); }
- };
一维指针:
- DFA *d = new DFA();
- delete d;
二维指针:
- // 申请空间
- DFA **d = new DFA*[5];
- for (int i = 0; i < 5; i++)
- d[i] = new DFA();
- // 释放空间
- for (int i = 0; i < 5; i++)
- delete d[i];
- delete[]d;
这没有任何问题,因为我们都是配套使用new/delete和new[]/delete[]的。这在Valgrind下检测也是完美通过的,但为什么要这配套使用呢?原理是什么?
虽然深究这些东西好像没什么实际意义,但对于想深入了解C++内部机制或像我一样老是释放出错导致大量内存泄露的小白程序员还是值得研究的,至少知道了为什么,以后就不会犯现在的低级错误。
参考文献(3)是这样描述的:
通常状况下,编译器在new的时候会返回用户申请的内存空间大小,但是实际上,编译器会分配更大的空间,目的就是在delete的时候能够准确的释放这段空间
这段空间在用户取得的指针之前以及用户空间末尾之后存放。

实际上:blockSize = sizeof(_CrtMemBlockHeader) + nSize + nNoMansLandSize; 其中,blockSize 是系统所分配的实际空间大小,
_CrtMemBlockHeader是new的头部信息,其中包含用户申请的空间大小等其他一些信息。 nNoMansLandSize是尾部的越界校验大小,
一般是4个字节“FEFEFEFE”,如果用户越界写入这段空间,则校验的时候会assert。nSize才是为我们分配的真正可用的内存空间。

用户new的时候分为两种情况
A. new的是基础数据类型或者是没有自定义析构函数的结构
B. new的是有自定义析构函数的结构体或类

这两者的区别是如果有用户自定义的析构函数,则delete的时候必须要调用析构函数,那么编译器delete时如何知道要调用多少个对象的析构函数呢,
答案就是new的时候,如果是情况B,则编译器会在new头部之后,用户获得的指针之前多分配4个字节的空间用来记录new的时候的数组大小,
这样delete的时候就可以取到个数并正确的调用。
这段描述可能有些晦涩难懂,参考文献(4)给了更加详细的解释,一点即通。这样的解释其实也隐含着一个推论:如果new的是基本数据类型或者是没有自定义析构函数的结构,那么这种情况下编译器不会在用户获得的指针之前多分配4个字节,因为这时候delete时不用调用析构函数,也就是不用知道数组个数的大小(因为只有调用析构函数时才需要知道要调用多少个析构函数,也就是数组的大小),而是直接传入数组的起始地址从而释放掉这块内存空间,此时delete与delete[]是等价的。
因此下面的释放操作也是正确的:
- // 申请空间
- int *d = new int[5];
- // 释放空间
- delete d;
将其放在Valgrind下进行检测,结果如下:
==2955== Memcheck, a memory error detector
==2955== Copyright (C) 2002-2012, and GNU GPL'd, by Julian Seward et al.
==2955== Using Valgrind-3.8.1 and LibVEX; rerun with -h for copyright info
==2955== Command: ./test_int
==2955==
==2955== Mismatched free() / delete / delete []
==2955==    at 0x402ACFC: operator delete(void*) (in /usr/lib/valgrind/vgpreload_memcheck-x86-linux.so)
==2955==    by 0x8048530: main (in /home/hadoop/test/test_int)
==2955==  Address 0x434a028 is 0 bytes inside a block of size 20 alloc'd
==2955==    at 0x402B774: operator new[](unsigned int) (in /usr/lib/valgrind/vgpreload_memcheck-x86-linux.so)
==2955==    by 0x8048520: main (in /home/hadoop/test/test_int)
==2955==
==2955==
==2955== HEAP SUMMARY:
==2955==     in use at exit: 0 bytes in 0 blocks
==2955==   total heap usage: 1 allocs, 1 frees, 20 bytes allocated
==2955==
==2955== All heap blocks were freed -- no leaks are possible
==2955==
==2955== For counts of detected and suppressed errors, rerun with: -v
==2955== ERROR SUMMARY: 1 errors from 1 contexts (suppressed: 0 from 0)
首先从“All heap blocks were freed -- no leaks are possible”可以看出上面的释放操作的确是正确的,而不是有些人认为的delete d;只会释放d[]的第一个元素的空间,后面的都不会得到释放。但是从“Mismatched free() / delete / delete []”知道Valgrind实际上是不允许这样操作的,虽然没有内存泄露问题,但是new[]与delete不匹配,这样的编程风格不经意间就容易犯低级错误,所以Valgrind报错了,但是我想Valgrind内部实现应该不会考虑的这么复杂,它就检查new是否与delete配对,new[]是否与delete[]配对,而不管有时候new[]与delete配对也不会出现问题的。
综上所述,给我的经验就是:在某些情况下,new[]分配的内存用delete不会出错,但是大多情况下会产生严重的内存问题,所以一定要养成将new和delete,new[]和delete[]配套使用的良好编程习惯。
2. 最看不懂的错误:一堆看不懂的Invalid read/write错误(更新:已解决)
比如下面这样一个程序:
- #include <stdio.h>
- #include <string.h>
- #include <stdlib.h>
- struct accept_pair {
- bool is_accept_state;
- bool is_strict_end;
- char app_name[0];
- };
- int main() {
- char *s = "Alexia";
- accept_pair *ap = (accept_pair*)malloc(sizeof(accept_pair) + sizeof(s));
- strcpy(ap->app_name, s);
- printf("app name: %s\n", ap->app_name);
- free(ap);
- return 0;
- }
首先对该程序做个扼要的说明:
这里结构体里定义零长数组的原因在于我的需求:我在其它地方要用到很大的accept_pair数组,其中只有个别accept_pair元素中的app_name是有效的(取决于某些值的判断,如果为true才给app_name赋值,如果为false则app_name无意义,为空),因此若是char app_name[20],那么大部分accept_pair元素都浪费了这20个字节的空间,所以我在这里先一个字节都不分配,到时谁需要就给谁分配,遵循“按需分配”的古老思想。可能有人会想,用char *app_name也可以啊,同样能实现按需分配,是的,只是多4个字节而已,属于替补方法。
在g++下经过测试,没有什么问题,能够正确运行,但用Valgrind检测时却报出了一些错误,不是内存泄露问题,而是内存读写错误:
==3511== Memcheck, a memory error detector
==3511== Copyright (C) 2002-2012, and GNU GPL'd, by Julian Seward et al.
==3511== Using Valgrind-3.8.1 and LibVEX; rerun with -h for copyright info
==3511== Command: ./zero
==3511==
==3511== Invalid write of size 1
==3511==    at 0x402CD8B: strcpy (in /usr/lib/valgrind/vgpreload_memcheck-x86-linux.so)
==3511==    by 0x80484E3: main (in /home/hadoop/test/zero)
==3511==  Address 0x420002e is 0 bytes after a block of size 6 alloc'd
==3511==    at 0x402C418: malloc (in /usr/lib/valgrind/vgpreload_memcheck-x86-linux.so)
==3511==    by 0x80484C8: main (in /home/hadoop/test/zero)
==3511==
==3511== Invalid write of size 1
==3511==    at 0x402CDA5: strcpy (in /usr/lib/valgrind/vgpreload_memcheck-x86-linux.so)
==3511==    by 0x80484E3: main (in /home/hadoop/test/zero)
==3511==  Address 0x4200030 is 2 bytes after a block of size 6 alloc'd
==3511==    at 0x402C418: malloc (in /usr/lib/valgrind/vgpreload_memcheck-x86-linux.so)
==3511==    by 0x80484C8: main (in /home/hadoop/test/zero)
==3511==
==3511== Invalid read of size 1
==3511==    at 0x40936A5: vfprintf (vfprintf.c:1655)
==3511==    by 0x409881E: printf (printf.c:34)
==3511==    by 0x4063934: (below main) (libc-start.c:260)
==3511==  Address 0x420002e is 0 bytes after a block of size 6 alloc'd
==3511==    at 0x402C418: malloc (in /usr/lib/valgrind/vgpreload_memcheck-x86-linux.so)
==3511==    by 0x80484C8: main (in /home/hadoop/test/zero)
==3511==
==3511== Invalid read of size 1
==3511==    at 0x40BC3C0: _IO_file_xsputn@@GLIBC_2.1 (fileops.c:1311)
==3511==    by 0x4092184: vfprintf (vfprintf.c:1655)
==3511==    by 0x409881E: printf (printf.c:34)
==3511==    by 0x4063934: (below main) (libc-start.c:260)
==3511==  Address 0x420002f is 1 bytes after a block of size 6 alloc'd
==3511==    at 0x402C418: malloc (in /usr/lib/valgrind/vgpreload_memcheck-x86-linux.so)
==3511==    by 0x80484C8: main (in /home/hadoop/test/zero)
==3511==
==3511== Invalid read of size 1
==3511==    at 0x40BC3D7: _IO_file_xsputn@@GLIBC_2.1 (fileops.c:1311)
==3511==    by 0x4092184: vfprintf (vfprintf.c:1655)
==3511==    by 0x409881E: printf (printf.c:34)
==3511==    by 0x4063934: (below main) (libc-start.c:260)
==3511==  Address 0x420002e is 0 bytes after a block of size 6 alloc'd
==3511==    at 0x402C418: malloc (in /usr/lib/valgrind/vgpreload_memcheck-x86-linux.so)
==3511==    by 0x80484C8: main (in /home/hadoop/test/zero)
==3511==
==3511== Invalid read of size 4
==3511==    at 0x40C999C: __GI_mempcpy (mempcpy.S:59)
==3511==    by 0x40BC310: _IO_file_xsputn@@GLIBC_2.1 (fileops.c:1329)
==3511==    by 0x4092184: vfprintf (vfprintf.c:1655)
==3511==    by 0x409881E: printf (printf.c:34)
==3511==    by 0x4063934: (below main) (libc-start.c:260)
==3511==  Address 0x420002c is 4 bytes inside a block of size 6 alloc'd
==3511==    at 0x402C418: malloc (in /usr/lib/valgrind/vgpreload_memcheck-x86-linux.so)
==3511==    by 0x80484C8: main (in /home/hadoop/test/zero)
==3511==
app name: Alexia
==3511==
==3511== HEAP SUMMARY:
==3511==     in use at exit: 0 bytes in 0 blocks
==3511==   total heap usage: 1 allocs, 1 frees, 6 bytes allocated
==3511==
==3511== All heap blocks were freed -- no leaks are possible
==3511==
==3511== For counts of detected and suppressed errors, rerun with: -v
==3511== ERROR SUMMARY: 9 errors from 6 contexts (suppressed: 0 from 0)
从检测报告可以看出:
strcpy(ap->app_name, s);这句是内存写错误,printf("app name: %s\n", ap->app_name);这句是内存读错误,两者都说明Valgrind认为ap->app_name所处内存空间是不合法的,可是我明明已经为其分配了内存空间,只是没有注明这段空间就是给它用的,难道结构体中零长数组char app_name[0]是不能写入值的吗?还是我对零长数组的使用有误?至今仍不得解,求大神解答……
------------------------------------------------------------------------------------------------------------------------------
更新:谢谢博客园网友@shines77的好心指正,这里犯了个超级低级的错误,就是忘了main中s是char*的,因此sizeof(s)=4或8(64位机),因此accept_pair *ap = (accept_pair*)malloc(sizeof(accept_pair) + sizeof(s));这句并没有为app_name申请足够的空间,当然就会出现Invalid read/write了。这个低级错误真是。。。后来想了下,是自己在项目中直接拷贝过来的这句,项目中的s不是char*的,拷贝过来忘了改成accept_pair *ap = (accept_pair*)malloc(sizeof(accept_pair) + strlen(s) + 1);了,以后还是细心的好,真是浪费自己时间也浪费大家时间了。
3. 最不明所以的内存泄露:definitely lost/indefinitely lost(更新:已解决)
请看下面这样一个程序:
- #include <stdio.h>
- #include <string.h>
- class accept_pair {
- public:
- bool is_accept_state;
- bool is_strict_end;
- char *app_name;
- public:
- accept_pair(bool is_accept = false, bool is_end = false);
- ~accept_pair();
- };
- class DFA {
- public:
- unsigned int _size;
- accept_pair **accept_states;
- public:
- DFA(int size);
- ~DFA();
- void add_state(int index, char *s);
- void add_size(int size);
- };
- int main() {
- char *s = "Alexia";
- DFA *dfa = new DFA(3);
- dfa->add_state(0, s);
- dfa->add_state(1, s);
- dfa->add_state(2, s);
- dfa->add_size(2);
- dfa->add_state(3, s);
- dfa->add_state(4, s);
- printf("\napp_name: %s\n", dfa->accept_states[4]->app_name);
- printf("size: %d\n\n", dfa->_size);
- delete dfa;
- return 0;
- }
- accept_pair::accept_pair(bool is_accept, bool is_end) {
- is_accept_state = is_accept;
- is_strict_end = is_end;
- app_name = NULL;
- }
- accept_pair::~accept_pair() {
- if (app_name) {
- printf("delete accept_pair.\n");
- delete[] app_name;
- }
- }
- DFA::DFA(int size) {
- _size = size;
- accept_states = new accept_pair*[_size];
- for (int s = 0; s < _size; s++) {
- accept_states[s] = NULL;
- }
- }
- DFA::~DFA() {
- for (int i = 0; i < _size; i++) {
- if (accept_states[i]) {
- printf("delete dfa.\n");
- delete accept_states[i];
- accept_states[i] = NULL;
- }
- }
- delete[] accept_states;
- }
- void DFA::add_state(int index, char *s) {
- accept_states[index] = new accept_pair(true, true);
- accept_states[index]->app_name = new char[strlen(s) + 1];
- memcpy(accept_states[index]->app_name, s, strlen(s) + 1);
- }
- void DFA::add_size(int size) {
- // reallocate memory for accept_states.
- accept_pair **tmp_states = new accept_pair*[size + _size];
- for (int s = 0; s < size + _size; s++)
- tmp_states[s] = new accept_pair(false, false);
- for (int s = 0; s < _size; s++) {
- tmp_states[s]->is_accept_state = accept_states[s]->is_accept_state;
- tmp_states[s]->is_strict_end = accept_states[s]->is_strict_end;
- if (accept_states[s]->app_name != NULL) {
- tmp_states[s]->app_name = new char[strlen(accept_states[s]->app_name) + 1];
- memcpy(tmp_states[s]->app_name, accept_states[s]->app_name, strlen(accept_states[s]->app_name) + 1);
- }
- }
- // free old memory.
- for (int s = 0; s < _size; s++) {
- if (accept_states[s] != NULL) {
- delete accept_states[s];
- accept_states[s] = NULL;
- }
- }
- _size += size;
- delete []accept_states;
- accept_states = tmp_states;
- }
虽然有点长,但逻辑很简单,其中add_size()首先分配一个更大的accept_pair数组,将已有的数据全部拷贝进去,然后释放掉原来的accept_pair数组所占空间,最后将旧的数组指针指向新分配的内存空间。这是个demo程序,在我看来这段程序是没有任何内存泄露问题的,因为申请的所有内存空间最后都会在DFA析构函数中得到释放。但是Valgrind的检测报告却报出了1个内存泄露问题(红色的是程序输出):
==3093== Memcheck, a memory error detector
==3093== Copyright (C) 2002-2012, and GNU GPL'd, by Julian Seward et al.
==3093== Using Valgrind-3.8.1 and LibVEX; rerun with -h for copyright info
==3093== Command: ./test
==3093==
delete accept_pair.
delete accept_pair.
delete accept_pair.

app_name: Alexia
size: 5

delete dfa.
delete accept_pair.
delete dfa.
delete accept_pair.
delete dfa.
delete accept_pair.
delete dfa.
delete accept_pair.
delete dfa.
delete accept_pair.
==3093==
==3093== HEAP SUMMARY:
==3093==     in use at exit: 16 bytes in 2 blocks
==3093==   total heap usage: 21 allocs, 19 frees, 176 bytes allocated
==3093==
==3093== 16 bytes in 2 blocks are definitely lost in loss record 1 of 1
==3093==    at 0x402BE94: operator new(unsigned int) (in /usr/lib/valgrind/vgpreload_memcheck-x86-linux.so)
==3093==    by 0x8048A71: DFA::add_size(int) (in /home/hadoop/test/test)
==3093==    by 0x8048798: main (in /home/hadoop/test/test)
==3093==
==3093== LEAK SUMMARY:
==3093==    definitely lost: 16 bytes in 2 blocks
==3093==    indirectly lost: 0 bytes in 0 blocks
==3093==      possibly lost: 0 bytes in 0 blocks
==3093==    still reachable: 0 bytes in 0 blocks
==3093==         suppressed: 0 bytes in 0 blocks
==3093==
==3093== For counts of detected and suppressed errors, rerun with: -v
==3093== ERROR SUMMARY: 1 errors from 1 contexts (suppressed: 0 from 0)
说明add_size()这个函数里存在用new申请的内存空间没有得到释放,这一点感觉很费解,开始以为tmp_states指针所指向的数据赋给accept_states后没有及时释放导致的,于是我最后加了句delete tmp_states;结果招致更多的错误。相信不是Valgrind误报,说明我对C++的new和delete机制还是不明不白,一些于我而言不明所以的内存泄露问题真心不得解,希望有人能够告诉我是哪里的问题?
------------------------------------------------------------------------------------------------------------------------------
更新:谢谢博客园好心网友@NewClear的解惑。这里的确有泄露问题,下面是他的解答:
第3个问题,是有两个泄露
DFA::add_state里面直接
accept_states[index] = new accept_pair(true, true);
如果原来的accept_states[index]不为NULL就泄露了
而在DFA::add_size里面,
for (int s = 0; s < size + _size; s++)
            tmp_states[s] = new accept_pair(false, false);
对新分配的tmp_states的每一个元素都new了一个新的accept_pair
所以在main函数里面dfa->add_size(2);以后,总共有5个成员,而且5个都不为NULL
之后
dfa->add_state(3, s);
dfa->add_state(4, s);
结果就导致了index为3和4的原先的对象泄露了
你的系统是32位的,所以一个accept_pair大小是8byte,两个对象就是16byte
解决方案也很简单,修改add_size函数,重新申请空间时仅为已有的accept_pair数据申请空间,其它的初始化为NULL,这样在需要时才在add_state里面申请空间,也就是修改add_size函数如下:
- void DFA::add_size(int size) {
- // reallocate memory for accept_states.
- accept_pair **tmp_states = new accept_pair*[size + _size];
- for (int s = 0; s < size + _size; s++)
- tmp_states[s] = NULL;
- for (int s = 0; s < _size; s++) {
- tmp_states[s] = new accept_pair(false, false);
- tmp_states[s]->is_accept_state = accept_states[s]->is_accept_state;
- tmp_states[s]->is_strict_end = accept_states[s]->is_strict_end;
- if (accept_states[s]->app_name != NULL) {
- tmp_states[s]->app_name = new char[strlen(accept_states[s]->app_name) + 1];
- memcpy(tmp_states[s]->app_name, accept_states[s]->app_name, strlen(accept_states[s]->app_name) + 1);
- }
- }
- // free old memory.
- for (int s = 0; s < _size; s++) {
- if (accept_states[s] != NULL) {
- delete accept_states[s];
- accept_states[s] = NULL;
- }
- }
- _size += size;
- delete[]accept_states;
- accept_states = tmp_states;
- }
4. 参考文献
(1) 如何使用Valgrind memcheck工具进行C/C++的内存泄漏检测 如何使用Valgrind memcheck工具进行C/C++的内存泄漏检测
如何使用Valgrind memcheck工具进行C/C++的内存泄漏检测
英文原文:How to Detect Memory Leaks Using Valgrind memcheck Tool for C / C++


我们的翻译工作遵照 CC 协议,如果我们的工作有侵犯到您的权益,请及时联系我们


 511
511


 被折叠的 条评论
为什么被折叠?
被折叠的 条评论
为什么被折叠?
 到【灌水乐园】发言


