


一:环境准备
准备可用的两台centos7服务器:
服务器一(看板服务器)ip:119.1.1.1
服务器二(被监控的服务器)ip:119.1.1.2
备注:也可只准备一台服务器,将看板服务器和监控服务器放在一台服务器上
二:grafana和prometheus登录地址:
grafana登录地址:http://119.1.1.1:3000
prometheus登录地址:http://119.1.1.1:9090/targets
三:安装grafana(服务器ip:119.1.1.1)
1:新建grafana目录:
[root@prometheus src]#mkdir grafana
2:进入grafana目录:`
[root@prometheus src]#cd grafana
3:下载:
[root@prometheus src]#wget https://dl.grafana.com/oss/release/grafana-7.3.7-1.x86_64.rpm
4:安装(如服务器没有yun需先安装yun):
[root@prometheus src]#yum localinstall grafana-7.3.7-1.x86_64.rpm
5:查看是否安装成功:
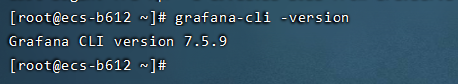
[root@prometheus src]#grafana-cli -version
如成功出现如下界面:
6:设置开机启动
[root@prometheus src]# systemctl enable grafana-server
[root@prometheus src]# systemctl start grafana-server
- 设置iptables
[root@prometheus src]# vi /etc/sysconfig/iptables
-A INPUT -p tcp -m state --state NEW -m tcp --dport 3000 -j ACCEPT
[root@prometheus src]# service iptables restart
8.远程登陆
浏览器访问:http://119.1.1.1:3000/login,默认账号/密码:admin/admin(如访问不了需把服务器的防火墙关闭,再确定3000端口是否开放)
出现如下界面则安装成功:

四:安装prometheus(服务器ip:119.1.1.1)
1:新建目录prometheus:
[root@prometheus src]#mkdir prometheus
2:进入目录
[root@prometheus src]#cd prometheus
3:下载:
[root@prometheus src]#wget https://github.com/prometheus/prometheus/releases/download/v2.20.1/prometheus-2.20.1.linux-amd64.tar.gz
5:解压:
[root@prometheus src]#tar -zxf prometheus-2.20.1.linux-amd64.tar.gz(解压后路径:/usr/zzbtest/grafana/prometheus/prometheus-2.20.1.linux-amd64)
6:进入解压目录
[root@prometheus src]#cd prometheus-2.20.1.linux-amd64
7:修改prometheus.yml配置并保存:
global:
  # 默认情况下,每15s拉取一次目标采样点数据。
  scrape_interval:     15s
  external_labels:
    monitor: 'codelab-monitor'
scrape_configs:
  - job_name: 'prometheus'
    scrape_interval: 5s    # 拉取时间间隔5s
    static_configs:
      - targets: ['119.1.1.1:9090']#修改为prometheus安装服务器,9090为prometheus端口号
8:进入prometheus.yml文件存放目录:
如第一次启动:
[root@prometheus src]#./prometheus --config.file=prometheus.yml
如之前启动成功过,直接后台启动:
[root@prometheus src]#nohup ./prometheus --config.file=prometheus.yml --web.enable-admin-api &
注意:之前启动过,重启需要杀掉之前的进程,步骤如下:
查找进程:
[root@prometheus src]#ps -ef | grep prometheus
杀掉进程:
[root@prometheus src]#kill -9 进程号
9:浏览器访问:http://119.1.1.1:9090/targets
五:安装node_exporter 采集器(服务器ip:119.1.1.2 )
1:创建文件夹:
[root@prometheus src]#mkdir node_exporter
2:进入文件夹:
[root@prometheus src]#cd node_exporter
3:下载文件:
[root@prometheus src]#wget https://github.com/prometheus/node_exporter/releases/download/v1.0.1/node_exporter-1.0.1.linux-amd64.tar.gz
4:解压文件:
[root@prometheus src]#sudo tar -zxf node_exporter-1.0.1.linux-amd64.tar.gz
5:进入解压目录:
[root@prometheus src]#cd node_exporter-1.0.1.linux-amd64
6:进入/node_exporter-1.0.1.linux-amd64目录启动node_exporter:
第一次建议调试启动:
[root@prometheus src]#./node_exporter

如启动成功,直接后台启动:
[root@prometheus src]#nohup ./node_exporter --web.listen-address=":9200" &
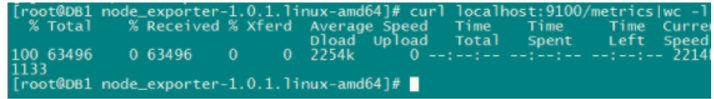
7:查看是否启动成功:被监听的服务器:
[root@prometheus src]#curl localhost:9200/metrics|wc -l
8:进入119.1.1.1服务器,修改prometheus.yml配置并保存
global:
  # 默认情况下,每15s拉取一次目标采样点数据。
  scrape_interval:     15s
  external_labels:
    monitor: 'codelab-monitor'
scrape_configs:
  - job_name: 'prometheus'
    scrape_interval: 5s    # 拉取时间间隔5s
    static_configs:
      - targets: ['119.1.1.1:9090']#修改为prometheus安装服务器,9090为prometheus端口号
#安装node_exporter修改如下内容
  - job_name: '119.1.1.2服务器'
    scrape_interval: 5s
    static_configs:
      - targets: ['119.1.1.2:9200']#后面node_exporter安装后需配置该内容
9:重启prometheus:
```bash
[root@prometheus src]#nohup ./prometheus --config.file=prometheus.yml --web.enable-admin-api &
注意:之前启动过,重启需要杀掉之前的进程,步骤如下:
查找进程:
[root@prometheus src]#ps -ef | grep prometheus
杀掉进程:
[root@prometheus src]#kill -9 进程号
10:浏览器访问:http://119.1.1.1:9090/targets
up状态:成功
down状态:失败
失败需检查node_exporter进程是否存在,对应的9200端口是否开放

六:grafana配置prometheus数据源
1:浏览器:http://119.1.1.1:3000 进入图形界面,默认账户密码:admin/admin

2:配置 Grafana 添加 Prometheus 数据源

3:然后点击 add data source,点击prometheus

4:输入好 prometheus 的服务端地址和端口

5:然后点击完成,查看信息是否成功

七:grafana配置node_exporter看板

1:去官网:https://grafana.com/grafana/dashboards

可以筛选

2:如果可以联网,就可以用 ID 来导入,如果服务器网络不好或没有外网就可以下载json(默认使用8919模板)

3:然后点击manage里面import,点击load:

最后,起个名字,然后选择好数据源,点击也没下方的 蓝色 import 按钮

最终,仪表盘导入成功


 3412
3412


 被折叠的 条评论
为什么被折叠?
被折叠的 条评论
为什么被折叠?
 到【灌水乐园】发言


