


在实际项目开发中,尤其是报表开发经常要用来热点图片
JAVA的开源项目JfreeChart提供了热点生成图片的方法
这里介绍几种方法
第一在JSP页面中:

 <%
...
@ page language="java" pageEncoding="UTF-8"
%>
<%
...
@ include file="/WEB-INF/jsp/include.jsp"
%>
<%
...
@ page import="org.jfree.data.general.DefaultPieDataset"
%>
<%
...
@ page import="org.jfree.chart.*"
%>
<%
...
@ page import="org.jfree.chart.plot.*"
%>
<%
...
@ page import="org.jfree.chart.servlet.ServletUtilities"
%>
<%
...
@ page import="org.jfree.chart.urls.StandardPieURLGenerator"
%>
<%
...
@ page import="org.jfree.chart.entity.StandardEntityCollection"
%>
<%
...
@ page import="java.io.*"
%>
<%
...
@ page language="java" pageEncoding="UTF-8"
%>
<%
...
@ include file="/WEB-INF/jsp/include.jsp"
%>
<%
...
@ page import="org.jfree.data.general.DefaultPieDataset"
%>
<%
...
@ page import="org.jfree.chart.*"
%>
<%
...
@ page import="org.jfree.chart.plot.*"
%>
<%
...
@ page import="org.jfree.chart.servlet.ServletUtilities"
%>
<%
...
@ page import="org.jfree.chart.urls.StandardPieURLGenerator"
%>
<%
...
@ page import="org.jfree.chart.entity.StandardEntityCollection"
%>
<%
...
@ page import="java.io.*"
%>
 <
HTML
>
<
HEAD
>
<
META
http-equiv
=Content-Type
content
="text/html; charset=utf-8"
>
<
TITLE
>
JfreeChart
</
TITLE
>
</
HEAD
>
<
BODY
>
<%
...
<
HTML
>
<
HEAD
>
<
META
http-equiv
=Content-Type
content
="text/html; charset=utf-8"
>
<
TITLE
>
JfreeChart
</
TITLE
>
</
HEAD
>
<
BODY
>
<%
...
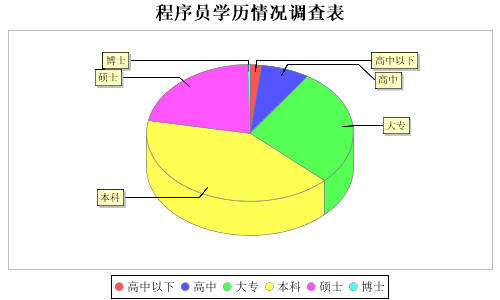
 DefaultPieDataset data = new DefaultPieDataset(); data.setValue("高中以下",370); data.setValue("高中",1530); data.setValue("大专",5700); data.setValue("本科",8280); data.setValue("硕士",4420); data.setValue("博士",80); PiePlot3D plot = new PiePlot3D(data);//3D饼图 plot.setURLGenerator(new StandardPieURLGenerator("barview.jsp","lion"));//设定链接 JFreeChart chart = new JFreeChart("",JFreeChart.DEFAULT_TITLE_FONT, plot, true); chart.setBackgroundPaint(java.awt.Color.white);//可选,设置图片背景色 chart.setTitle("程序员学历情况调查表");//可选,设置图片标题 StandardEntityCollection sec = new StandardEntityCollection(); ChartRenderingInfo info = new ChartRenderingInfo(sec); PrintWriter w = new PrintWriter(out);//输出MAP信息 //500是图片长度,300是图片高度 String filename = ServletUtilities.saveChartAsPNG(chart, 500, 300, info, session); ChartUtilities.writeImageMap(w, "map0", info, false);
  String graphURL = request.getContextPath() + "/servletDisplayChart?filename=" + filename;
%>
<
P
ALIGN
="CENTER"
>
<
img
src
="<%= graphURL %>"
width
=500
height
=300
border
=0
usemap
="#map0"
>
</
P
>
</
BODY
>
</
HTML
>
String graphURL = request.getContextPath() + "/servletDisplayChart?filename=" + filename;
%>
<
P
ALIGN
="CENTER"
>
<
img
src
="<%= graphURL %>"
width
=500
height
=300
border
=0
usemap
="#map0"
>
</
P
>
</
BODY
>
</
HTML
>
相应的web.xml加入如下配置
<
servlet
>
<
servlet-name
>
DisplayChart
</
servlet-name
>
<
servlet-class
>
org.jfree.chart.servlet.DisplayChart
</
servlet-class
>
</
servlet
>
<
servlet-mapping
>
<
servlet-name
>
DisplayChart
</
servlet-name
>
<
url-pattern
>
/servletDisplayChart
</
url-pattern
>
</
servlet-mapping
>
生成的图片如下
该方法引用网站:http://dev.yesky.com/307/2036307.shtml
第二种方法
把java代码写在jsp页面中在大的工程维护起来极不方便,我所用的项目采用Struts框架做表现层
这里我就介绍我所用的方法
java文件:
public
class
ImageAction
extends
Action
...
{ public ActionForward execute(ActionMapping mapping, ActionForm form,
 HttpServletRequest request, HttpServletResponse response) ...{ ImageForm image = (ImageForm)form; int width=0, height=0; JFreeChart chart = null; width = 248; height = 240; chart = createEventShareImage(); try ...{ StandardEntityCollection sec = new StandardEntityCollection(); ChartRenderingInfo info = new ChartRenderingInfo(sec); String filename = ServletUtilities.saveChartAsJPEG(chart, width, 240, info, request.getSession()); String mapMessage = ChartUtilities.getImageMap("map0", info); String src = request.getContextPath()+"/servletDisplayChart?filename=" + filename ; String useMap = "#" + filename ; } catch (IOException e) ...{ e.printStackTrace();
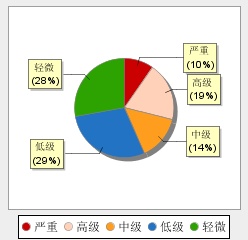
 } image.setMap(mapMessage); image.setSrc(src) ; image.setUseMap(useMap) ; return mapping.getInputForward(); } private JFreeChart createEventShareImage() ...{ Object[] share = eventCommonService.getEventShare(); DefaultPieDataset pieDataset = new DefaultPieDataset(); pieDataset.setValue("严重", new Long("100")); pieDataset.setValue("高级", new Long("200")); pieDataset.setValue("中级", new Long("150")); pieDataset.setValue("低级", new Long("300")); pieDataset.setValue("轻微", new Long("288")); PiePlot plot = new PiePlot(pieDataset); plot.setNoDataMessage("No data available"); plot.setSectionPaint("严重", Constant.TERRIBLE_COLOR); plot.setSectionPaint("高级", Constant.HIGH_COLOR); plot.setSectionPaint("中级", Constant.MIDDLE_COLOR); plot.setSectionPaint("低级", Constant.LOW_COLOR); plot.setSectionPaint("轻微", Constant.INFO_COLOR); plot.setLabelGenerator(new StandardPieSectionLabelGenerator("{0} ({2})")); plot.setURLGenerator(new StandardPieURLGenerator("eventImage.do","type","id")); JFreeChart chart = new JFreeChart("",JFreeChart.DEFAULT_TITLE_FONT, plot, true); return chart; }
jsp页面:
<
bean:write
name
="imageForm"
property
="mapMessage"
filter
="false"
/>
<
img
src
="<bean:write name="
imageForm" property
="src"
/>
" usemap="
<
bean:write
name
="imageForm"
property
="useMap"
/>
"/>
xml的配置和上面一样
生成图片:


 3196
3196

 被折叠的 条评论
为什么被折叠?
被折叠的 条评论
为什么被折叠?
 到【灌水乐园】发言


