


前言
需要准备环境
python 3.9
pycharm 2021
模块使用
re, csv – 内部模块,不需要安装
requests, bs4, pandas, matplotlib
– 第三方库,win + R 输入cmd 打开命令窗口 输入安装命令 pip install 模块名
分析网站
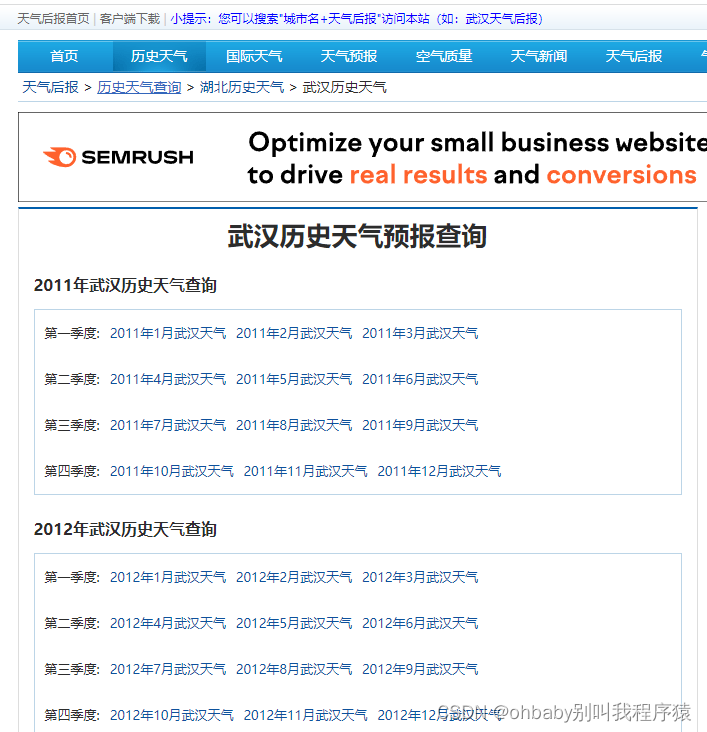
点击任意城市,因为我在武汉,这里以武汉举例,能够看到武汉每个月份的历史天气情况链接
我们以2011年1月份举例,打开之后能够看到每天的天气情况
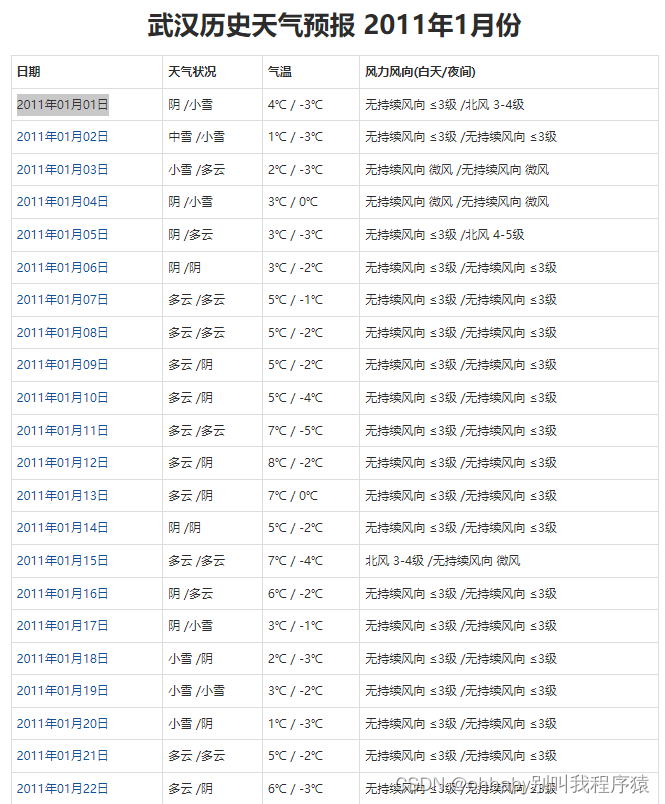
先确定我们要爬取的数据,对于每一天,我们爬取它的日期,以及最高温和最低温
这时我们可以在当前页面通过
F12 或者 右键+检查 打开开发者工具
也就是下面这个东西,跟控制台一样的
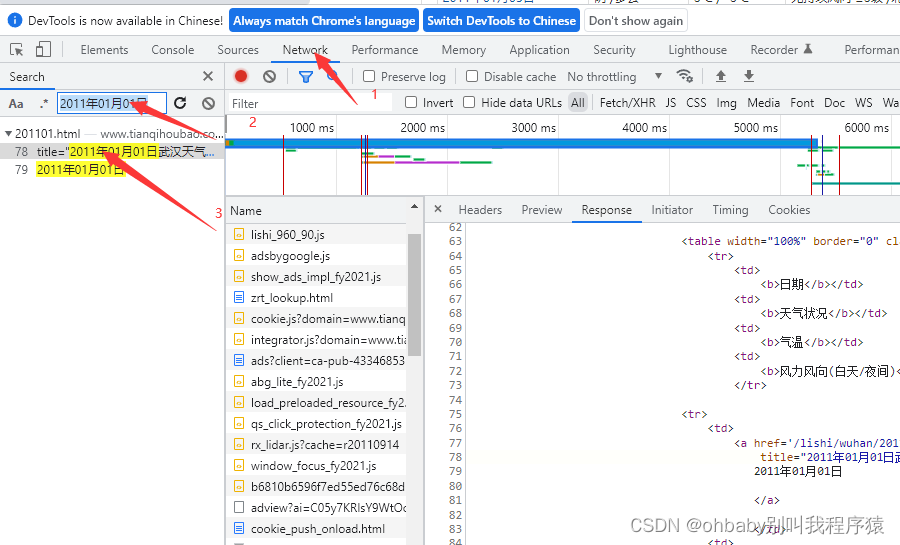
按照图片中的步骤,先进入network模块,然后复制我们网页中的某一条数据搜索,能够找到我们的网页源码的资源位置
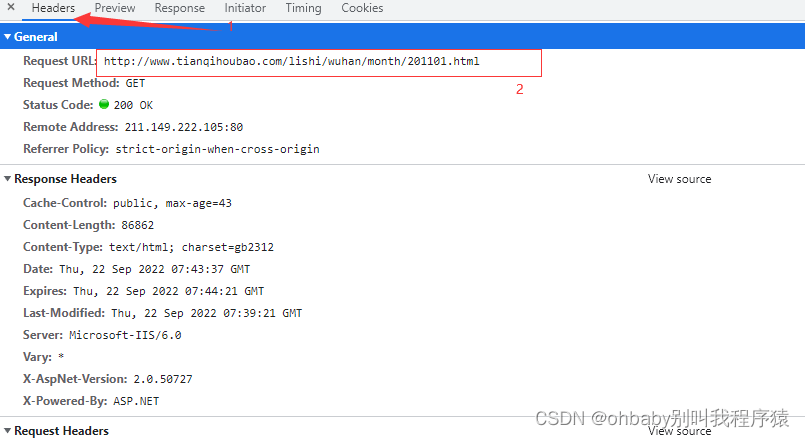
然后我们可以直接在headers里拿到我们需要的请求地址
下面可以开始编辑我们的源码
爬取数据
首先导入模块
import csv
import re
from bs4 import BeautifulSoup
import requests
然后打开文件,并创建一个csv的对象
f = open('data.csv', mode='a', encoding='utf-8', newline='')
csv_writer = csv.writer(f)
先写入表头
csv_writer.writerow([
    '日期',
    '最高气温',
    '最低气温'
])
然后去网页中拿取请求头
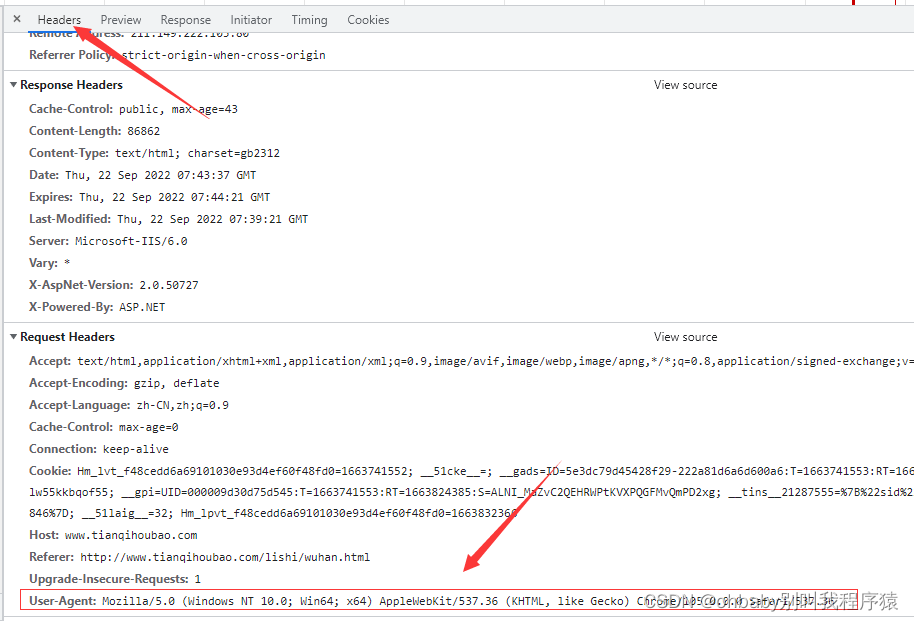
还是在之前的headers下面,还有我们拿取的请求地址
headers = {
    'User-Agent': '请求头信息'
}

url = 'http://www.tianqihoubao.com/lishi/wuhan/month/201101.html'
然后发送请求
response = requests.get(url=url, headers=headers)
使用bs4创建一个BeautifulSoup对象
soup = BeautifulSoup(response.text, 'lxml')
然后对拿取的网页源码做分析,我们发现每一条数据其实都是被tr标签包着的
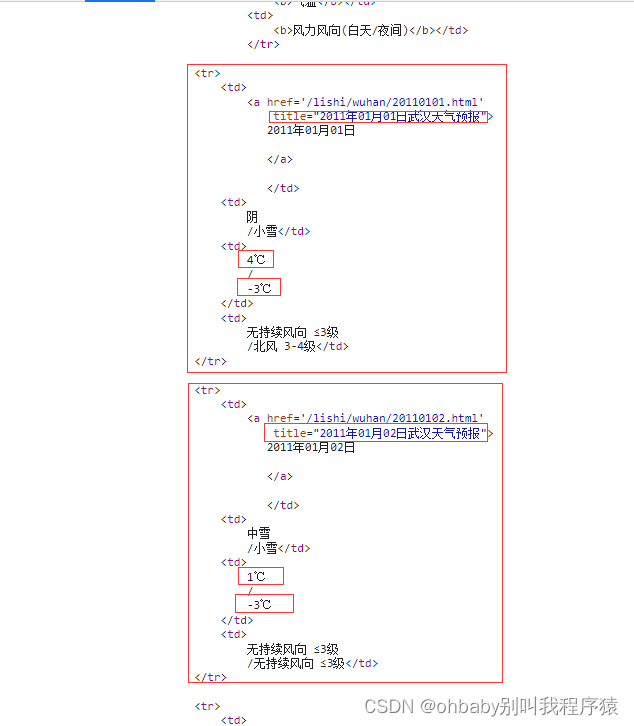
我们可以直接拿到所有tr标签信息,然后对每一条数据进行正则匹配拿到日期和温度数据
tr_list = soup.find_all('tr')

        for info in tr_list:
            info = str(info).replace(' ', '')
            # print(info)

            date = re.findall('title="(.*?)武汉天气预报', info)

            tem = re.findall('(.*?)℃', info)

            if len(date + tem) == 3:
                print(date + tem)
                csv_writer.writerow(date + tem)
当然最后别忘了,文件需要关闭
f.close()
然后我们可以拿到单页 也就是单个月的数据
现在我们需要拿取几年内的数据,我们对比多个月份的请求地址发现
http://www.tianqihoubao.com/lishi/wuhan/month/201101.html
对于后面的201101其实就是年份+月份,然后月份如果是个位数,前面需要加上0
这样能得出所有的月份的请求地址 然后分别进行爬取就好了
完整代码
import csv
import re

from bs4 import BeautifulSoup
import requests

f = open('data.csv', mode='a', encoding='utf-8', newline='')
csv_writer = csv.writer(f)

csv_writer.writerow([
    '日期',
    '最高气温',
    '最低气温'
])

headers = {
    'User-Agent': 'Mozilla/5.0 (Windows NT 10.0; Win64; x64) AppleWebKit/537.36 (KHTML, like Gecko) Chrome/105.0.0.0 Safari/537.36'
}

for year in range(2011, 2021):
    for month in range(1, 13):
        year = str(year)
        if month < 10:
            month = '0' + str(month)
        month = str(month)

        url = 'http://www.tianqihoubao.com/lishi/wuhan/month/' + year + month + '.html'

        response = requests.get(url=url, headers=headers)
        # print(response.text)

        soup = BeautifulSoup(response.text, 'lxml')
        tr_list = soup.find_all('tr')

        for info in tr_list:
            info = str(info).replace(' ', '')
            # print(info)

            date = re.findall('title="(.*?)武汉天气预报', info)

            tem = re.findall('(.*?)℃', info)

            if len(date + tem) == 3:
                print(date + tem)
                csv_writer.writerow(date + tem)
f.close()
可视化
# 老规矩,先导入模块
import pandas as pd
from matplotlib import pyplot as plt

# 读取csv文件数据
data = pd.read_csv('data.csv', encoding='utf-8')

# 分别拿取日期和温度的数据,而且将温度数据转成int类型
date = data['日期']
h = [int(i) for i in data['最高气温']]
l = [int(i) for i in data['最低气温']]

# 使用pyplot 的figure方法创建一个自定义的图像对象
image = plt.figure(dpi=128, figsize=(20, 6))

# 设置中文字体可见
plt.rcParams['axes.unicode_minus'] = False
plt.rcParams['font.sans-serif'] = ['SimHei']

# 先画最高温的线条,再画最低温的线条
plt.plot(date, h, color='red', alpha=0.5)
plt.plot(date, l, color='blue', alpha=0.5)

# 将最高温和最低温两条线中间部分给填充
plt.fill_between(date, h, l, facecolor='blue', alpha=0.2)

# 设置标题和x y轴名称
plt.title('北京市近几年的气温变化')
plt.xlabel('日期')
plt.ylabel('气温')

# 选择显示x轴的日期名
plt.xticks(date[::300])
# 保存图片
plt.savefig('北京市过去几年的气温变化.jpg')
# 显示图像
plt.show()


 被折叠的 条评论
为什么被折叠?
被折叠的 条评论
为什么被折叠?
 到【灌水乐园】发言


