


文章目录
前言
使用Prometheus+Grafana对Flink进行监控
一、技术介绍
1、Prometheus
Prometheus是一套开源的系统监控报警框架。它受启发于Google的Brogmon监控系统,由工作在SoundCloud的前google员工在2012年创建,作为社区开源项目进行开发,并于 2015年正式发布。
2016年,Prometheus正式加入Cloud Native Computing Foundation(CNCF)基金会的项目,成为受欢迎度仅次于Kubernetes 的项目。2017年底发布了基于全新存储层的2.0版本,能更好地与容器平台、云平台配合。和展示工具Grafana有很好的集成性。
prometheus项目地址:https://github.com/prometheus/prometheus
pushgateway项目地址:https://github.com/prometheus/pushgateway
2、Grafana
Grafana是一款用Go语言开发的开源数据可视化工具,可以做数据监控和数据统计,带有告警功能。
项目地址:https://github.com/grafana/grafana
3、架构图
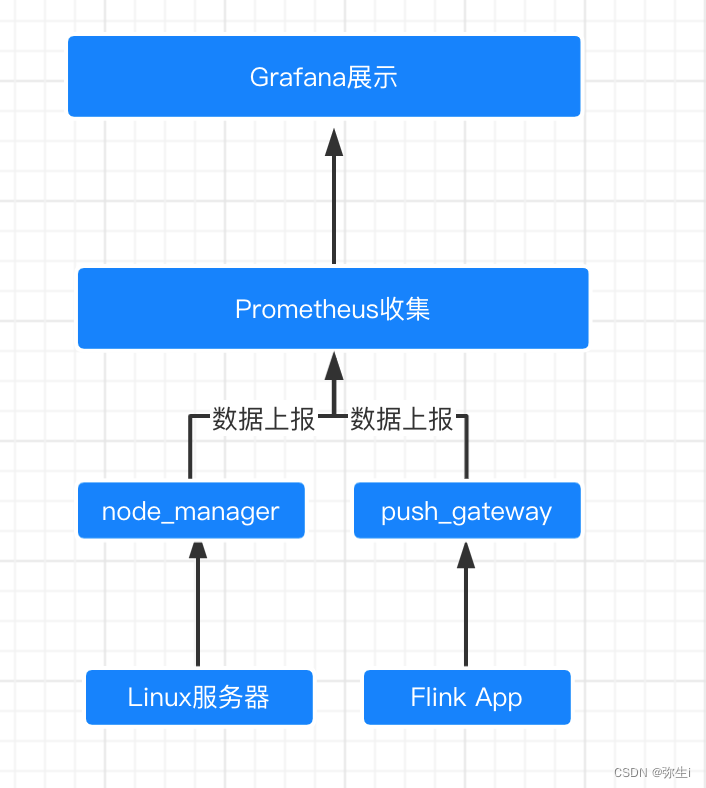
Flink App :需要监控的数据来源
Prometheus :收集数据
nodeManger :Prometheus 生态中的组件,nodeMnager负责监控运行机器的状态
Pushgateway:Prometheus 生态中的组件,pushGateway服务收集Flink的指标
Grafana :进行可视化展示
二、安装步骤
flink集成文档:https://ci.apache.org/projects/flink/flink-docs-stable/monitoring/metrics.html#cpu
1、拷贝jar包
将flink中plugins文件夹下的jar拷贝至lib目录下
cd plugins/metrics-prometheus/
cp flink-metrics-prometheus-1.13.0.jar /data/flink-1.13.0/lib/
2、修改 Flink 配置
cd conf/
vi flink-conf.yaml
修改如下
##### 与 Prometheus 集成配置 #####
metrics.reporter.promgateway.class:
org.apache.flink.metrics.prometheus.PrometheusPushGatewayReporter
# PushGateway 的主机名与端口号
metrics.reporter.promgateway.host: localhost
metrics.reporter.promgateway.port: 9091
# Flink metric 在前端展示的标签(前缀)与随机后缀
metrics.reporter.promgateway.jobName: myJob
metrics.reporter.promgateway.randomJobNameSuffix: true
metrics.reporter.promgateway.deleteOnShutdown: false
metrics.reporter.promgateway.interval: 30 SECONDS
3、pushgateway安装
下载:https://prometheus.io/download/
解压:tar -zxvf pushgateway-0.9.1.linux-amd64.tar.gz
启动:./pushgateway
访问:http://localhost:9091/
4、node_exporter安装
下载:https://prometheus.io/download/
解压:tar -zxvf node_exporter-1.3.1.linux-amd64.tar.gz
启动:./node_exporter
访问:http://localhost:9100/metrics
5、prometheus安装
下载:https://prometheus.io/download/
解压:tar -zxvf prometheus-2.36.0-rc0.linux-amd64.tar.gz
编辑 prometheus.yml
scrape_configs:
  - job_name: 'prometheus'
    static_configs:
      - targets: ['localhost:9090']
        labels:
          instance: 'prometheus'
  - job_name: 'linux'
    static_configs:
      - targets: ['localhost:9100']
        labels:
          instance: 'localhost'
  - job_name: 'pushgateway'
    static_configs:
      - targets: ['localhost:9091']
        labels:
          instance: 'pushgateway'
启动:./prometheus --config.file=prometheus.yml
访问:http://localhost:9090/targets
6、grafana安装
下载:wget https://dl.grafana.com/oss/release/grafana-6.3.6.linux-amd64.tar.gz
解压:tar -zxvf grafana-6.3.6.linux-amd64.tar.gz
启动:./bin/grafana-server web
访问:http://localhost:3000/login
查看进程:netstat -apn | grep -E ‘9091|3000|9090|9100’
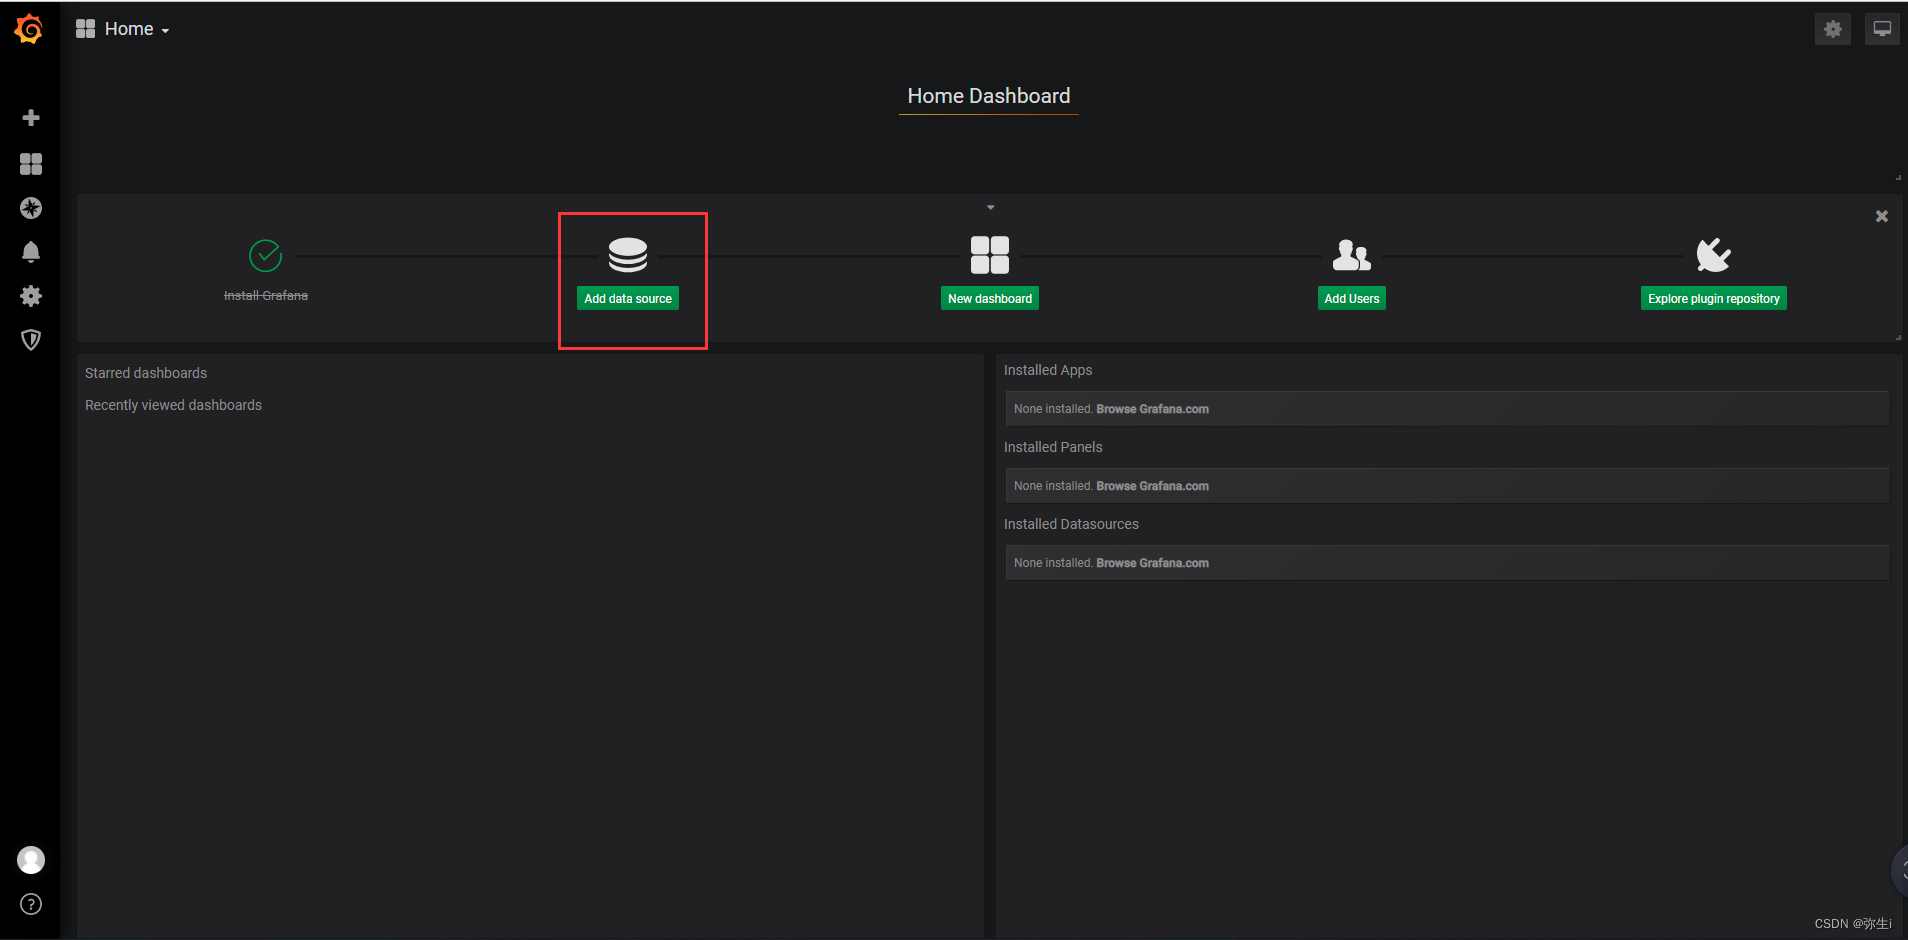
操作步骤:
- 点击Add data source
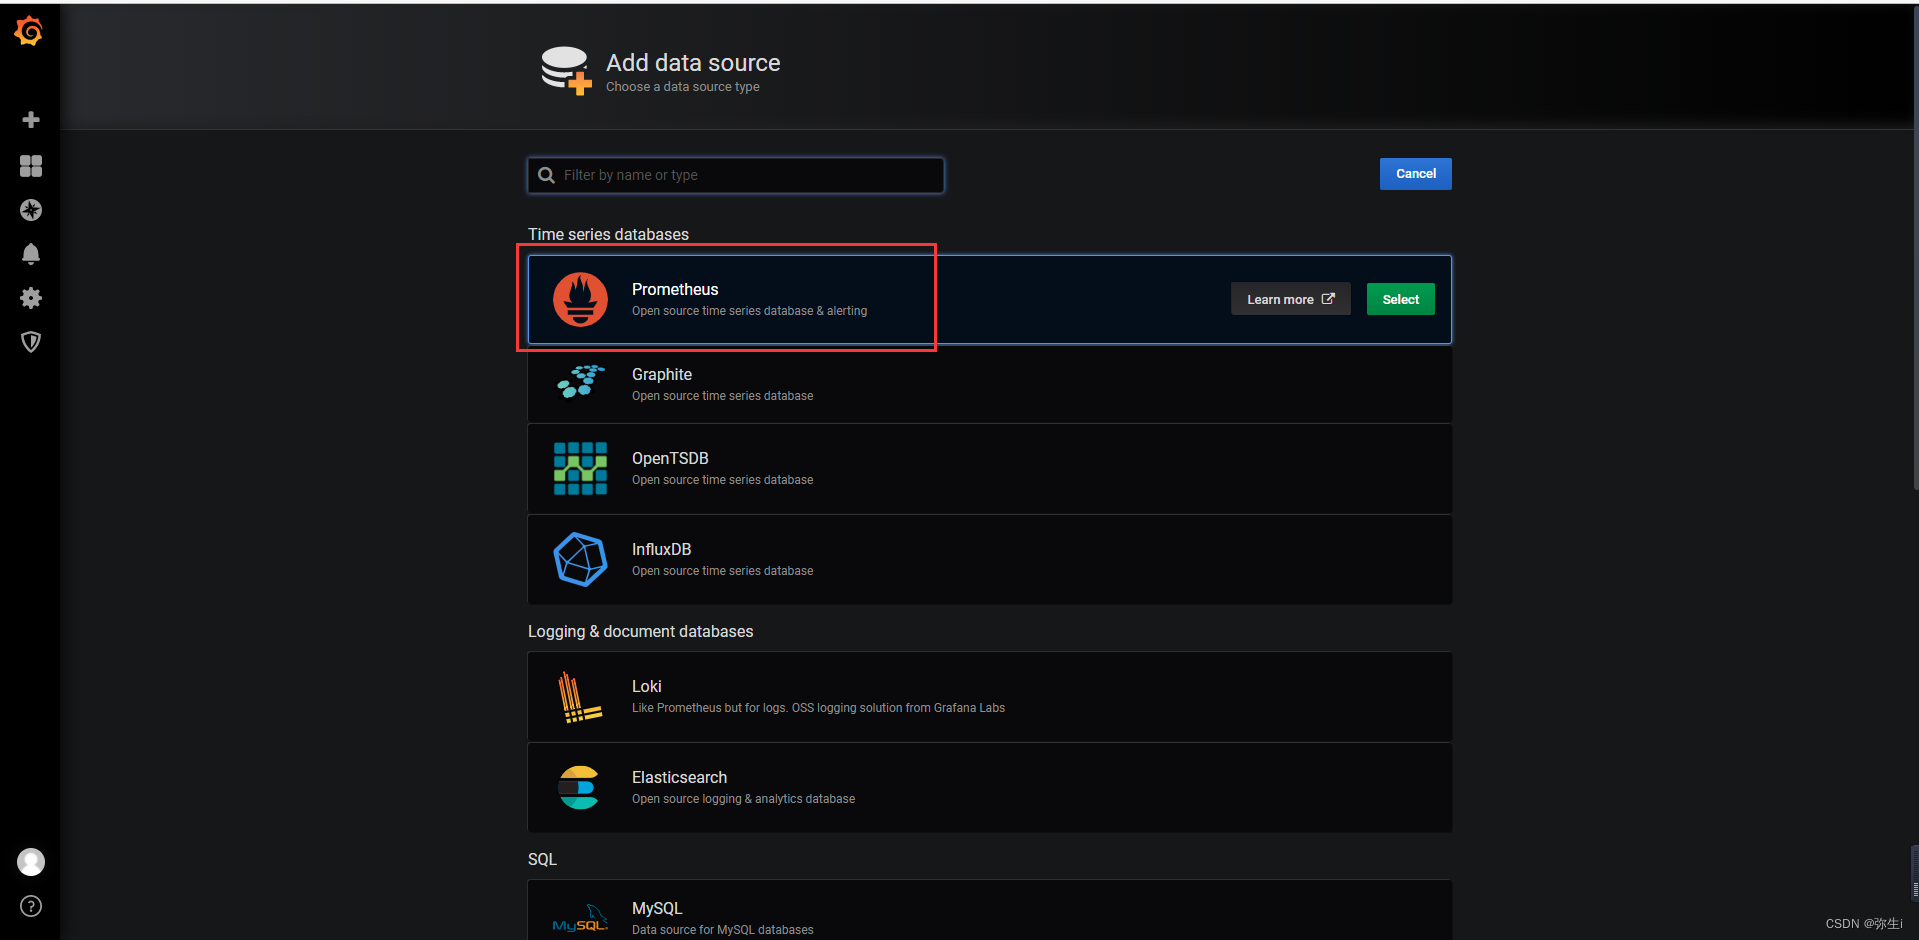
- 点击Prometheus
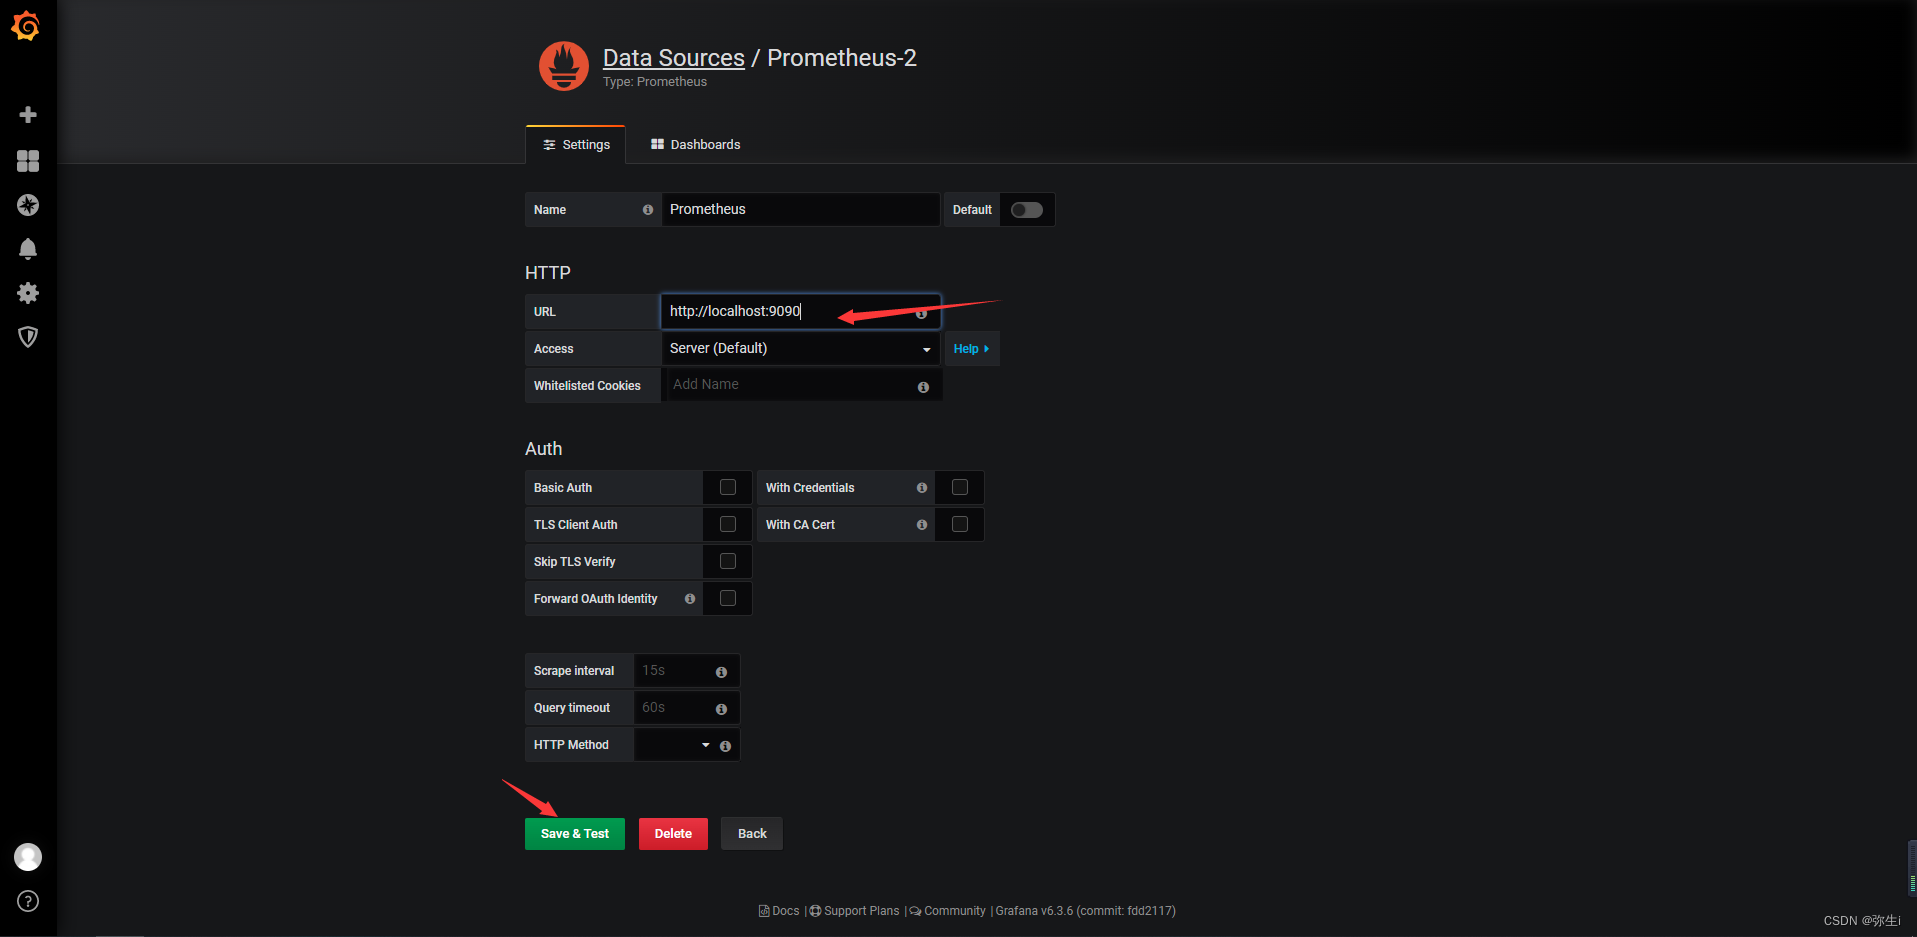
- 输入URL地址,点击保存
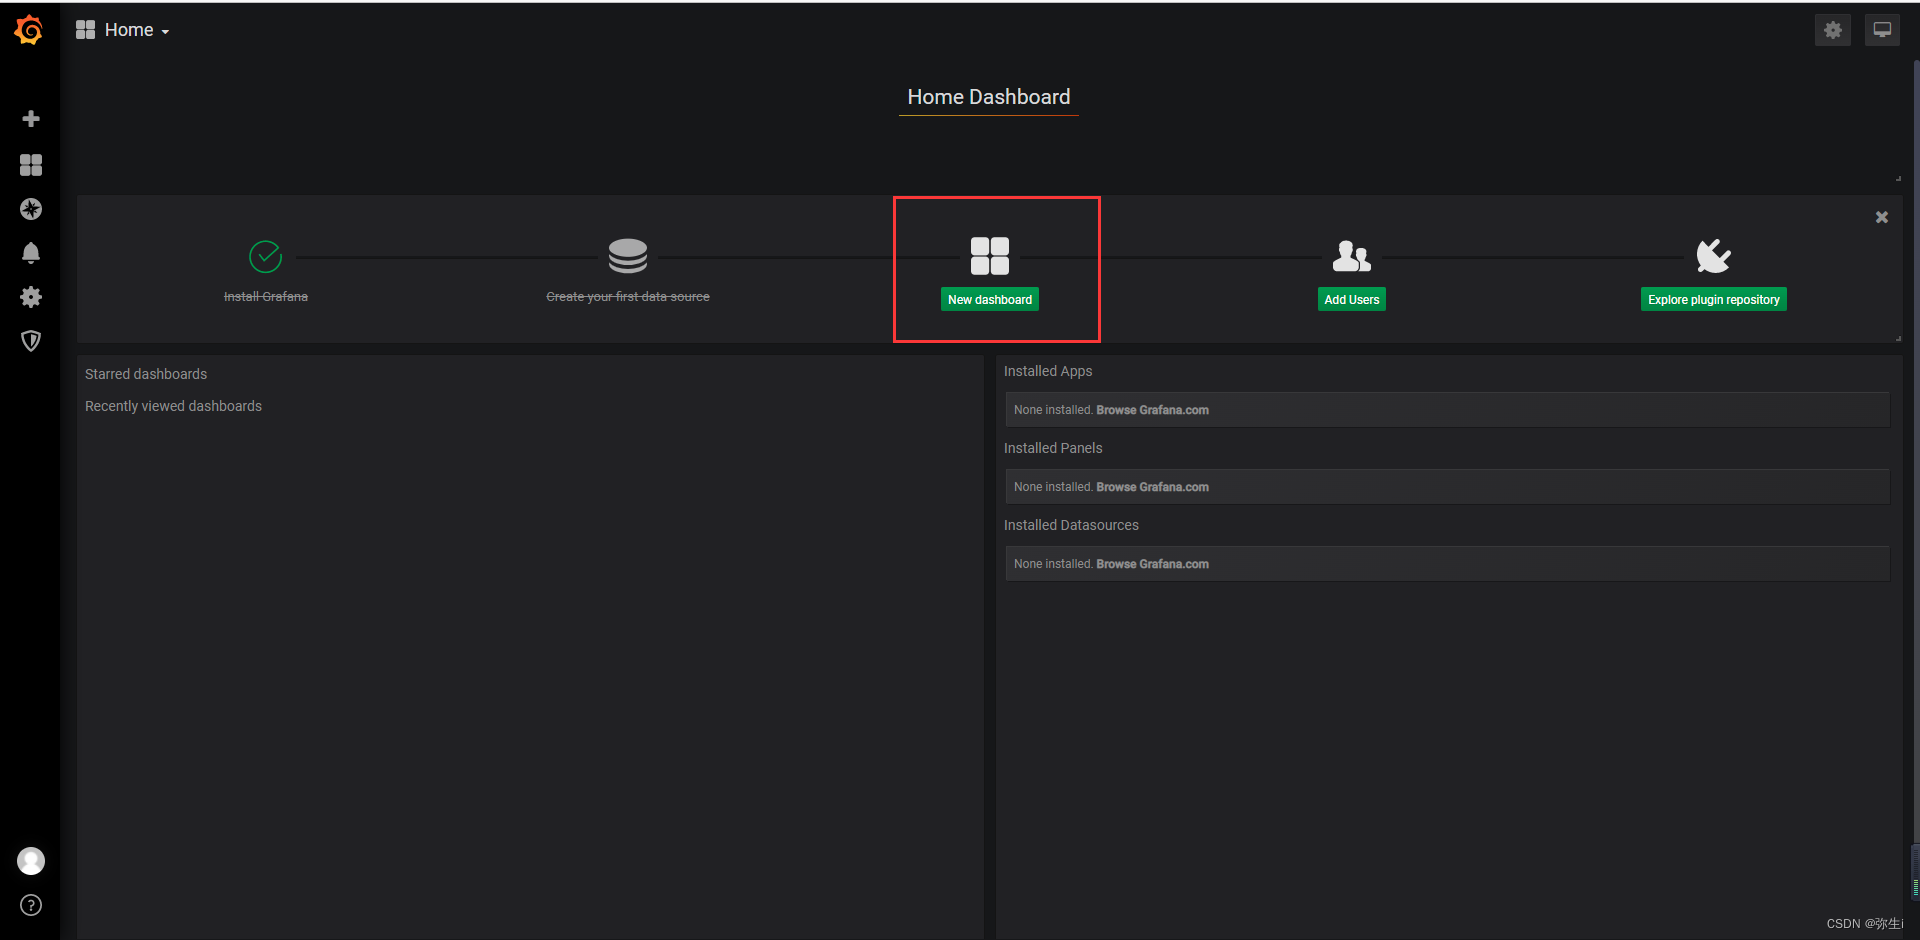
- 点击New dashbpoard
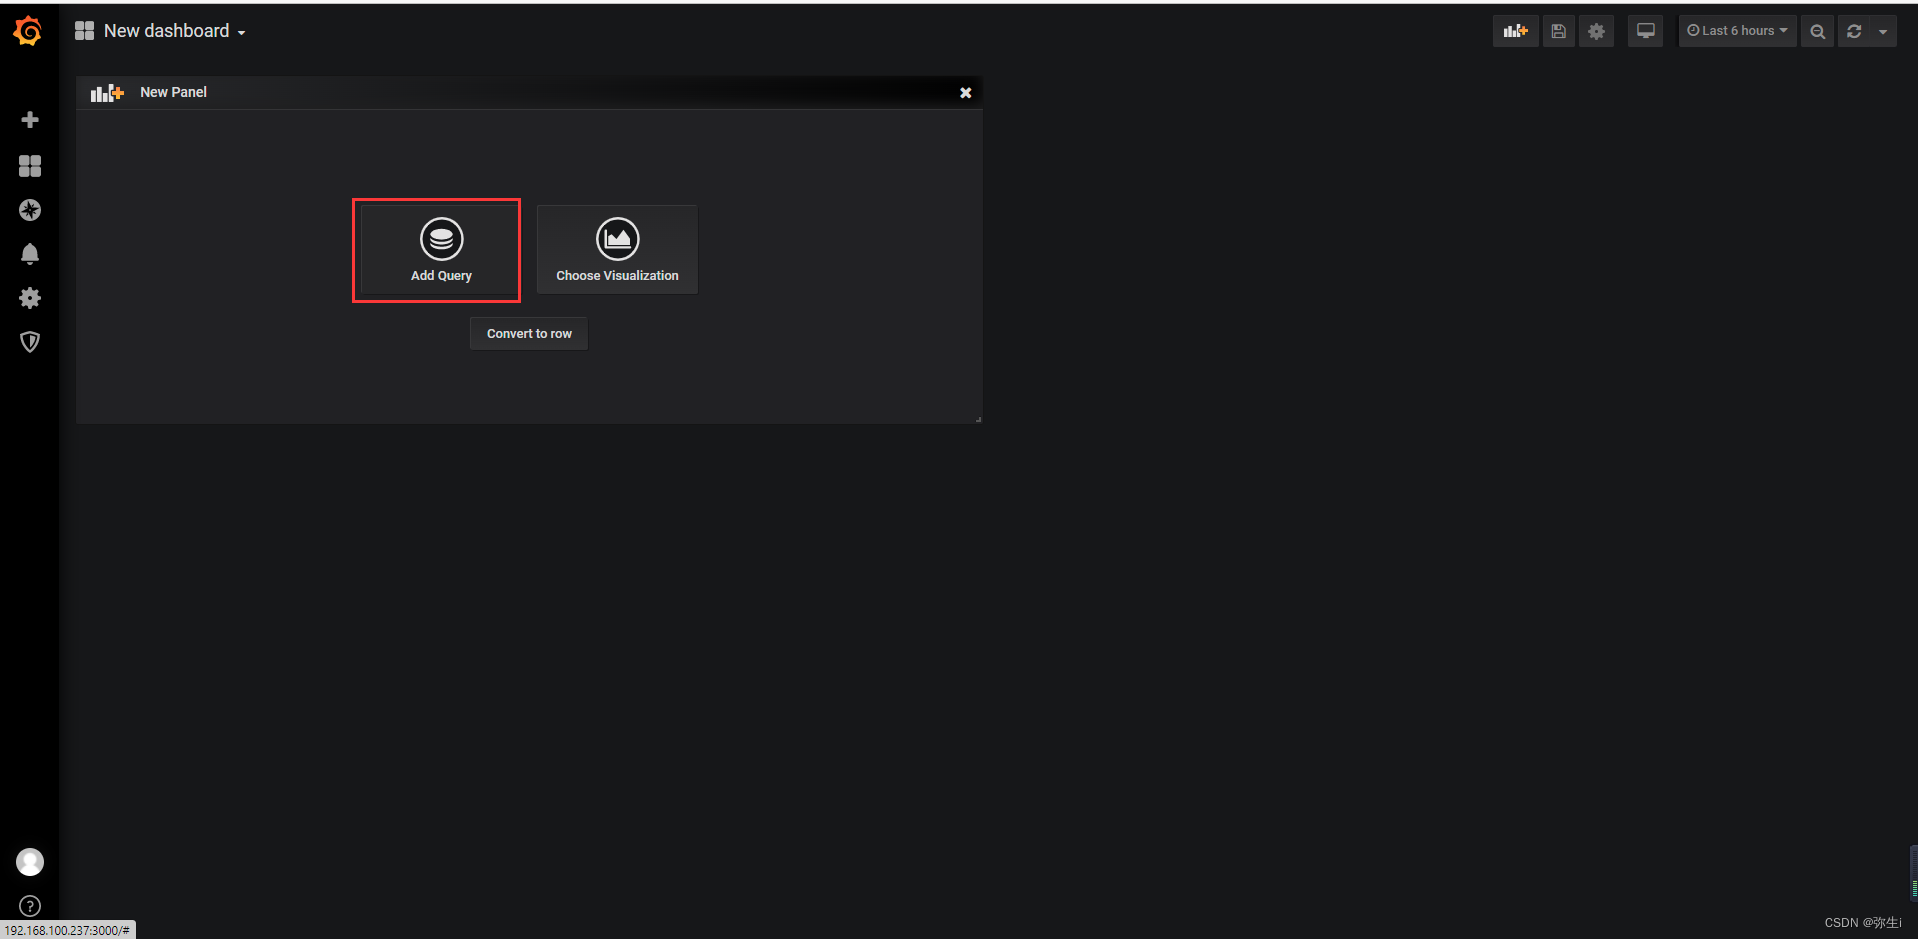
- 点击Add Quary
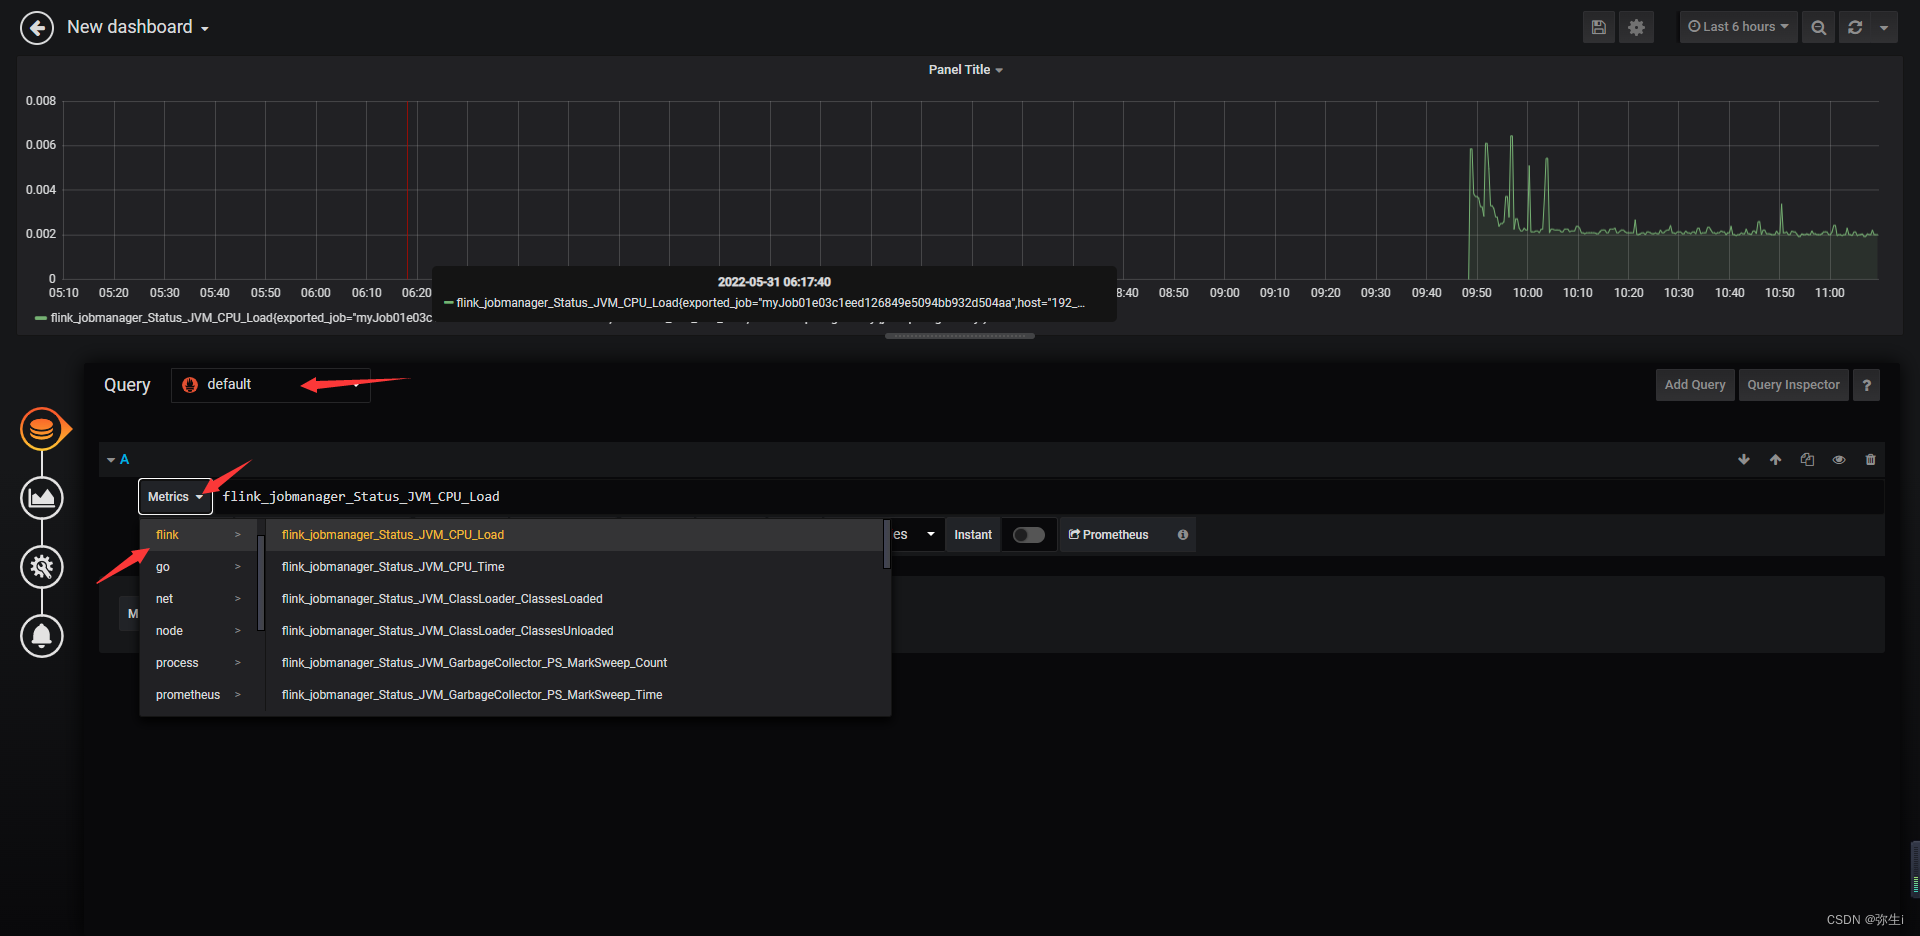
- 如下操作,成功显示
总结
至此搭建完成,感谢阅读。


 1460
1460


 被折叠的 条评论
为什么被折叠?
被折叠的 条评论
为什么被折叠?
 到【灌水乐园】发言


