


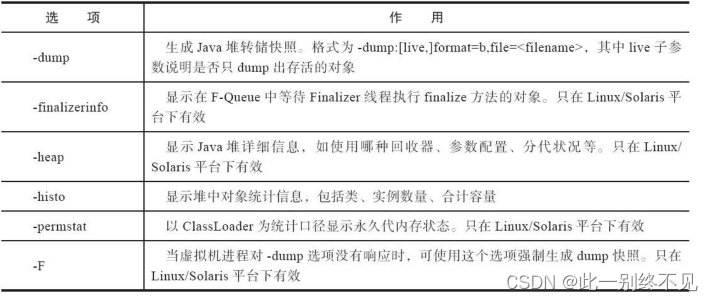
作用:主要用来生成堆dump文件

C:\Users\qianqian>jmap -h
Usage:
    jmap [option] <pid>
        (to connect to running process)
    jmap [option] <executable <core>
        (to connect to a core file)
    jmap [option] [server_id@]<remote server IP or hostname>
        (to connect to remote debug server)

where <option> is one of:
    <none>               to print same info as Solaris pmap
    -heap                to print java heap summary
    -histo[:live]        to print histogram of java object heap; if the "live"
                         suboption is specified, only count live objects
    -clstats             to print class loader statistics
    -finalizerinfo       to print information on objects awaiting finalization
    -dump:<dump-options> to dump java heap in hprof binary format
                         dump-options:
                           live         dump only live objects; if not specified,
                                        all objects in the heap are dumped.
                           format=b     binary format
                           file=<file>  dump heap to <file>
                         Example: jmap -dump:live,format=b,file=heap.bin <pid>
    -F                   force. Use with -dump:<dump-options> <pid> or -histo
                         to force a heap dump or histogram when <pid> does not
                         respond. The "live" suboption is not supported
                         in this mode.
    -h | -help           to print this help message
-J<flag> to pass <flag> directly to the runtime system需要注意的是:使用”live“和自动的方式会进行一次Full GC
C:\Users\qianqian>jstat -gc 8740
 S0C    S1C    S0U    S1U      EC       EU        OC         OU       MC     MU    CCSC   CCSU   YGC     YGCT    FGC    FGCT     GCT
 0.0    0.0    0.0    0.0   157696.0 143360.0  366592.0   314029.1  91692.0 86040.6 11308.0 10325.6  22604  225.107   6      3.160  228.266

C:\Users\qianqian>jmap -dump:live,format=b,file=qian.hprof 8740
Dumping heap to C:\Users\qianqian\qian.hprof ...
Heap dump file created

C:\Users\qianqian>jstat -gc 8740
 S0C    S1C    S0U    S1U      EC       EU        OC         OU       MC     MU    CCSC   CCSU   YGC     YGCT    FGC    FGCT     GCT
 0.0    0.0    0.0    0.0   159744.0 87040.0   366592.0   315255.9  91692.0 86040.6 11308.0 10325.6  22607  225.130   7      3.656  228.787
-histo
输出堆中对象占用的情况
需要注意的是如果使用-histo:live将会进行一次Full GC
C:\Users\qianqian>jstat -gc 8740
S0C S1C S0U S1U EC EU OC OU MC MU CCSC CCSU YGC YGCT FGC FGCT GCT
0.0 0.0 0.0 0.0 159744.0 87040.0 366592.0 315255.9 91692.0 86040.6 11308.0 10325.6 22607 225.130 7 3.656 228.787
C:\Users\qianqian>jmap -histo 8740 > q.txt
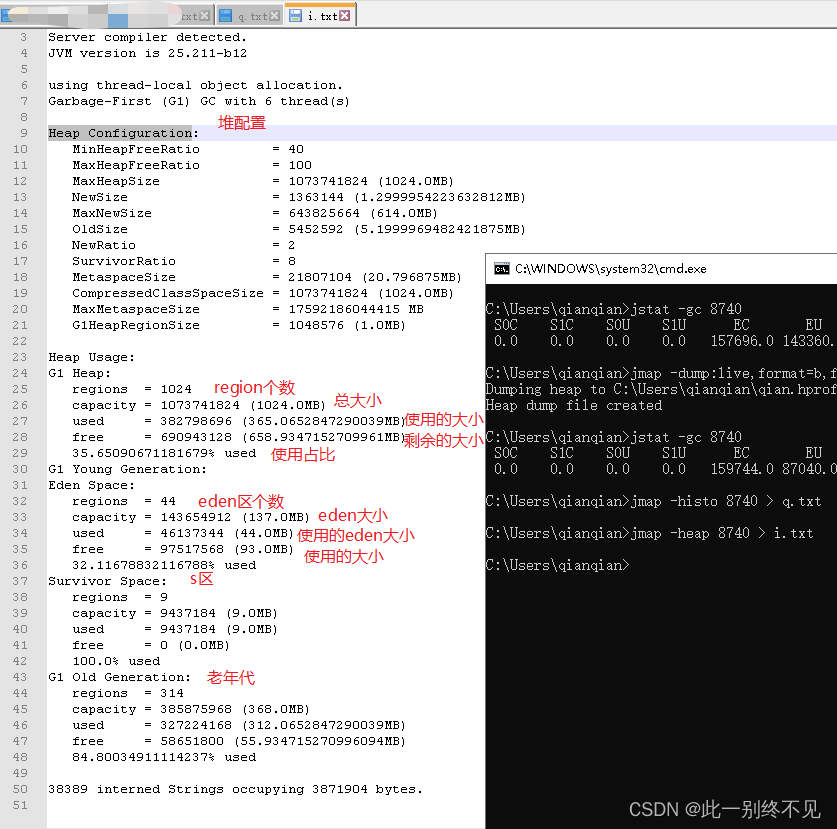
C:\Users\qianqian>jmap -heap 8740 > i.txt
C:\Users\qianqian>jstat -gc 8740
S0C S1C S0U S1U EC EU OC OU MC MU CCSC CCSU YGC YGCT FGC FGCT GCT
0.0 4096.0 0.0 4096.0 134144.0 43008.0 388096.0 336686.5 91692.0 86040.6 11308.0 10325.6 22689 225.896 7 3.656 229.552
C:\Users\qianqian>jmap -histo:live 8740 > a.txt
C:\Users\qianqian>jstat -gc 8740
S0C S1C S0U S1U EC EU OC OU MC MU CCSC CCSU YGC YGCT FGC FGCT GCT
0.0 0.0 0.0 0.0 164864.0 44032.0 361472.0 311746.6 91692.0 86040.6 11308.0 10325.6 22701 225.990 8 4.190 230.181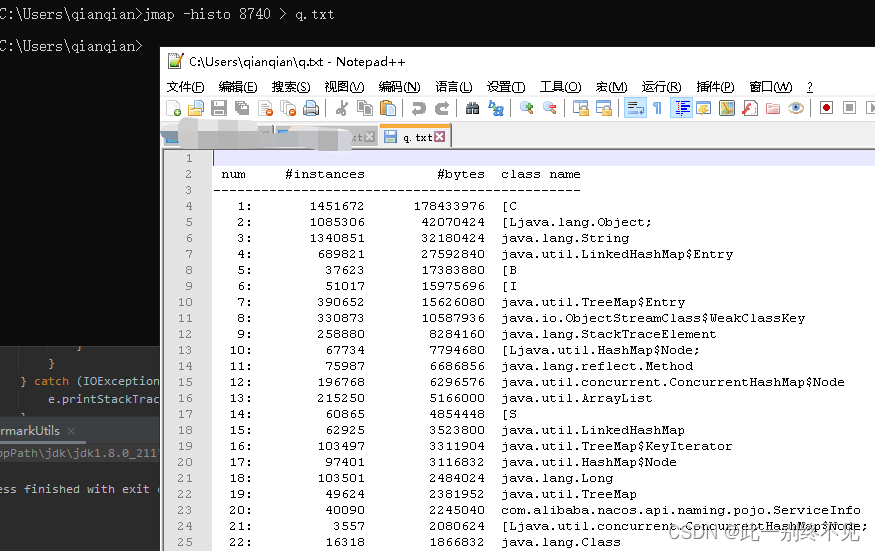
-heap
输出堆中各个区域的大小、使用情况等
自动的方式
会Full GC
JVM参数
-Xmx20M
-Xms20M
作用:在堆OOM溢出的时候生成dump文件
-XX:+HeapDumpOnOutOfMemoryError
作用:指定dump文件生成的位置
-XX:HeapDumpPath=F:\dc.hprof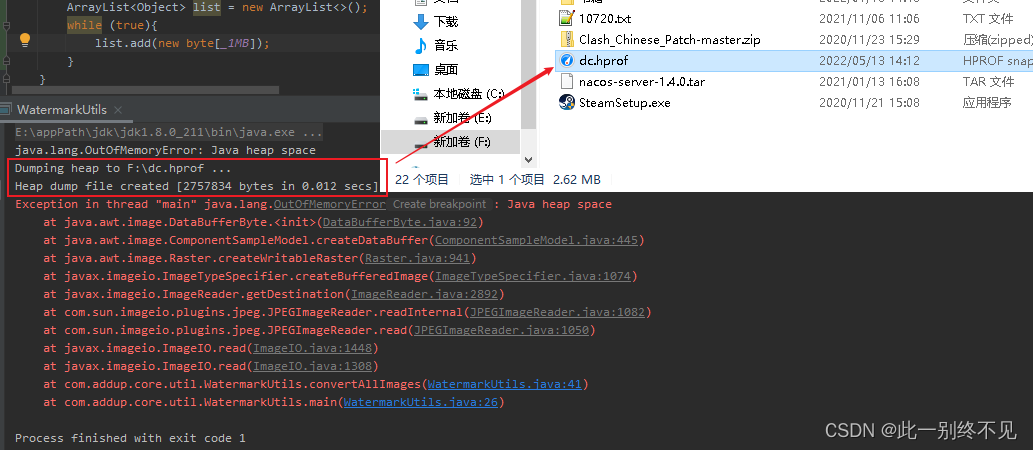
总结
jmap可以用来导出堆的dump文件、堆中对象的占用情况、堆空间配置和内存的使用情况等。
需要注意的是凡是使用到”live“输出存活对象都会在导出之前执行一次Full GC。
由于jmap将访问堆中的所有对象,为了保证在这个过程中不被应用线程干扰,需要借助”安全点“机制。所以jmap导出的堆快照一定是在安全点区域。这就可能导致分析存在偏差
如果一个对象的生命周期恰好在两个安全点之间,那么:live将无法统计到


 588
588


 被折叠的 条评论
为什么被折叠?
被折叠的 条评论
为什么被折叠?
 到【灌水乐园】发言


