echarts自定义label,echarts自定义formatter,echarts样式自定义
呈现效果
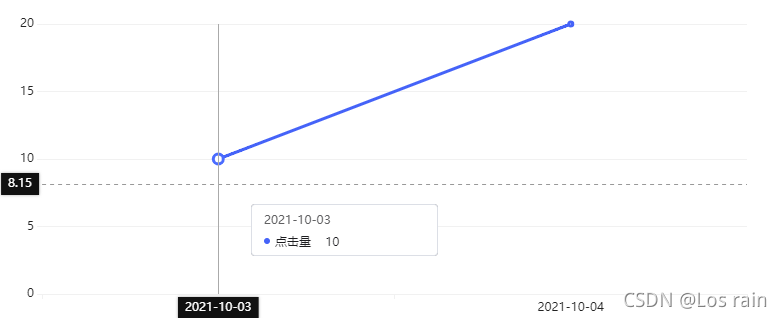
formatter代码
formatter: (params)=> {
let str = '<div style="padding: 3px 12px;width: 161px;background: #FFFFFF;border: 1px solid #DCDFE6;box-shadow:none; opacity: 1;border-radius: 4px;"><span style="color:#606062;font-size: 12px;">' + params[0].axisValue + "</span><br />";
params.forEach((item) => {
str +=
'<span style="color:#f00;font-size: 12px;color: #1D1D20;"><span style="float:left; margin-top:8px; margin-right:5px;border-radius:50%;width:6px;height:6px;background-color:'+item.color+'"></span>' + this.name + " " + item.data + "</span>";
});
str += '</div>'
return str;
}
option完整代码
{
grid: grid,
tooltip: {
axisPointer: {
type: "cross",
label: {
backgroundColor: "#111"
}
},
padding: 0,
formatter: (params)=> {
let str = '<div style="padding: 3px 12px;width: 161px;background: #FFFFFF;border: 1px solid #DCDFE6;box-shadow:none; opacity: 1;border-radius: 4px;"><span style="color:#606062;font-size: 12px;">' + params[0].axisValue + "</span><br />";
params.forEach((item) => {
str +=
'<span style="color:#f00;font-size: 12px;color: #1D1D20;"><span style="float:left; margin-top:8px; margin-right:5px;border-radius:50%;width:6px;height:6px;background-color:'+item.color+'"></span>' + this.name + " " + item.data + "</span>";
});
str += '</div>'
return str;
},
trigger: "axis",
confine: true
},
xAxis: {
type: "category",
axisLine: {
show: true,
lineStyle: {
color: "#f1f1f1"
}
},
axisLabel: {
interval: interval,
color: "#222222",
rotate: 0
},
data: xAxisData
},
yAxis: {
type: "value",
axisLine: {
show: false,
lineStyle: {
color: "#f1f1f1"
}
},
splitLine: {
show: true,
lineStyle: {
color: "#f1f1f1"
}
},
axisLabel: {
color: "#222222"
}
},
series: [
{
data: seriesData,
smooth: true,
type: "line",
itemStyle: {
color: "#4563F8",
borderWidth: 3,
borderType: 'solid',
borderCap: 'square'
},
lineStyle: {
color: "#4563F8",
width: 3
}
}
]
}


 262
262


 被折叠的 条评论
为什么被折叠?
被折叠的 条评论
为什么被折叠?
 到【灌水乐园】发言


