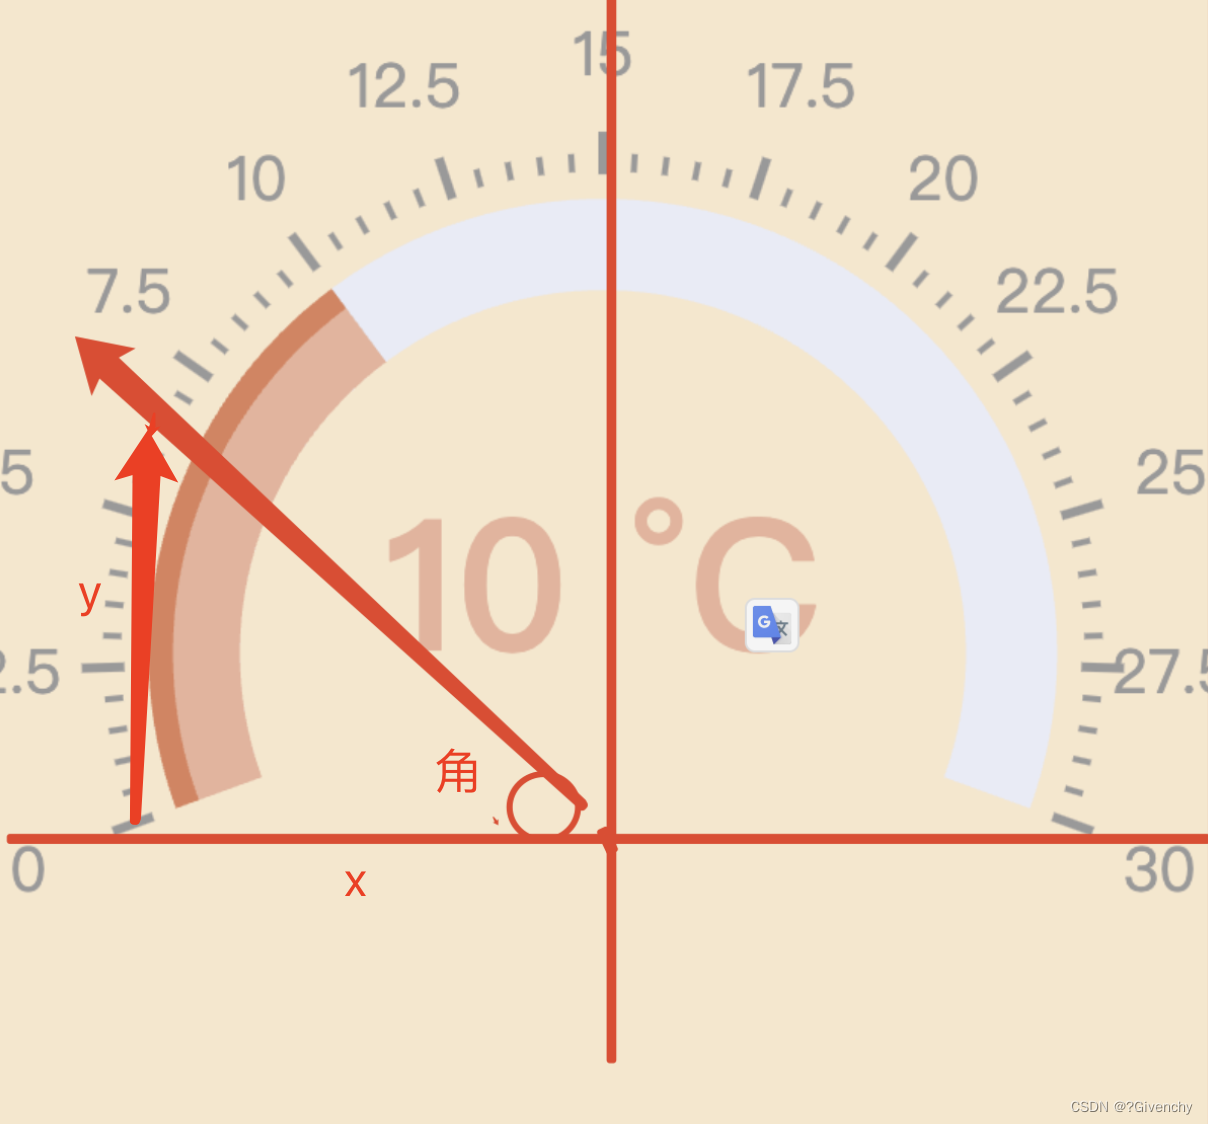
1 更具点击获取的坐标 event.offsetY , event.offsetX
2 通过中心点坐标差,获取角的度数,然后取180度的占比,最后✖️总值=刻度值.
3 然后在赋值给data
例子 : 角的度数是30度 30/180*30 = 5 则刻度值指向5
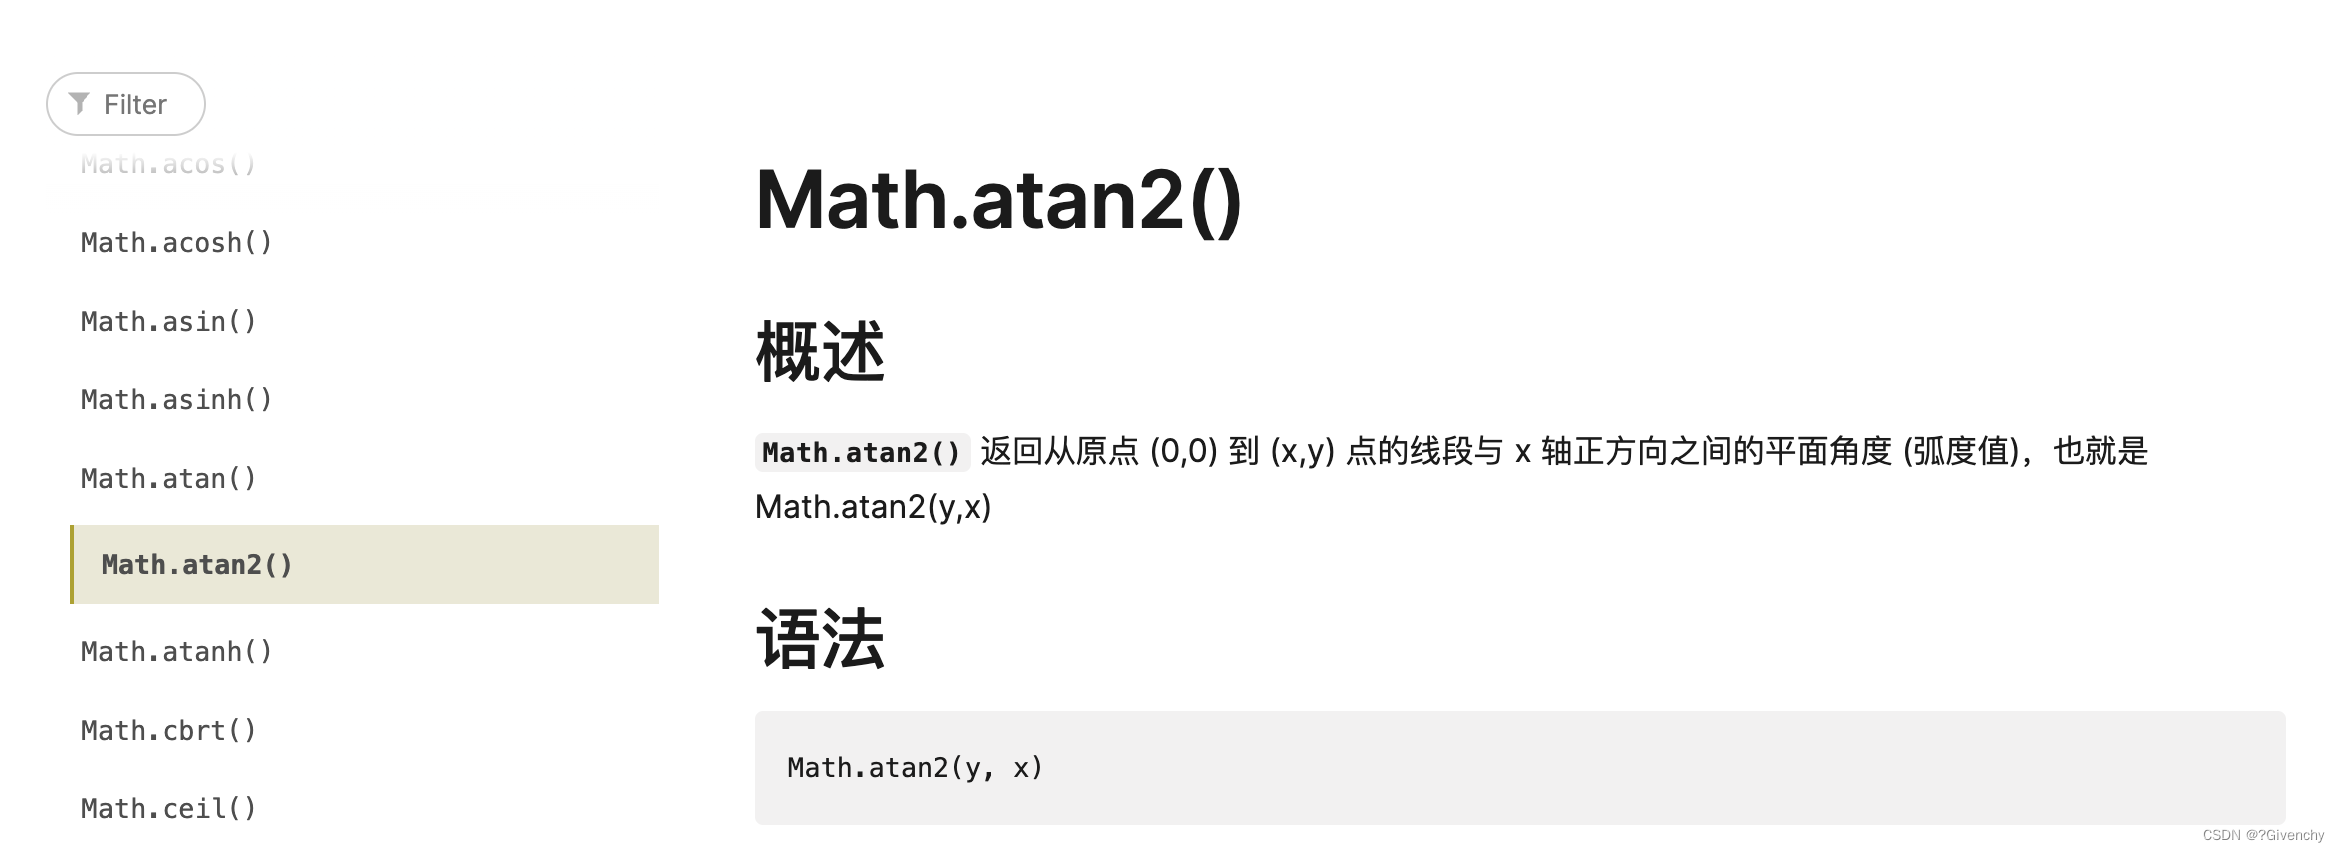
角度度数怎么求? (Math.atan2(y - event.offsetY, x - event.offsetX) * 180) / Math.PI
<!--
 * @Author:  215683509@qq.com
 * @Date: 2024-05-08 14:07:53
 * @LastEditors: 215683509@qq.com
 * @LastEditTime: 2024-05-30 15:27:25
 * @Description: 测试
-->
<template>
  <div class="index-view">
    <div @touchend="handleTouchEnd" id="main"></div>
  </div>
</template>
<script>
import { mapGetters, mapMutations } from 'vuex'
import Header from '@/components/Header'
import Empty from './empty.vue'
import { getImgUrl } from '@/utils/auth.js'
import * as echarts from 'echarts'

export default {
  components: {
    Header,
    Empty,
  },
  data() {
    return {
      dataValue: 0,
      data1: 0,
    }
  },
  mounted() {
    this.initChart()

    // 假设你已经有了一个echarts实例
    // 监听ECharts的touch事件
    // 监听touchmove事件
    let myChart = echarts.init(document.getElementById('main'))
    myChart.getZr().on('click', (event) => {
      this.setChart(event)
    })
  },
  computed: {
    option() {
      return {
        series: [
          {
            type: 'gauge',
            center: ['50%', '60%'],
            startAngle: 200,
            endAngle: -20,
            min: 0,
            max: 30,
            splitNumber: 12,
            itemStyle: {
              color: '#FFAB91',
            },
            progress: {
              show: true,
              width: 30,
            },
            pointer: {
              show: false,
            },
            axisLine: {
              lineStyle: {
                width: 30,
              },
            },
            axisTick: {
              distance: -45,
              splitNumber: 5,
              lineStyle: {
                width: 2,
                color: '#999',
              },
            },
            splitLine: {
              distance: -52,
              length: 14,
              lineStyle: {
                width: 3,
                color: '#999',
              },
            },
            axisLabel: {
              distance: -20,
              color: '#999',
              fontSize: 20,
            },
            anchor: {
              show: false,
            },
            title: {
              show: false,
            },
            // detail: {formatter:'{value}'},
            data: [{ value: this.dataValue, name: 'Status' }],
            detail: {
              valueAnimation: true,
              width: '60%',
              lineHeight: 40,
              borderRadius: 8,
              offsetCenter: [0, '-15%'],
              fontSize: 60,
              fontWeight: 'bolder',
              formatter: '{value} °C',
              color: 'inherit',
            },
          },
          {
            type: 'gauge',
            center: ['50%', '60%'],
            startAngle: 200,
            endAngle: -20,
            min: 0,
            max: 30,
            itemStyle: {
              color: '#FD7347',
            },
            progress: {
              show: true,
              width: 8,
            },
            pointer: {
              show: false,
            },
            axisLine: {
              show: false,
            },
            axisTick: {
              show: false,
            },
            splitLine: {
              show: false,
            },
            axisLabel: {
              show: false,
            },
            detail: {
              show: false,
            },
            data: [
              {
                value: this.data1,
              },
            ],
          },
        ],
      }
    },
  },
  methods: {
    setChart(event) {
      let x = 200
      let y = 295
      // 计算角度
      let currentAngle =
        (Math.atan2(y - event.offsetY, x - event.offsetX) * 180) / Math.PI
     //求值
      this.dataValue = ((currentAngle / 180) * 30).toFixed(0)
      this.data1 = ((currentAngle / 180) * 30).toFixed(0)
      //渲染
      this.initChart()
    },
    initChart() {
      var chartDom = document.getElementById('main')
      var myChart = echarts.init(chartDom)
      var option
      option = this.option
      option && myChart.setOption(option)
    },
  },
}
</script>
<style scoped>
.index-view {
  height: 500px;
  background-color: bisque;
}
#main {
  height: 400px;
  width: 400px;
  border: 1px solid red;
}
</style>


 3811
3811


 被折叠的 条评论
为什么被折叠?


