QCustomPlot之数据选择(十八)

本文详细介绍了QCustomPlot中数据选择的多种方式,包括数据选择粒度的设置、选择方式及数据读取方法。同时,深入探讨了如何自定义数据选择的风格,包括画笔、画刷和散点图三种风格的应用。此外,文章还提供了完整的源码示例,展示了如何实现轴、图例和图表的多选,以及如何通过鼠标框选进行数据选择。

效果图

数据选择粒度

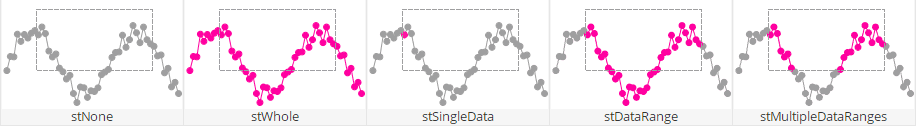
可以通过函数QCPAbstractPlottable::setSelectable(所有的图表类都继承自QCPAbstractPlottable)设置数据选择的粒度,如下图所示:

数据选择粒度

数据选择方式及数据读取

一般来说,数据选择是通过鼠标来进行的,即鼠标点击或者鼠标框选,鼠标点击选择通过函数 QCustomPlot::setInteractions 设置相应的枚举量即可,如果需要多选,则需要 QCustomPlot::setMultiSelectModifier 设置多选时使用的按键以及 setInteractions 设置枚举量包含 QCP::iMultiSelect ;而鼠标框选则通过 QCustomPlot::setSelectionRectMode 设置框选时的枚举类型为 srmSelect ,QCustomPlot还给了一个 srmCustom 类型让我们自定义框选时的行为,只需要连接 QCPSelectionRect::accepted 信号即可

已被选择的数据可以通过QCPAbstractPlottable::selection函数读取,其返回QCPDataSelection类,QCPDataSelection表现为多个选择范围的集合QList< QCPDataRange >,而QCPDataRange是单个数据选择的范围,包含被选择数据的开始位置以及结束位置(通俗的说就是下标index),注意这里遵循左闭右开原则

<think>我们使用PyQt5和QCustomPlot来实现折线图的数据选择功能。根据引用[2]和引用[4],QCustomPlot是一个功能强大的绘图库,支持多种交互功能。数据选择功能可以通过以下步骤实现: 1. **启用选择功能**:设置QCustomPlot的交互标志,允许用户选择图形元素(如数据点)。 2. **设置选择样式**:定义数据点被选中时的外观(如颜色、大小)。 3. **捕获选择事件**:通过信号槽机制捕获用户选择数据点,并执行相应操作。 具体实现步骤如下: ### 1. 启用选择功能 首先,我们需要启用QCustomPlot的交互功能,特别是选择功能。可以通过`setInteractions`方法设置交互标志。引用[2]提到QCustomPlot支持高性能的交互操作,因此我们可以利用其内置的选择机制。 ```python from PyQt5 import QtWidgets import qcustomplot as qcp # 注意:Python绑定可能需要安装,通常命名为pyqtgraph或qcustomplot,但这里我们使用qcustomplot # 创建QCustomPlot对象 customPlot = qcp.QCustomPlot() # 启用轴拖动、缩放和图形选择 customPlot.setInteractions(qcp.QCP.Interactions( qcp.QCP.iRangeDrag | qcp.QCP.iRangeZoom | qcp.QCP.iSelectPlottables )) ``` ### 2. 添加折线图并设置可选性 在添加折线图(QCPGraph)时,我们需要设置其可被选择。同时,我们可以定义选中时的样式。 ```python # 添加数据 x = [1, 2, 3, 4, 5] y = [2, 4, 1, 5, 3] # 创建折线图 graph = customPlot.addGraph() graph.setData(x, y) graph.setLineStyle(qcp.QCPGraph.lsLine) # 折线 graph.setScatterStyle(qcp.QCPScatterStyle(qcp.QCPScatterStyle.ssCircle, 8)) # 设置点样式为圆形,大小为8 # 设置折线图可被选择 graph.setSelectable(qcp.QCP.SelectionType.stSingleData) # 允许选择单个数据点 # 设置选中时的样式 graph.setSelectionDecorator(None) # 使用默认的装饰器,或者可以自定义 # 设置选中时的点样式 graph.selectedScatterStyle().setShape(qcp.QCPScatterStyle.ssDisc) # 选中时点变为实心圆 graph.selectedScatterStyle().setSize(10) # 选中时点变大 ``` ### 3. 捕获选择事件 当用户选择数据点时,我们可以通过`selectionChangedByUser`信号来捕获事件,并获取选中的数据点。 ```python def on_selection_changed(): # 获取当前选中的图形元素 selected = customPlot.selectedPlottables() if not selected: return # 因为我们只允许选择折线图的数据点,所以这里我们假设选中的是折线图 for graph in selected: # 获取选中的数据点 selected_data = graph.selectedData() if selected_data: # 由于我们设置的是单个数据选择,所以selected_data应该是一个点 # 但实际上,selected_data返回的是选中的所有点(列表) for point in selected_data: print(f"Selected point: x={point.key()}, y={point.value()}") # 连接信号 customPlot.selectionChangedByUser.connect(on_selection_changed) ``` ### 4. 完整示例代码 以下是一个完整的示例代码,展示如何在PyQt5窗口中使用QCustomPlot实现折线图数据选择功能。 ```python import sys from PyQt5 import QtWidgets import qcustomplot as qcp class MainWindow(QtWidgets.QMainWindow): def __init__(self): super().__init__() self.setWindowTitle("QCustomPlot Data Point Selection Demo") self.resize(800, 600) # 创建QCustomPlot对象 self.customPlot = qcp.QCustomPlot() self.setCentralWidget(self.customPlot) # 启用交互 self.customPlot.setInteractions(qcp.QCP.Interactions( qcp.QCP.iRangeDrag | qcp.QCP.iRangeZoom | qcp.QCP.iSelectPlottables )) # 添加数据 x = [1, 2, 3, 4, 5] y = [2, 4, 1, 5, 3] # 创建折线图 self.graph = self.customPlot.addGraph() self.graph.setData(x, y) self.graph.setLineStyle(qcp.QCPGraph.lsLine) self.graph.setScatterStyle(qcp.QCPScatterStyle(qcp.QCPScatterStyle.ssCircle, 8)) self.graph.setSelectable(qcp.QCP.SelectionType.stSingleData) # 允许选择单个数据点 # 设置选中样式 self.graph.selectedScatterStyle().setShape(qcp.QCPScatterStyle.ssDisc) self.graph.selectedScatterStyle().setSize(10) # 设置坐标轴标签 self.customPlot.xAxis.setLabel("X") self.customPlot.yAxis.setLabel("Y") self.customPlot.rescaleAxes() self.customPlot.replot() # 连接选择改变信号 self.customPlot.selectionChangedByUser.connect(self.on_selection_changed) def on_selection_changed(self): selected = self.customPlot.selectedPlottables() if not selected: return for plottable in selected: # 确保是折线图 if isinstance(plottable, qcp.QCPGraph): # 获取选中的数据点(返回的是QCPDataSelection对象,我们需要进一步获取数据点) data_selection = plottable.selection() # 获取选中的数据点的索引 data_points = data_selection.dataRanges() for data_range in data_points: # 遍历选中的数据范围(因为我们允许选择单个点,所以范围通常是一个点) begin = data_range.begin() end = data_range.end() # 注意:begin和end是索引,但QCPGraph的数据是连续的,我们可以通过graph的data()方法获取数据 data = plottable.data() for i in range(begin, end): if data.at(i): point = data.at(i) print(f"Selected point: x={point.key}, y={point.value}") if __name__ == "__main__": app = QtWidgets.QApplication(sys.argv) window = MainWindow() window.show() sys.exit(app.exec_()) ``` ### 注意事项 1. **QCustomPlot的Python绑定安装**:根据引用[3],QCustomPlot2的Python绑定可能没有完善的文档,需要自行探索。通常,我们可以通过`pyqtgraph`(它集成了QCustomPlot)或者单独安装`qcustomplot`的Python包(如`pyqcustomplot`)来使用。但请注意,上述代码中使用的`import qcustomplot as qcp`假设已经安装了相应的Python绑定。如果没有,可能需要从源码编译或寻找其他方式。 2. **选择类型**:`setSelectable`方法中,我们使用`stSingleData`表示可以选择单个数据点。也可以使用`stMultipleDataRanges`来选择多个数据点,但需要更复杂的处理。 3. **性能考虑**:对于大量数据点,选择操作可能会影响性能,因此建议限制显示的数据点数量或使用高性能模式(如引用[2]提到的QCustomPlot的高性能特性)。 ### 引用说明 - 我们使用了QCustom
评论 9
成就一亿技术人!
拼手气红包6.0元
还能输入1000个字符
 
红包 添加红包
表情包 插入表情
 条评论被折叠 查看
添加红包

请填写红包祝福语或标题

红包个数最小为10个

红包金额最低5元

当前余额3.43前往充值 >
需支付:10.00
成就一亿技术人!
领取后你会自动成为博主和红包主的粉丝 规则
hope_wisdom
发出的红包
实付
使用余额支付
点击重新获取
扫码支付
钱包余额 0

抵扣说明:

1.余额是钱包充值的虚拟货币,按照1:1的比例进行支付金额的抵扣。
2.余额无法直接购买下载,可以购买VIP、付费专栏及课程。

余额充值