


 这篇博客分享了一种在ECharts中根据经纬度显示小红旗图标的方法,通过自定义渲染项在地图上标记数据点,并根据数值改变颜色。同时,提供了完整的HTML和JavaScript代码示例,适用于地理数据可视化。
自己做个笔记也希望给有需要的朋友一些思路,有些也是cv来的O(∩_∩)O
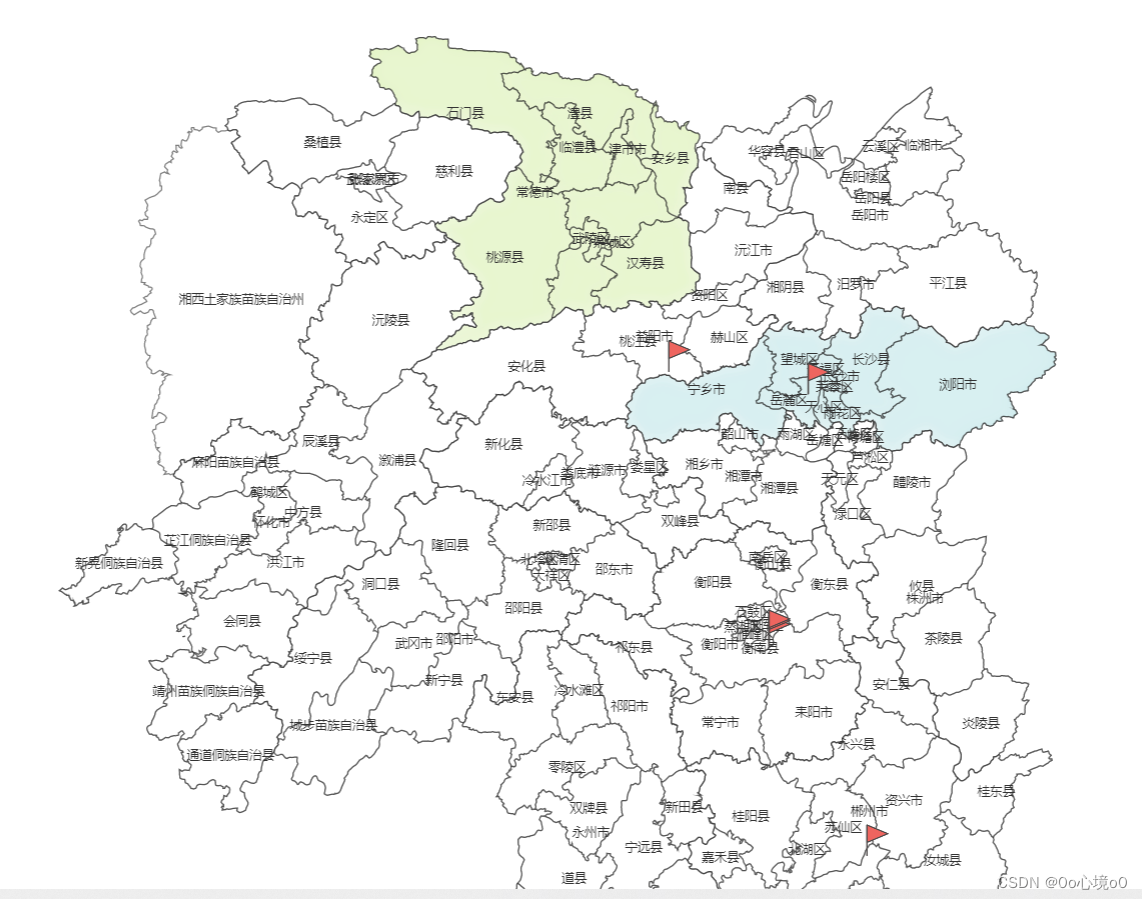
效果就是这个样子,也可根据数值显示不同的颜色;
小红旗也可以换成任何图标
--直接上demo代码
<!DOCTYPE html>
<html>
	<head>
		<meta charset="utf-8" />
		<title></title>
		<style>
			#chart {
				width: 100%;
				height: 1000px;
				border: 1px solid #999;
			}
		</style>
	</head>
	<body>
		<div id="chart">
		</div>
		<script src="https://cdn.staticfile.org/jquery/1.10.2/jquery.min.js" type="text/javascript" charset="utf-8">
		</script>
		<script src="https://cdn.staticfile.org/echarts/4.3.0/echarts.min.js" type="text/javascript" charset="utf-8">
		</script>
		<script>
			/**
			 * 根据dataTemp里的经纬度在地图上显示小红旗
			 */
			var dataTemp = [

				{
					lng: "112.055042",
					num: 10,
					time: "2020-03-19 08",
					stationname: "太古小学(鄞州)",
					lat: "28.470066",

				},
				{

					lng: "112.819549",
					num: 15,
					time: "2020-03-19 08",
					stationname: "万里学院(鄞州)",
					lat: "28.347458",

				},
				{
					lng: "112.604714",
					num: 35,
					time: "2020-03-19 08",
					stationname: "石鼓区",
					lat: "26.96244",
				},
				{
					lng: "112.604714",
					num: 35,
					time: "2020-03-19 08",
					stationname: "石鼓区01",
					lat: "26.98244",
				},
				{
					lng: "112.604714",
					num: 35,
					time: "2020-03-19 08",
					stationname: "石鼓区02",
					lat: "26.99244",
				},
				{
					lng: "113.142071",
					num: 35,
					time: "2020-03-19 08",
					stationname: "郴州市01",
					lat: "25.813202",
				}
			];

			function addImage(url, params, api, realData) {
				return {
					type: 'image',
					style: {
						image: url,
						x: api.coord([
							realData[params.dataIndex].lng, realData[params.dataIndex]
							.lat
						])[0],
						y: api.coord([
							realData[params.dataIndex].lng, realData[params.dataIndex].lat
						])[1],
						width: 40,
						height: 29,
					}
				}
			}
			var uploadedDataURL = "./430000_full.json";
			var myChart = echarts.init(document.getElementById('chart'));
			$.getJSON(uploadedDataURL, function(usaJson) {
				myChart.hideLoading();
				echarts.registerMap('hunan', usaJson);
				var option = {
					visualMap: {
						min: 500,
						max: 5000,
				  text: ['High', 'Low'],
						realtime: false,
						calculable: true,
						seriesIndex: 0,
						inRange: {
							color: ['lightskyblue', 'yellow', 'orangered']
						}
					},
					legend: {
						// x: '160px',
						// y: '30px',
						show: true,
						orient: "vertical",
						top: "middle",
						right: 0,
						dataTemp: [{
							name: 'num',
							icon: 'image://jcd_11.jpg'
						}],
						textStyle: {
							color: '#ff5500',
							fontSize: '24' // 图例文字颜色
						},
						icon: 'image://jcd_1.png',
						itemWidth: 90, // 图例图形宽度
						itemHeight: 60,

					},
					title: {
						show: true, // 显示策略,默认值true,可选为:true(显示) | false(隐藏)
						text: '测试DEMO', // 主标题文本,'\n'指定换行
						link: '', // 主标题文本超链接,默认值true
						target: null, // 指定窗口打开主标题超链接,支持'self' | 'blank',不指定等同为'blank'(新窗口)
						subtext: '2022-5-24', // 副标题文本,'\n'指定换行
						sublink: '', // 副标题文本超链接
						subtarget: null, // 指定窗口打开副标题超链接,支持'self' | 'blank',不指定等同为'blank'(新窗口)
						x: 'left', // 水平安放位置,默认为'left',可选为:'center' | 'left' | 'right' | {number}(x坐标,单位px)
						y: 'top', // 垂直安放位置,默认为top,可选为:'top' | 'bottom' | 'center' | {number}(y坐标,单位px)
						textAlign: null, // 水平对齐方式,默认根据x设置自动调整,可选为: left' | 'right' | 'center
						backgroundColor: 'rgba(0,0,0,0)', //标题背景颜色,默认'rgba(0,0,0,0)'透明
						borderColor: '#ccc', // 标题边框颜色,默认'#ccc'
						borderWidth: 0, // 标题边框线宽,单位px,默认为0(无边框)
						padding: 30, // 标题内边距,单位px,默认各方向内边距为5,接受数组分别设定上右下左边距
						itemGap: 10, // 主副标题纵向间隔,单位px,默认为10
						textStyle: { // 主标题文本样式{"fontSize": 18,"fontWeight": "bolder","color": "#333"}
							fontFamily: 'Arial',
							fontSize: 24,
							fontStyle: 'normal',
							fontWeight: 'normal',
						},
						subtextStyle: { // 副标题文本样式{"color": "#aaa"}
							fontFamily: 'Arial, Verdana, sans...',
							fontSize: 24,
							fontStyle: 'normal',
							fontWeight: 'normal',
						}
					},
					tooltip: {
						trigger: 'item',
						formatter: function(params) {

							if (undefined == params.data) {
								return
							} else if (undefined == params.data.num) {
								return
							}
							return params.data.stationname + ' : ' + params.data.num;
						}
					},
					geo: {
						show: true,
						map: "hunan",
						roam: true, //开启拖拽
						scaleLimit: {
							min: 1,
							max: 10
						},
						zoom: 1,
						aspectScale: 1,
						top: 30,
						itemStyle: {
							normal: {
								borderColor: "rgba(0, 0, 0, 0.5)",
								areaColor: "rgba(255, 255, 255, 0.5)",
								borderWidth: 1,
								shadowBlur: 10,
								shadowColor: "rgba(255, 255, 255, 0.5)"
							},
							emphasis: {
								show: false,
								areaColor: "#31d2ff"
							}
						},

						label: {
							normal: {
								show: true,
								fontSize: "10",
								color: "#333333"

							},
							emphasis: {
								show: true
							}
						}
					},
					series: [{
							// name: '地图1',
							type: 'map',
							geoIndex: 0, //指定geo属性后,series-map.map 属性,以及 series-map.itemStyle 等样式配置不再起作用,而是采用 geo 中的相应属性。
							map: 'hunan',
							data: [{
									name: "长沙市",
									value: 800,
								},
								{
									name: "常德市",
									value: 1600,

								}
							]
						},
						{
							name: '小红旗',
							type: 'custom',
							coordinateSystem: 'geo',
							renderItem: function(params, api) { //自定义图标

								if (dataTemp[params.dataIndex].num > 0 && dataTemp[params.dataIndex].num <=
									50) {
									return addImage("./jcd_1.png", params, api, dataTemp);
								}
							},
							data: dataTemp

						},

					]
				};
				myChart.setOption(option);
                /**地图点击事件**/
				myChart.on('click', function(params) {
					console.log(params)

				});
			});
		</script>
	</body>

</html>


 7755
7755

 被折叠的 条评论
为什么被折叠?
被折叠的 条评论
为什么被折叠?
 到【灌水乐园】发言


