


性能基准线称为基准测试
一:关于基准测试
影响的关键因素有:
- 硬件,如服务器配置、 CPU 内存、存储,通常硬件越高级,系统的性能越好;
- 网络,带宽不足也会严重限制系统整体性能表现;
- 负载,不同的用户数,不同的数据量对系统的性能影响也非常大;
- 软件,不同的数据库在不同的操作系统、不同的应用场景下性能表现有很大的不同
应用服务器、网络、缓存可进行水平扩展,达到提高性能和吞吐 的目的 ,但关系型数据库管理系统的水平扩展能力受到很多因素限制,一般只能通过增加缓存层、分库分表及读写分离来减轻面临的压力,对多数使用关系型数据库的应用系统,瓶颈主要在数据库。
1、基准测试使用场景
基准测试可用于测试不同的硬件和应用场景下的数据库系统配置是否合理。
-
模拟更高的负载,预估压力增加可能带来的瓶颈,知道系统在什么负载情况下将无法正常工作,也就是通常说的“容量规划” 作为容量规划的参考,对未来的业务增长规划有所帮助。
-
重现系统中高负载时出现的错误或异常。 当生产环境在高负载情况下出现异常行为时,很多时候并不能即时捕捉到异常的原因,在测试环境中去模拟出现异常时的高负载场景,进行分析并解决问题,是很好的办法。
-
新系统上线前,大致模拟上线之后的用户行为以进行测试,根据测试的结果对系统设计、代码和数据库配置进行调整,使新系统上线即可达到较好的性能状态。
基准测试的结果只做参考,因为数据库的状态一直在改变,随着时间的推移或业务的增长,数据量、请求量、并发量以及数据之间的关系都在发生着变化,还可能有很多功能特性的变化,有 些新功能的影响可能远远大于目前功能的压力总量 ,对容量规划只能做大概的评估,这是数据库系统的基准相比于其他无状态系统测试的不同点。
2、基准测试衡量指标
最关键的衡量指标有:吞吐量、 响应时间、并发量。
- 吞吐量:单位时间内的事务处理能力,常用的单位是 TPS (每秒事务数)
- 响应时间:操作过程里用来响应服务的时间,根据不同的应用可以使用分钟、秒、毫秒和微秒作为单位。通常还会根据响应时间的最大值、最小值以及平均值做分组统计,例如 90% 的运行周期内的响应时间 毫秒, 10% 的运行周期内相应时间是毫秒。
- 并发量是指同时工作的连接数。
分析测试结果时,吞吐量、响应时间、并发量是必须关注的3个基本要素
3、基准测试的原则
明确测试的目标,收集系统状态,例如参数配置、 CPU 使用率、 I/O网络流量统计等
详细记录当时的配置和结果
若几次的测试结果出入很大,需分析原因,查看错误日志等
二:使用 pgbench 进行测试
基准测试规范有: TPC-A TPC-B TPC-C TPC-D TPC-E TPC-W 其中 TPC-C 是经典的衡量在线事务处理( OLTP )系统性能和可伸缩性的基准测试规范,还有比较新的TPC-E。
常见的开源数据库的基准测试工具有 benchmarksql sysbench 等。
PostgreSQL 自带运行基准测试的简单程序 pgbench, pgbench是1个类 TPC-B的基准测试工具,可以执行内置的测试脚本,也可以自定义脚本文件
1、pgbench 的测试结果报告
[postgres@localhost ~]$ /usr/local/pgsql/bin/pgbench -c 4 -j 2 -T 60s -f pgbench_script_for_select.sql -h localhost -p 5432 -U postgres postgres
pgbench (14.4)
starting vacuum...end.
transaction type: pgbench_script_for_select.sql
scaling factor: 1
query mode: simple
number of clients: 4
number of threads: 2
duration: 60 s
number of transactions actually processed: 642861
latency average = 0.373 ms
initial connection time = 11.771 ms
tps = 10716.351636 (without initial connection time)
transaction type :行记录本次测试所使用的测试类型;
scaling factor :记录 pgbench 在初始化时设置的数据量的比例因子;
query mode: 是测试时指定的查询类型,包括 simple 查询协议、 extended 查询协议或prepared 查询协议;
number of clients 是测试时指定的客户端数量;
number of threads 是测试时指定的每个客户端的线程数;
number of transactions per client 是测试时指定的每个客户端运行的事务数
number of transactions actually processed 是测试结束时实际完成的事务数和计划完成的事务数,计划完成的事务数只是客户端数量乘以每个客户端的事务数的值,如果测试成功结束,实际完成的事务数应该和计划完成的事务数相等,如果有事务执行失败,则只显示实际完成的事务数
latency average 是测试过程中的平均响应时间;
最后两行 TPS 的值分别是包含和不包含建立连接开销的 TPS
2、通过内置脚本进行测试
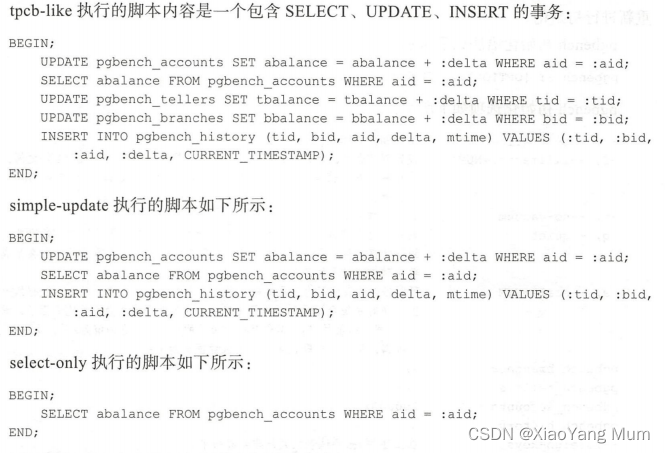
内置测试脚本有 tpcb-like simple-update select-only
查看有哪些集成的测试脚本:
[postgres@localhost ~]$ /usr/local/pgsql/bin/pgbench -b list
Available builtin scripts:
      tpcb-like: <builtin: TPC-B (sort of)>
  simple-update: <builtin: simple update>
    select-only: <builtin: select only>
可以使用下列参数设置内置脚本测试的方式:
- b scriptname[@weight]
–builtin = scriptname[@weight]
例如使用 simple-update 进行测试:
scriptname 参数指定使用哪种脚本进行测试,默认使用 tpcb-like 测试脚本
2.1 使用 simple-update 进行测试
-i (初始化)告诉pgbench初始化指定的数据库意味着pgbench将在postgres数据库中创建以下表。
不进行初始化会进行错误提示:
[postgres@localhost pgsql]$ /usr/local/pgsql/bin/pgbench -b simple-update -h localhost -p 5432 -U postgres postgres -n
pgbench (14.4)
pgbench: fatal: could not count number of branches: ERROR:  relation "pgbench_branches" does not exist
LINE 1: select count(*) from pgbench_branches
                             ^
pgbench: Perhaps you need to do initialization ("pgbench -i") in database "postgres"
[postgres@localhost pgsql]$ pgbench -i postgres
dropping old tables...
NOTICE:  table "pgbench_accounts" does not exist, skipping
NOTICE:  table "pgbench_branches" does not exist, skipping
NOTICE:  table "pgbench_history" does not exist, skipping
NOTICE:  table "pgbench_tellers" does not exist, skipping
creating tables...
generating data (client-side)...
100000 of 100000 tuples (100%) done (elapsed 0.04 s, remaining 0.00 s)
vacuuming...
creating primary keys...
done in 1.26 s (drop tables 0.02 s, create tables 0.51 s, client-side generate 0.36 s, vacuum 0.17 s, primary keys 0.20 s).
[postgres@localhost pgsql]$ psql
psql (14.4)
Type "help" for help.

postgres=# \l
                                  List of databases
   Name    |  Owner   | Encoding |   Collate   |    Ctype    |   Access privileges
-----------+----------+----------+-------------+-------------+-----------------------
 postgres  | postgres | UTF8     | en_US.UTF-8 | en_US.UTF-8 |
 template0 | postgres | UTF8     | en_US.UTF-8 | en_US.UTF-8 | =c/postgres          +
           |          |          |             |             | postgres=CTc/postgres
 template1 | postgres | UTF8     | en_US.UTF-8 | en_US.UTF-8 | =c/postgres          +
           |          |          |             |             | postgres=CTc/postgres
 testdb    | postgres | UTF8     | en_US.UTF-8 | en_US.UTF-8 |
(4 rows)

postgres=# \c postgres
You are now connected to database "postgres" as user "postgres".
postgres=# \dt
              List of relations
 Schema |       Name       | Type  |  Owner
--------+------------------+-------+----------
 public | base_dept        | table | postgres
 public | base_dept1       | table | postgres
 public | orders           | table | postgres
 **public | pgbench_accounts | table | postgres
 public | pgbench_branches | table | postgres
 public | pgbench_history  | table | postgres
 public | pgbench_tellers  | table | postgres**
 public | t_customer       | table | postgres
 public | tb1              | table | postgres
 public | tb1_user_jsonb   | table | postgres
 public | test2            | table | postgres
 public | test_copy        | table | postgres
 public | test_json1       | table | postgres
 public | test_json2       | table | postgres
(14 rows)

[postgres@localhost pgsql]$ /usr/loal/pgsql/bin/pgbench -b simple-update -h localhost -p 5432 -U postgres postgres
pgbench (14.4)
starting vacuum...end.
transaction type: <builtin: simple update>
scaling factor: 1
query mode: simple
number of clients: 1
number of threads: 1
number of transactions per client: 10
number of transactions actually processed: 10/10
latency average = 8.216 ms   --平均响应时间
initial connection time = 5.071 ms    --初始连接时间
tps = 121.719655 (without initial connection time)
2.2 内置脚本混合进行测试
选择3种内置脚本混合进行测试,并在脚本名称后面加上@符号, @符号后面加一个脚本运行比例的权重整数值 ,例如使用 simple-update select-only 两种内置脚本,并且以 2:8 的比例混合进行测试:
[postgres@localhost pgsql]$ /usr/local/pgsql/bin/pgbench -b simple-update@2 -b select-only@8 -b tpcb@0 -h localhost -p 5432 -U postgres postgres
pgbench (14.4)
starting vacuum...end.
transaction type: multiple scripts
scaling factor: 1
query mode: simple
number of clients: 1
number of threads: 1
number of transactions per client: 10
number of transactions actually processed: 10/10
latency average = 2.273 ms
initial connection time = 5.534 ms
tps = 439.869799 (without initial connection time)
SQL script 1: <builtin: simple update>
 - weight: 2 (targets 20.0% of total)
 - 2 transactions (20.0% of total, tps = 87.973960)
 - latency average = 10.440 ms
 - latency stddev = 4.634 ms
SQL script 2: <builtin: select only>
 - weight: 8 (targets 80.0% of total)
 - 8 transactions (80.0% of total, tps = 351.895839)
 - latency average = 0.221 ms     --平均响应时间
 - latency stddev = 0.038 ms     --延迟标准开发
SQL script 3: <builtin: TPC-B (sort of)>
 - weight: 0 (targets 0.0% of total)
 - 0 transactions (0.0% of total, tps = 0.000000)
@前的测试脚本名还可以在名称不冲突的情况下,使用名称的前几个字母进行简写,例如上面的例子就可以将 tpcb-like 简写为 tpcb 甚至t, simple select都是s开头,就不能简写为s了,但可以简写为 si 和se,否则会报错
-b simple-update 可以使用-N或–skip-some-updates 参数简写,-b select-only 可以使用-S或–select-only 简写,但如果在混合测试时,使用这种简写方式,则不能指定它们各自的占比。
使用内置脚本混合测试,最终输出的结果除了常规的报告项之外 ,还会输出每个测试脚本的实际占比,以及每个类型的测试的平均延时、 TPS 等等更加详细的值。使用混合方式的测试,可以方便模拟不同的读写比
3、使用自定义脚本进行测试
支持从一个文件中读取事务脚本来替换默认的事务脚本,达到运行自定义测试场景的目的。
--创建测试表
create table tb1
(
  id serial primary key,
  ival int
);
--运行自定义脚本
echo "select id,ival from tb1 order by id desc limit 10;" > pgbench_script_for_select.sql
/usr/local/pgsql/bin/pgbench -f pgbench_script_for_select.sql -h localhost -p 5432 -U postgres postgres
在脚本中可以使用类似于psql 的以反斜杠开头的元命令和内建函数定义变量。pgbench 自定义脚本支持的元命令有:
\sleep number [ us|ms|s ]: 执行一个事务暂停一定时间,单位可以是微秒、毫秒和秒,如果不写单位,默认使用秒
\set varname expression :用于设置一个变量,元命令、参数和参数的值之间用空格分开 pgbench 定义了一些可以在元命令中使用的函数。
例如自定义1个脚本,在 tbl 表的ival 字段中插入1个随机数并进行基础测试:
[postgres@localhost ~]$ cat pgbench_script_for_insert.sql
\sleep 500 ms
\set ival random(1,10)
insert into tb1(ival) values (:ival);
[postgres@localhost ~]$ /usr/local/pgsql/bin/pgbench -T 300s -f pgbench_script_for_insert.sql.sql -h localhost -p 5432 -U postgres postgres
pgbench: fatal: could not open file "pgbench_script_for_insert.sql.sql": No such file or directory
[postgres@localhost ~]$ /usr/local/pgsql/bin/pgbench -f pgbench_script_for_insert.sql -T 300s -h localhost -p 5432 -U postgres postgres
pgbench (14.4)
starting vacuum...end.
transaction type: pgbench_script_for_insert.sql
scaling factor: 1
query mode: simple
number of clients: 1
number of threads: 1
number of transactions per client: 10
number of transactions actually processed: 10/10   ###
latency average = 516.446 ms   ###平均响应时间
initial connection time = 4.521 ms
tps = 1.936313 (without initial connection time)
postgres=# select count(*) from tb1;
 count
-------
    707
(1 row)

postgres=# select id,ival from tb1 order by id desc limit 3;
 id | ival
----+-------
 10 | 63653
  9 |  1776
  8 | 87916
  ......
(3 rows)
可以看到 INSERT 成功地插入了预期的值,共 707 条记录 pgbench 输出的测告看, 平均延迟( latency average 等于 516 毫秒,成功执行了 707 事务和使用内置脚本一样,可以在 参数值后加上 @符号再加上权重, 以不同比例运行
多个自定义的脚本 权重值并不是1个百分比的值,而是1个相对固定的数值,例如第个脚本运行3次,第二个脚本运行 10 次,下面是 个在多个测试脚本中加人权重值选项进行测试的例子:
[postgres@localhost ~]$ /usr/local/pgsql/bin/pgbench -T 60 -f pgbench_script_for_insert.sql@3 -f pgbench_script_for_select.sql@10 -h localhost -p 5432 -U postgres postgres
pgbench (14.4)
starting vacuum...end.
transaction type: multiple scripts
scaling factor: 1
query mode: simple
number of clients: 1
number of threads: 1
duration: 60 s
number of transactions actually processed: 501
latency average = 120.028 ms
initial connection time = 4.934 ms
tps = 8.331382 (without initial connection time)
SQL script 1: pgbench_script_for_insert.sql
 - weight: 3 (targets 23.1% of total)
 - 116 transactions (23.2% of total, tps = 1.929023)
 - latency average = 517.601 ms
 - latency stddev = 10.773 ms
SQL script 2: pgbench_script_for_select.sql
 - weight: 10 (targets 76.9% of total)
 - 385 transactions (76.8% of total, tps = 6.402360)
 - latency average = 0.238 ms
 - latency stddev = 0.123 ms
4、其他选项
4.1.模拟的客户端数量和连接方式
-c 客户端的数量,即并发数据库的连接数量,默认值1
-C 为每个事务创建1个新的连接,若每次都创建新连接性能会显著下降,测试连接池性能时可用
示例:模拟4个客户端连接:
[postgres@localhost ~]$ /usr/local/pgsql/bin/pgbench -c 4 -h localhost -p 5432 -U postgres postgres
number of clients: 4
...
latency average = 34.447 ms
initial connection time = 23.269 ms
tps = 116.120754 (without initial connection time)
示例:模拟每个事务创建新的连接:
[postgres@localhost ~]$ /usr/local/pgsql/bin/pgbench -c 4 -C -h localhost -p 5432 -U postgres postgres
number of clients: 4
...
latency average = 61.011 ms
average connection time = 4.888 ms
tps = 165.561625 (including reconnection times)
-j 线程数,多线程 CPU上进行测试,将模拟的客户端平均分配在各线程上
4.2.单次测试的运行时间
-T seconds或–time=seconds 设置测试的秒数;示例:测试1小时,-T 3600
-t transactions或–transactions=transactions 指定每个客户端运行多少个固定量的事务就结束本次测试,默认10个
-T和-t 两种方式每次只能使用1种,要么指定准确的测试时间, 要么指定一共执行多少个事务后结束
如果这两个参数都没有指定, 那么 pgbench 默认使用第二种方式-t
[postgres@localhost ~]$ /usr/local/pgsql/bin/pgbench -f pgbench_script_for_insert.sql -c 4 -h localhost -p 5432 -U
number of clients: 4
...
number of transactions actually processed: 40/40
由于只指定了4个客户端,没有指定运行时间或总的执行事务个数, 所以测试报“实际执行成功的事务数” “期望执行的事务数”是 40
4.3.超出阈值的事务的报告
-L 设置1个阈值,对超过该阈值的事务进行独立报告和计数,单位是毫秒
[postgres@localhost ~]$ /usr/local/pgsql/bin/pgbench -T 10 -L 1 -c 8 -j 8 -f pgbench_script_for_select.sql -h localhost -p 5432 -U postgres postgres
...
number of transactions actually processed: 113482
number of transactions above the 1.0 ms latency limit: 883/113482 (0.778 %)
超过1秒阔值的事务有 883个,占到实际执行事务总数的0.778%
4.4.输出选项
-d 输出debug信息,通常不使用
-P 每隔一段时间输出一次测试结果
示例:每隔2秒输出一次测试结果
[postgres@localhost ~]$ /usr/local/pgsql/bin/pgbench -P 2 -T 7200  -c 8 -j 8 -f pgbench_script_for_select.sql -h localhost -p 5432 -U postgres postgres
progress: 2.0 s, 10921.5 tps, lat 0.721 ms stddev 0.252
progress: 4.0 s, 11502.2 tps, lat 0.695 ms stddev 0.064
progress: 6.0 s, 11393.3 tps, lat 0.702 ms stddev 0.216
progress: 8.0 s, 11144.9 tps, lat 0.717 ms stddev 0.064
...
-l 或–log 将每1个事务执行的时间写入名为"pgbench_log.n" 的日志文件,若使用-j指定使用多个线程会生成"pgbench_log.n.m"的日志文件。n:测试时pgbench的PID,m:从1开始的线程序号,pgbench_log默认的日志文件前缀,若自定义前缀,使用–log-prefix prefix_name
[postgres@localhost ~]$ /usr/local/pgsql/bin/pgbench  -T 10  -l --log-prefix=pgbench_select_log -c 6 -j 2 -f pgbench_script_for_select.sql -h localhost -p 5432 -U postgres postgres
[postgres@localhost ~]$ ls -l
-rw-rw-r--  1 postgres postgres 1692991 Dec  1 13:06 pgbench_select_log.60798
-rw-rw-r--  1 postgres postgres 1697029 Dec  1 13:06 pgbench_select_log.60798.1
内容格式如下:
client_id   transaction_no time script_no time_epoch time_us [ schedule_lag ]
   3               4        421     0     1669871183 127015
   4               4        422     0     1669871183 127210
   4               5        184     0     1669871183 127400
client_id:客户端的序号id
transaction_no:事务的序号
time:该事务所花费的时间,单位:微秒
script_no:使用了多个脚本时, script_no 标识该事务使用的是哪个脚本;
time_epoch/time_us 是一 Unix 纪元格式的时间戳以及1个显示事务完成时间的以微秒计的偏移量
5、优劣势
经过测试,发现pg_bench有以下优劣点:
优势:
1.系统自带,与postgresql兼容性好,且配置方便
2.工具小,执行速度快
3.开源软件,可在网上找到各种功能插件
劣势:
1.测量结果浮动较大,就多次实验来看,测量结果从40tps到400tps都出现过,统计后发现绝大多数执行结果落在350~400区间。故使用时须多次执行,取合适的值。
2.无法中断。执行过程中无法中断测试操作,就算kill了pg_bench进程,他的脚本也已经进入postgresql,postgresql依然会继续跑测试。只能等着他跑完。
————————————————
版权声明:本文为CSDN博主「aladdin_sun」的原创文章,遵循CC 4.0 BY-SA版权协议,转载请附上原文出处链接及本声明。
原文链接:https://blog.csdn.net/sunbocong/article/details/80021146


 1万+
1万+


 被折叠的 条评论
为什么被折叠?
被折叠的 条评论
为什么被折叠?
 到【灌水乐园】发言


