Echart(v5)实现中国地图区域图

一、需求背景

        需要实现一个中国地图的区域图(区域级别到市),并且指定区域可以高亮。

二、相关工具

        1、中国的GeoJSON数据获取:DataV.GeoAtlas地理小工具系列

        2、Echart组件库 Apache ECharts

三、实现

        echart配置:

const options = {
  series:[{
    type: 'map',
    map: 'china',
    roam: true, //缩放,开启缩放或者平移,可以设置成 'scale' 或者 'move', true都开启
    zoom: 1,          // 地图放大
    aspectScale: 0.8, //地图宽高比例
    nameProperty: 'name', //关联关键数据geojson数据中的关键key 
    emphasis: {
      disabled: true //关闭高亮
    },
    itemStyle: {
      normal: {
        areaColor: 'rgba(27, 73, 135, 0.3)',
        borderColor: 'rgba(58, 128, 177, 0.4)',
      },
    },
    select: {
      disabled: true
    },
    tooltip: {
      trigger: "item",
      show: true,
      formatter: (params: any) => {
        console.log(params)
        return 'zyk';
      }
    },
    //todo 根据添加的地点,确定data里的数据,精确到市
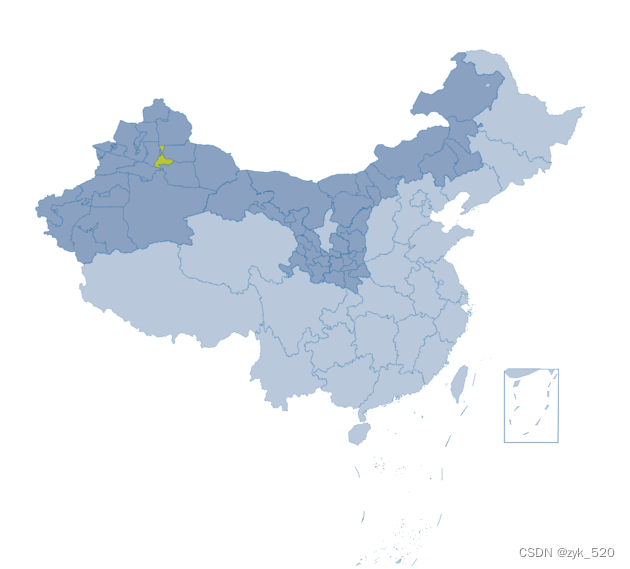
    data: [{
      name: '乌鲁木齐市',
      value: 66,
      //自定义特殊 tooltip,仅对该数据项有效
      tooltip:{
        formatter:(val:any)=>{
          debugger
          console.log(val)
          return '666'
        }
      },
      itemStyle: {
        areaColor: 'yellow',
        color: 'yellow'
      }
    }]
  }]
}

const MyChart = echarts.init(document.getElementById("map-container"));
echarts.registerMap("china", chinaMap);
MyChart.setOption(options);

关键注释:

        【1】echarts.registerMap("china", chinaMap); //注册地图

                // params1:map的名称,必须与options.series中的map字段一致

                // params2:  chinaMap,中国的GeoJSON

效果图:


  • 0
    点赞
  • 0
    收藏
    觉得还不错? 一键收藏
  • 0
    评论
抱歉,作为AI语言模型,我无法生成实际代码。以下是YOLO v5的Python代码示例,供您参考: 1. 导入必要的库 ```python import torch import cv2 import numpy as np from PIL import Image from torchvision import transforms from models.experimental import attempt_load from utils.general import non_max_suppression, scale_coords from utils.plots import plot_one_box ``` 2. 定义函数 ```python def detect(image_path, weights_path, conf_thres=0.25, iou_thres=0.45, device='cpu'): # Load model model = attempt_load(weights_path, map_location=device) # Set model to evaluation mode model.eval() # Define transforms for input image transform = transforms.Compose([ transforms.Resize((640, 640)), transforms.ToTensor(), transforms.Normalize(mean=[0.485, 0.456, 0.406], std=[0.229, 0.224, 0.225]) ]) # Load image img = Image.open(image_path) # Apply transforms img = transform(img).unsqueeze(0) # Move image to device img = img.to(device) # Make predictions with torch.no_grad(): # Get prediction pred = model(img) # Apply non-maximum suppression pred = non_max_suppression(pred, conf_thres, iou_thres) # Get image size img_size = img.shape[-2:] # Get prediction boxes and labels boxes = [] labels = [] scores = [] for i, det in enumerate(pred): # Rescale boxes from 640 to image size det[:, :4] = scale_coords(img.shape[2:], det[:, :4], img_size).round() for *xyxy, conf, cls in reversed(det): label = model.names[int(cls)] score = float(conf) # Add box and label to lists boxes.append(xyxy) labels.append(label) scores.append(score) return boxes, labels, scores ``` 3. 运行检测 ```python if __name__ == '__main__': # Define device (GPU or CPU) device = torch.device('cuda:0' if torch.cuda.is_available() else 'cpu') # Define paths to image and model weights image_path = 'path/to/image.jpg' weights_path = 'path/to/weights.pt' # Run detection boxes, labels, scores = detect(image_path, weights_path, device=device) # Load image img = cv2.imread(image_path) # Plot boxes on image for box, label, score in zip(boxes, labels, scores): plot_one_box(box, img, label=label, color=(0, 255, 0), line_thickness=2) # Show image cv2.imshow('Detection', img) cv2.waitKey(0) cv2.destroyAllWindows() ```

“相关推荐”对你有帮助么?

  • 非常没帮助
  • 没帮助
  • 一般
  • 有帮助
  • 非常有帮助
提交
评论
添加红包

请填写红包祝福语或标题

红包个数最小为10个

红包金额最低5元

当前余额3.43前往充值 >
需支付:10.00
成就一亿技术人!
领取后你会自动成为博主和红包主的粉丝 规则
hope_wisdom
发出的红包
实付
使用余额支付
点击重新获取
扫码支付
钱包余额 0

抵扣说明:

1.余额是钱包充值的虚拟货币,按照1:1的比例进行支付金额的抵扣。
2.余额无法直接购买下载,可以购买VIP、付费专栏及课程。

余额充值