


 文章介绍了如何在Vue组件中使用ECharts库创建一个可交互的饼图,展示网站的访问来源,包括南丁格尔玫瑰图的显示与隐藏以及自定义legend的值显示。通过鼠标移动事件控制图表的动态变化。
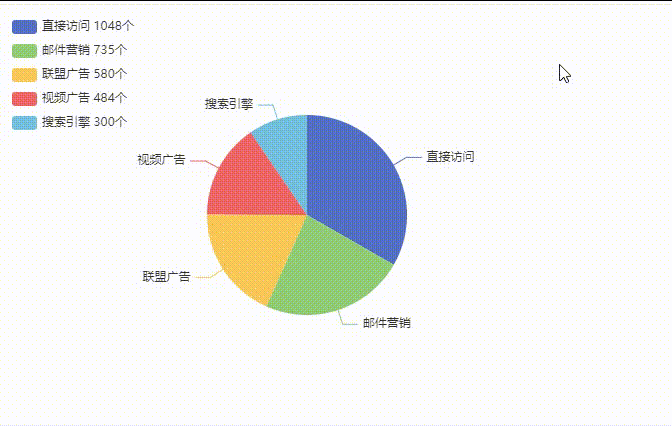
变换成南丁格尔玫瑰图显示百分比,还原取消显示,自定义legend显示值
效果参考下图:
直接上代码:
<template>
  <div>
    <div id="pieChart" style="width: 600px; height: 400px;"></div>
  </div>
</template>

<script>
    export default {
    name: 'tem',
    components: {

    },
    data() {
      return {

      }
    },
    created() {

    },
    computed:{

    },
    mounted() {
        // 初始化饼图
        var chartContainer = echarts.init(document.getElementById('pieChart'));

        // 定义数据
        var data = [
          { value: 1048, name: '直接访问' },
          { value: 735, name: '邮件营销' },
          { value: 580, name: '联盟广告' },
          { value: 484, name: '视频广告' },
          { value: 300, name: '搜索引擎' }
        ];

        // 配置项
        var option = {
          // title: {
          //   text: 'Referer of a Website',
          //   subtext: 'Fake Data',
          //   left: 'center'
          // },
          tooltip: {
            trigger: 'item'
          },
          legend: {
            orient: 'vertical',
            left: 'left',
            formatter: function (name) {
              let v;
              data.forEach((item) => {
                if (item.name === name) {
                  v = item.value;
                }
              });
              return name + ' ' + v + '个';
            },
          },
          series: [
            {
              // name: 'Access From',
              type: 'pie',
              radius: '50%',
              data: data,
              emphasis: {
                itemStyle: {
                  shadowBlur: 10,
                  shadowOffsetX: 0,
                  shadowColor: 'rgba(0, 0, 0, 0.5)'
                }
              }
            }
          ]
        };

        // 将配置项设置给饼图
        chartContainer.setOption(option);

        // 添加鼠标移动事件处理函数
        function handleMouseMoveEvent(params) {
          option.series[0].radius = [20, 150]
          option.series[0].center = ['50%', '50%']
          option.series[0].roseType = 'area'
          option.series[0].itemStyle = {
            borderRadius: 8
          }
          option.series[0].label = {
            show: true,
            position: 'inner',
            formatter:'{d}%',
            color:'#fff',
            fontSize: 14
          }
          chartContainer.setOption(option);
        }
        // 添加鼠标移动事件处理函数
        function handleMouseMoveOutEvent(params) {
          option.series[0].roseType = false
          option.series[0].radius = '50%'
          option.series[0].itemStyle = {
            borderRadius: 0
          }
          option.series[0].label = {
            show: false,
          }
          chartContainer.setOption(option);
        }
        // 注册鼠标移动事件
        chartContainer.on('mouseover', handleMouseMoveEvent);
        chartContainer.on('mouseout', handleMouseMoveOutEvent);
    },
</script>


 1710
1710


 被折叠的 条评论
为什么被折叠?
被折叠的 条评论
为什么被折叠?
 到【灌水乐园】发言


