


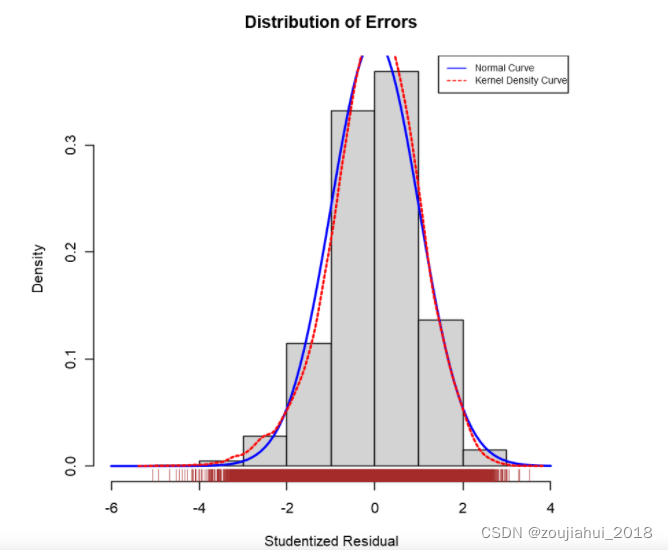
 该博客展示了如何使用R语言的`residplot`函数来绘制学生化残差的直方图,并与正态分布和核密度曲线进行比较。通过这种方式,可以评估回归模型的误差分布是否符合正态假设。
residplot<-function(fit,nbreaks=10){
    z<-rstudent(fit)
    hist(z,breaks = nbreaks,freq = FALSE,xlab = 'Studentized Residual',main='Distribution of Errors')
    rug(jitter(z),col = 'brown')
    curve(dnorm(x,mean = mean(z),sd=sd(z)),add=TRUE,col='blue',lwd=2)
    lines(density(z)$x,density(z)$y,col='red',lwd=2,lty=2)
    legend('topright',legend = c('Normal Curve','Kernel Density Curve'),lty=1:2,col=c('blue','red'),cex = 0.7)
}
residplot(m_step)
效果如下:
参考来源:
《R语言实战》(第二版) Robert I. Kabacoff著


 被折叠的 条评论
为什么被折叠?
被折叠的 条评论
为什么被折叠?
 到【灌水乐园】发言


