


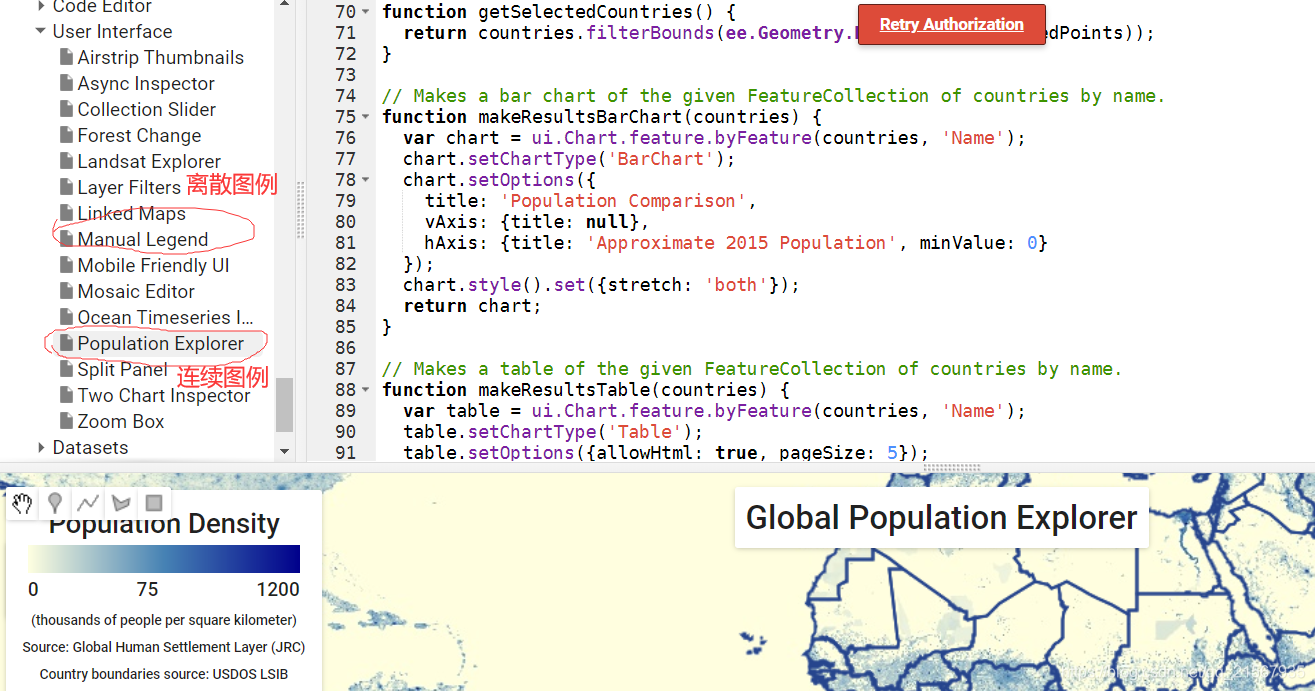
在GEE图形界面左侧示例代码里有关于连续数据及离散型数据图例的代码:
这种图例是放置在Panel上独立于Map组件
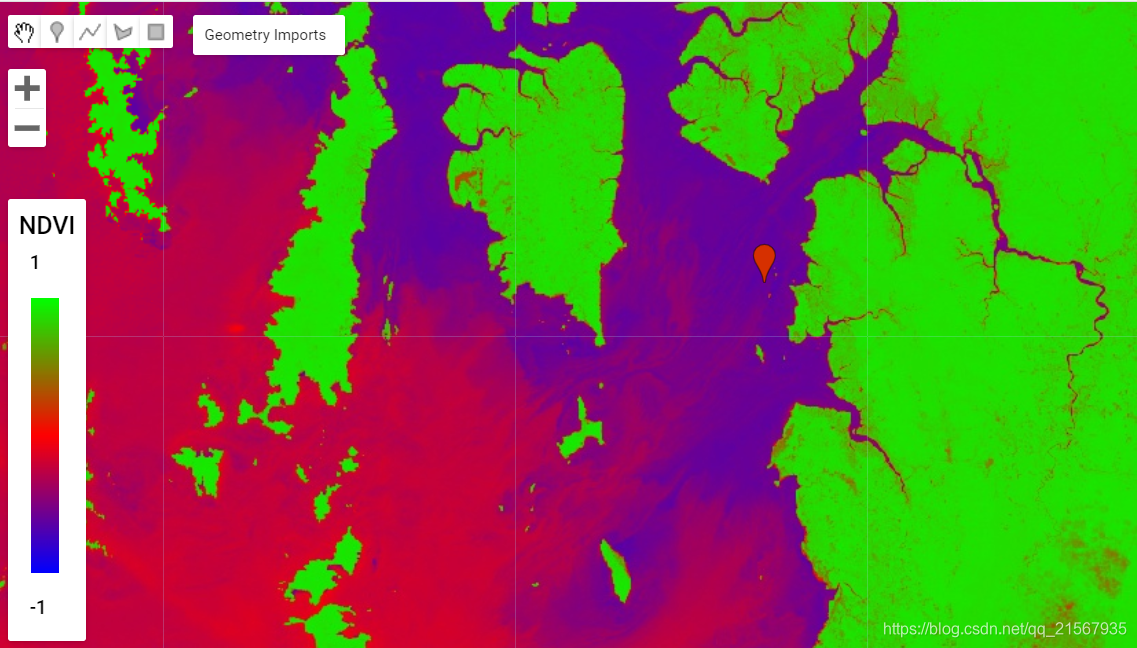
关于连续图例的原理
就是利用经纬度图像(ee.Image.pixelLonLat()),将其伸缩到在与你图相同的[min,max]范围内,然后用同样的色带去渲染,因为经纬度图像值是连续的,所以你就会获得一条连续的色带,然后将其变成缩略图(Thumbnail)配上等间距标注放置在你的Panel上。
简单的例子——垂直连续图例
https://code.earthengine.google.com/e850b931faff7c542cd3bb619c9f0216
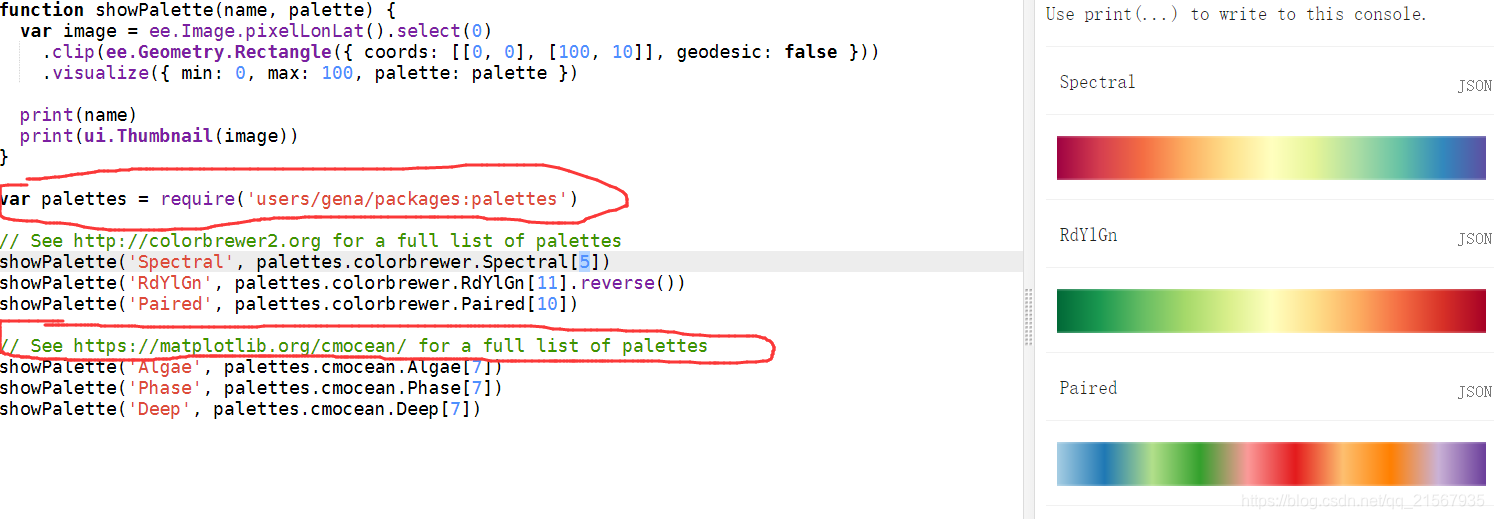
关于色带
谈到连续数据的表达,就逃不开色带的选择
这是官方的一些色带链接,里面详细介绍了各种色带还有介绍网站,用户可以按照自己喜好选取并调整适合想要的色带。
https://code.earthengine.google.com/60a31219c81b4bfcc86e30655c82c8ff
下面讲讲内置图例和出图
1.内置图例 (原理就是之前的文字标注加经纬度色带)
https://code.earthengine.google.com/0eb05a522875a71ae87165a2ed830c7f
var scale = style.ScaleBar.draw(geometryScaleBar, {
  steps:4, palette: ['5ab4ac', 'f5f5f5'], multiplier: 1000, format: '%.1f', units: 'km', text: textProperties
})
注意这里面的geometryScaleBar是图例的对角线,也就是图里的红线。所以你绘制图例之前需先画它的对角线。
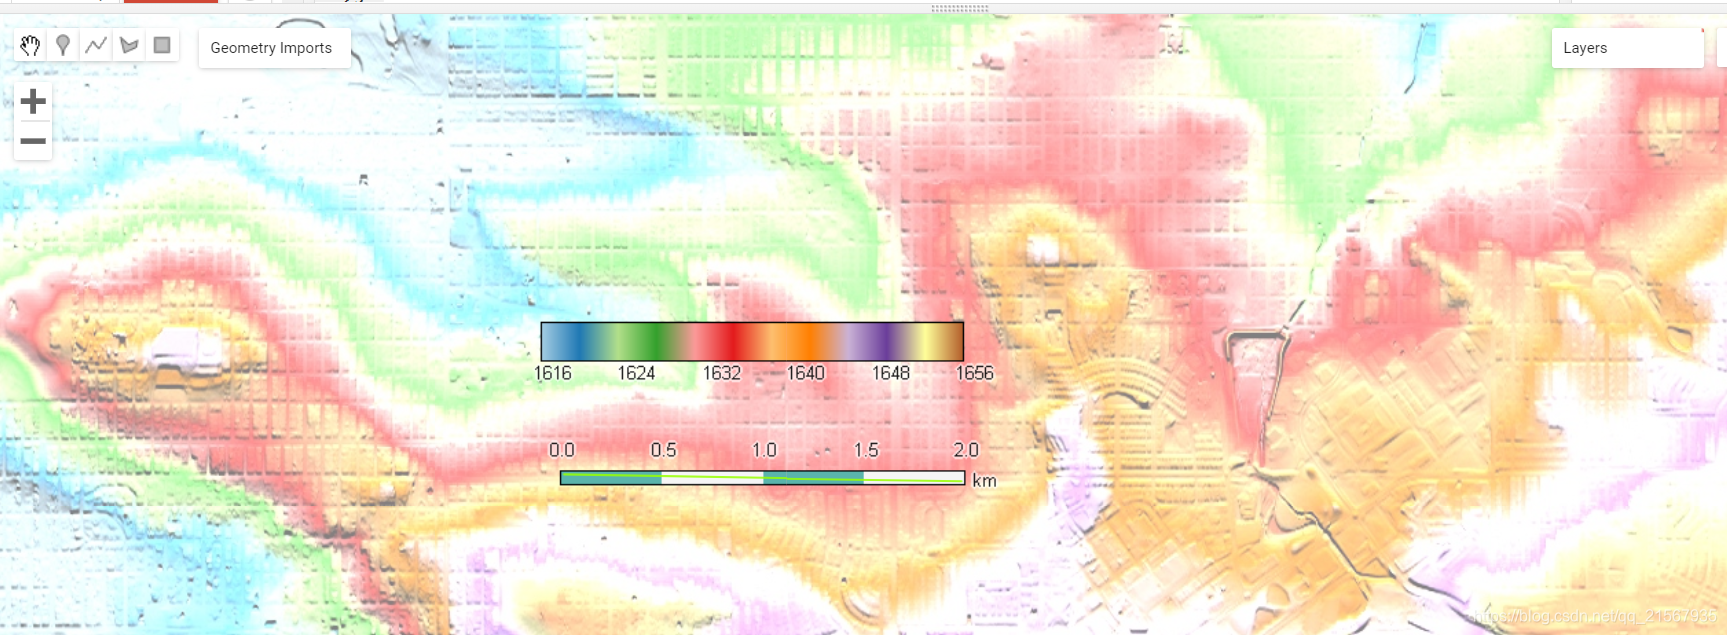
2.出图(将图和图例一并导出)
https://code.earthengine.google.com/6577ae823bb5b2a9e4688ad1c006110a

Python代码——内置图例
!!!使用Python代码前有一个问题需要用户须知!!!是关于scale参数设置的问题,这个最好你在网页编辑器页面地图放缩到合适的尺度,运行print(Map,getScale)代码输出一下当前页面的scale。当使用相应的scale时,你的图例在这个尺度下看起来最舒服。所以你依据你结果图像的范围确定好你的比例尺将在什么尺度下展示给用户。
函数部分(包括昨天发的drawText函数)
import ee
import ee.mapclient
ee.Initialize()

def ranslate(coord, x, y):
    x1 = ee.Number(coord.get(0)).subtract(x)
    y1 = ee.Number(coord.get(1)).subtract(y)
    return ee.List([x1, y1])

def drawText(text, pos, scale, props):
    text = ee.String(text)
    ascii = {}
    for i in range(32, 128):
        ascii[chr(i%256)] = i
    ascii = ee.Dictionary(ascii)
    fontSize = "16"
    if props and ('fontSize' in props.keys()):
        fontSizee = str(props['fontSize'])

    fontType = "Arial"
    if props and ('fontType' in props.keys()):
        fontSize = str(props['fontType'])

    glyphs = ee.Image('users/gena/fonts/' + fontType + fontSize)
    if props and ('resample' in props.keys()):
        glyphs = glyphs.resample(props['resample'])

    proj = glyphs.projection()
    s = ee.Number(1).divide(proj.nominalScale())
    north = ee.Algorithms.If(proj.transform().index("-1.0").lt(0), -1, 1)
    glyphs = glyphs.changeProj(proj, proj.scale(s, s.multiply(north)))
    class newfont:
        def __init__(self):
            self.height = ee.Number(glyphs.get('height'))
            self.width = ee.Number(glyphs.get('width'))
            self.cellHeight = ee.Number(glyphs.get('cell_height'))
            self.cellWidth = ee.Number(glyphs.get('cell_width'))
            self.charWidths = ee.List(list(map(int, ee.String(glyphs.get('char_widths')).split(',').getInfo())))
    font = newfont()
    font.columns = font.width.divide(font.cellWidth).floor()
    font.rows = font.height.divide(font.cellHeight).floor()

    def toAscii(text):
        def fun(char, prev):
            return ee.List(prev).add(ascii.get(char))
        return ee.List(text.split('').iterate(fun, ee.List([])))

    def moveChar(image, xmin, xmax, ymin, ymax, x, y):
        ll = ee.Image.pixelLonLat()
        nxy = ll.floor().round().changeProj(ll.projection(), image.projection())
        nx = nxy.select(0)
        ny = nxy.select(1)
        mask =nx.gte(xmin).add(nx.lt(xmax)).add(ny.gte(ymin)).add(ny.lt(ymax)).eq(4)
        return image.mask(mask).translate(ee.Number(xmin).multiply(-1).add(x), ee.Number(ymin).multiply(-1).subtract(y))

    codes = toAscii(text)

    def getwidth(code):
        return ee.Number(font.charWidths.get(ee.Number(code)))

    charWidths = codes.map(getwidth)
    alignX = 0
    alignY = 0
    alignX = ee.Number(charWidths.reduce(ee.Reducer.sum())).divide(2)
    alignY = ee.Number(font.cellHeight).divide(ee.Number(2).multiply(north))

    if props and ('alignX' in props.keys()):
        if props['alignX'] == 'center':
            alignX = ee.Number(charWidths.reduce(ee.Reducer.sum())).divide(2)
        elif props['alignX'] == 'left':
            alignX = 0
        elif props['alignX'] == 'right':
            alignX = ee.Number(charWidths.reduce(ee.Reducer.sum()))

    if props and ('alignY' in props.keys()):
        if props['alignY'] == 'center':
            alignY = ee.Number(font.cellHeight).divide(ee.Number(2).multiply(north))
        elif props['alignY'] == 'top':
            alignY = 0
        elif props['alignY'] == 'bottom':
            alignY = ee.Number(font.cellHeight)

    def computexpos(w, list):
        list = ee.List(list)
        lastX = ee.Number(list.get(-1))
        x = lastX.add(w)
        return list.add(x)

    charX = ee.List(charWidths.iterate(computexpos, ee.List([0]))).slice(0, -1)
    charPositions = charX.zip(ee.List.sequence(0, charX.size()))

    def computeglyph(code):
        code = ee.Number(code).subtract(32)
        y = code.divide(font.columns).floor().multiply(font.cellHeight)
        x = code.mod(font.columns).multiply(font.cellWidth)
        return [x, y]

    charGlyphPositions = codes.map(computeglyph)
    charGlyphInfo = charGlyphPositions.zip(charWidths).zip(charPositions)
    pos = ee.Geometry(pos).transform(proj, scale).coordinates()
    xpos = ee.Number(pos.get(0)).subtract(ee.Number(alignX).multiply(scale))
    ypos = ee.Number(pos.get(1)).subtract(ee.Number(alignY).multiply(scale))

    def drawglyphs(o):
        o = ee.List(o)
        glyphInfo = ee.List(o.get(0))
        gw = ee.Number(glyphInfo.get(1))
        glyphPosition = ee.List(glyphInfo.get(0))
        gx = ee.Number(glyphPosition.get(0))
        gy = ee.Number(glyphPosition.get(1))
        charPositions = ee.List(o.get(1))
        x = ee.Number(charPositions.get(0))
        i = ee.Number(charPositions.get(1))
        glyph = moveChar(glyphs, gx, gx.add(gw), gy, gy.add(font.cellHeight), x, 0)
        return glyph.changeProj(proj, proj.translate(xpos, ypos).scale(scale, scale))

    textImage = ee.ImageCollection(charGlyphInfo.map(drawglyphs)).mosaic()
    textImage = textImage.mask(textImage)
    if props:
        if 'textColor' in props.keys():
            textColor = props['textColor']
        else:
            textColor = 'ffffff'
        if 'outlineColor' in props.keys():
            outlineColor = props['outlineColor']
        else:
            outlineColor = '000000'
        if 'outlineWidth' in props.keys():
            outlineWidth = props['outlineWidth']
        else:
            outlineWidth = 0
        if 'textOpacity' in props.keys():
            textOpacity = props['textOpacity']
        else:
            textOpacity = 0.9
        if 'textWidth' in props.keys():
            textWidth = props['textWidth']
        else:
            textWidth = 1
        if 'outlineOpacity' in props.keys():
            outlineOpacity = props['outlineOpacity']
        else:
            outlineOpacity = 0.4

        textLine = textImage.visualize("b1", None, None, None, None, None, textOpacity, [textColor], True)

        if textWidth > 1:
            textLine.focal_max(textWidth)

        if not props and (props and(not ('outlineWidth' in props.keys()))):
            return textLine

        textOutline = textImage.focal_max(outlineWidth).visualize("b1", None, None, None, None, None, outlineOpacity, outlineColor, True)
        return ee.ImageCollection.fromImages(ee.List([textOutline, textLine])).mosaic()
    else:
        return textImage


def translate(coord, x, y):
    x1 = ee.Number(coord.get(0)).subtract(x)
    y1 = ee.Number(coord.get(1)).subtract(y)
    return ee.List([x1, y1])


def GradientBar(pos, props, scale):
    palette = ['000000', 'ffffff']
    format = '%.0f'
    round = True
    labels = []
    min = 0
    max = 1

    textProperties = {'fontSize': 16, 'textColor': '000000', 'outlineColor': 'ffffff', 'outlineWidth': 3, 'outlineOpacity': 0.6}

    if props:
        if 'labels' in props.keys():
            labels = props['labels']
        if 'palette' in props.keys():
            palette = props['palette']
        if 'format' in props.keys():
            format = props['format']
        if 'round' in props.keys():
            round = props['round']
        if 'min' in props.keys():
            min = props['min']
        if 'max' in props.keys():
            max = props['max']
        if 'textProperties' in props.keys():
            textProperties = props['textProperties']

    coords = ee.List(pos.bounds().coordinates().get(0))
    pos = ee.Geometry.LineString([coords.get(0), coords.get(2)], None, True)
    p = ee.Number(scale).divide(ee.Image().projection().nominalScale())
    pt0 = ee.List(pos.coordinates().get(0))
    pt1 = ee.List(pos.coordinates().get(1))
    bounds = pos.buffer(scale * 2).bounds()
    ll = ee.List(ee.List(bounds.coordinates().get(0)).get(0))
    ur = ee.List(ee.List(bounds.coordinates().get(0)).get(2))
    width = ee.Number(ur.get(0)).subtract(ll.get(0))
    height = ee.Number(ur.get(1)).subtract(ll.get(1))
    origin = ee.Image.constant(ll.get(0)).addBands(ee.Image.constant(ll.get(1)))
    bar = ee.Image.pixelLonLat().subtract(origin).select(0).divide(width).clip(bounds)
    images = ee.List([bar.visualize(None, None, None, 0, 1, None, None, palette, True),
                      ee.Image().paint(bounds, 1, 1).visualize(None, None, None, None, None, None, None, ['000000'], True)])


    def addlabels(label):
        labelText = ee.Number(label).format(format)
        labelOffset = ee.Number(label).subtract(min).divide(ee.Number(max).subtract(min)).multiply(width)
        point = translate(pt0, labelOffset.multiply(-1).add(p.multiply(8)), p.multiply(8))
        imageLabel = drawText(labelText, ee.Geometry.Point(point), scale, textProperties)
        return imageLabel

    imagesLabel = labels.map(addlabels)
    images = ee.List(images).cat(imagesLabel)
    return ee.ImageCollection.fromImages(images).mosaic()
使用部分(GradientBar函数)
dem = ee.Image("USGS/NED")
min = ee.Number(2.42)
max = ee.Number(2265.67)
labels = ee.List.sequence(min, max, max.subtract(min).divide(5))
geometryGradientBar = ee.Geometry.LineString([[-105.30489055047371, 40.13452287517421], [-95.79073039422371, 40.20168494672089]])
palette = ['ffffff', 'ffb6c3', 'ff8fae', 'ff7ba6', 'ff5c7a', 'ff2d7a']
Gradient = {'min': min, 'max': max, 'palette': palette, 'labels': labels, 'format': '%.0f' }
gradient = GradientBar(geometryGradientBar, Gradient, 2446)
ee.mapclient.addToMap(gradient)
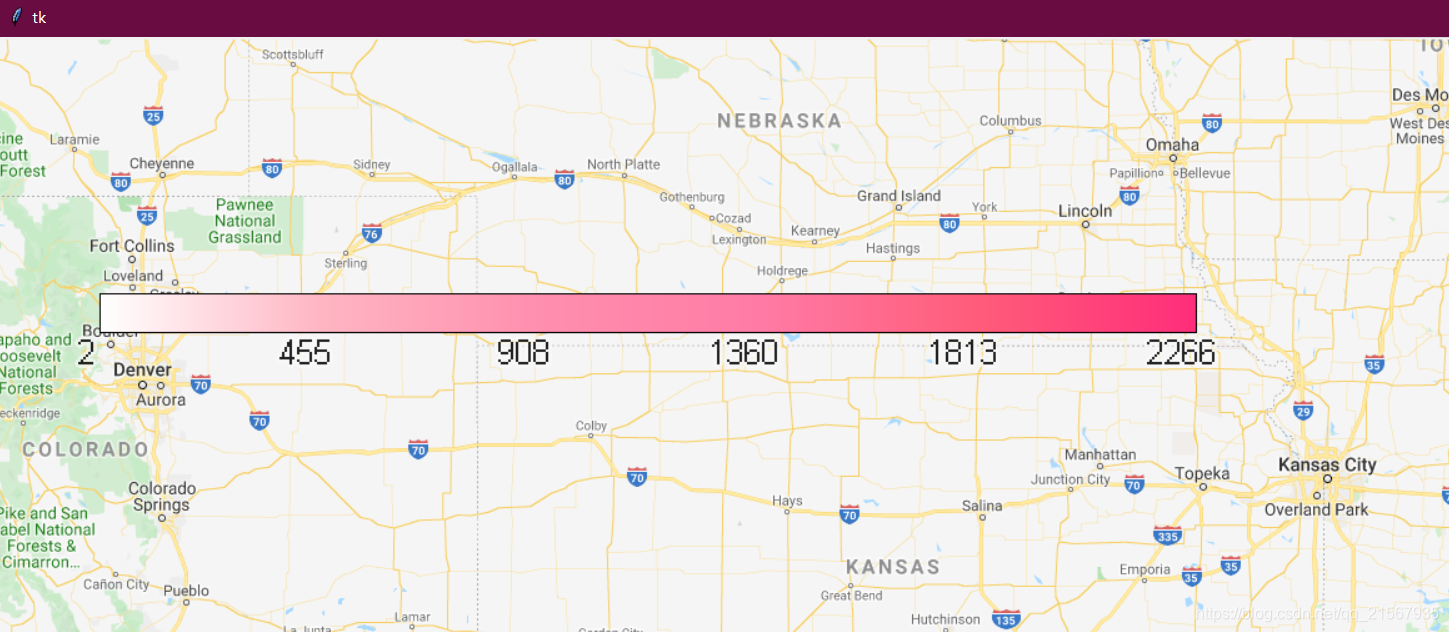
GradientBar(对角线(linestring对象)、图例属性{最小值、最大值、色带、标注(列表对象)、格式、{文字属性}}、scale、文字属性{textProperties});文字属性怎么添加见上一篇,对角线和scale为必填参数!
本地运行效果
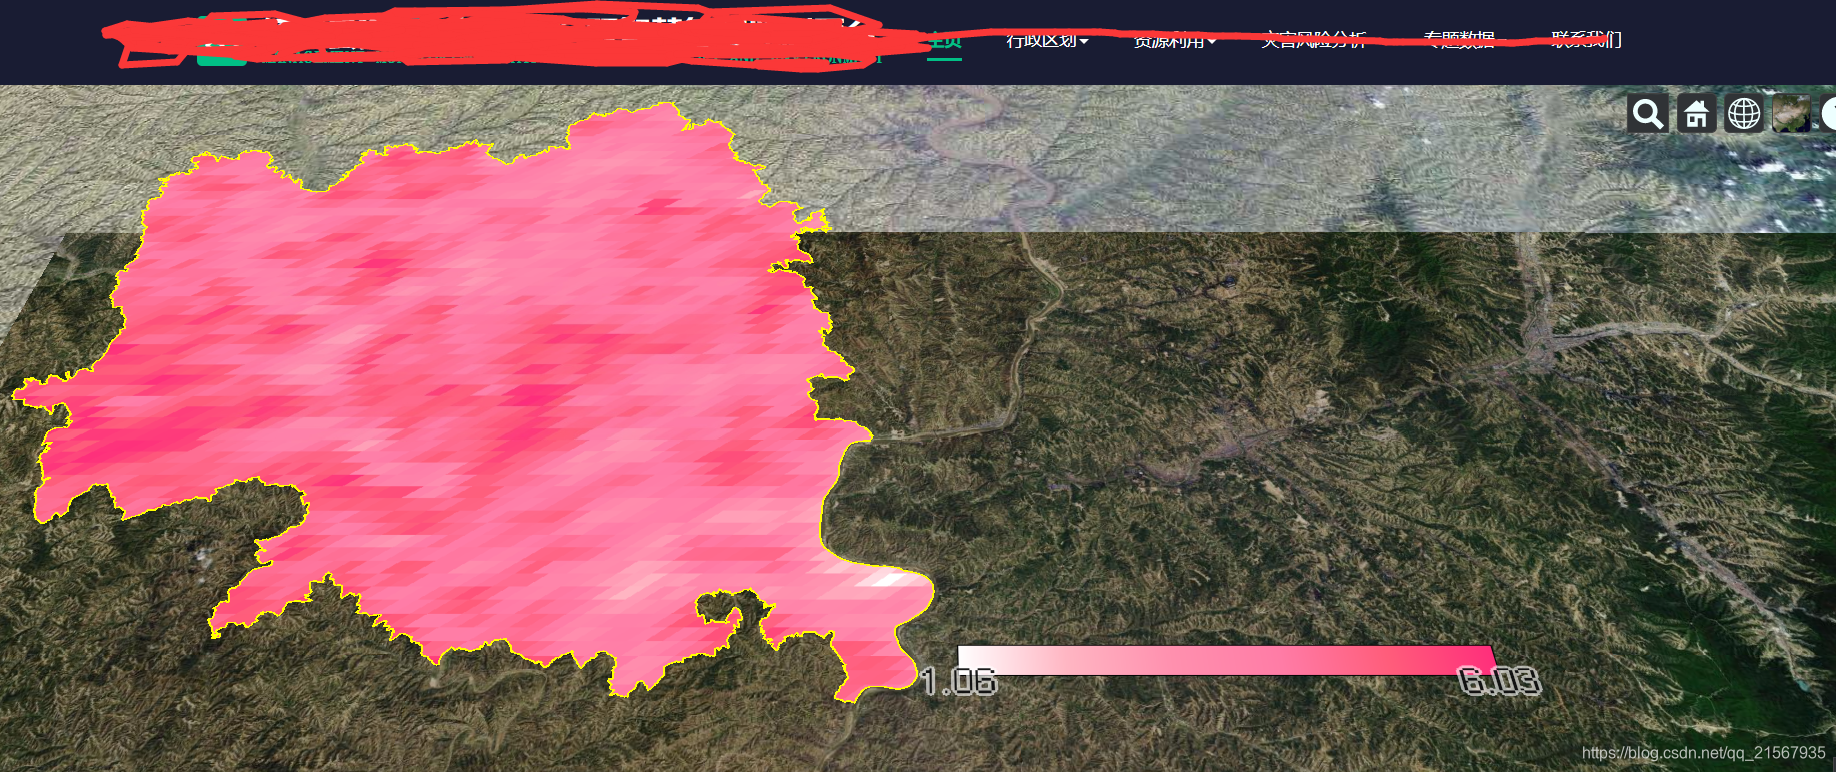
配合cesium在前端展示的效果
注意这里我是修改了DrawText里的scale,字体的scale和图例的scale我没有调整一致
相关关键代码
        img =img.visualize(None, None, None, min_value, max_value, None, None, palette)
        Gradient = {'min': min_value, 'max': max_value, 'palette': palette, 'labels': labels, 'format': '%.2f'}
        legend = geelegend.GradientBar(geometryGradientBar, Gradient, 7)
        imgColl = ee.ImageCollection([img, legend])
        mapid = imgColl.getMapId()


 4842
4842

 被折叠的 条评论
为什么被折叠?
被折叠的 条评论
为什么被折叠?
 到【灌水乐园】发言


