代码如下(详细注释)
<!DOCTYPE>
<html>
<meta charset="utf-8">
<style>
text{
font: 10px sans-serif;
}
.axis path,
.axis line{
fill: none;
stroke: black;
shape-rendering: crispEdges;
}
</style>
<body>
<h1>The columns diagram </h1>
<script src="d3/d3.v3.js"></script>
<script>
var dataset=[50,43,120,87,99,167,142];
var width = 400;
var height = 400;
var svg = d3.select("body")
.append ("svg")
.attr("width",width)
.attr("height",height);
var padding = {
top:20,
right:20,
bottom:20,
left:25
};
</script>
<script>
function draw(){
var xAxisWidth = 300;
var yAxisWidth = 300;
var xScale = d3.scale.ordinal()
.domain(d3.range(dataset.length))
.rangeRoundBands([0,xAxisWidth],0.2);
console.log(xScale.rangeBand());
var yScale = d3.scale.linear()
.domain([0,d3.max(dataset)])
.range([0,yAxisWidth]);
svg.selectAll("text").remove();
var updateRect = svg.selectAll("rect")
.data(dataset);
var enterRect = updateRect.enter();
var exitRect = updateRect.exit();
var updateText = svg.selectAll("text")
.data(dataset);
var enterText = updateText.enter();
var exitText = updateText.exit();
updateRect.attr("fill","red")
.attr("x",function(d,i){
return padding.left+xScale(i);
})
.attr("y",function(d,i){
return height - padding.bottom-yScale(d);
})
.attr("width",xScale.rangeBand())
.attr("height",function(d){
return yScale(d);
})
.on("mouseover",function(d,i){
d3.select(this)
.attr("fill","yellow");
})
.on("mouseout",function(d,i){
d3.select(this)
.transition()
.duration(500)
.attr("fill","red");
});
enterRect.append("rect")
.attr("fill","steelblue")
.attr("x",function(d,i){
return padding.left+xScale(i);
})
.attr("y",function(d,i){
return height - padding.bottom-yScale(d);
})
.attr("width",xScale.rangeBand())
.attr("height",function(d){
return yScale(d);
})
.on("mouseover",function(d,i){
d3.select(this)
.attr("fill","yellow");
})
.on("mouseout",function(d,i){
d3.select(this)
.transition()
.duration(500)
.attr("fill","red");
})
.transition()
.delay(500)
.duration(1000)
.attr("fill","red");
exitRect.remove();
updateText.attr("fill","white")
.attr("font-size","14px")
.attr("text-anchor","middle")
.attr("x",function(d,i){
return padding.left + xScale(i);
})
.attr("y",function(d){
return height- padding.bottom - yScale(d);
})
.attr("dx",xScale.rangeBand()/2)
.attr("dy","1em")
.text(function(d){
return d;
});
enterText.append("text")
.attr("fill","white")
.attr("font-size","14px")
.attr("text-anchor","middle")
.attr("x",function(d,i){
return padding.left + xScale(i);
})
.attr("y",function(d){
return height- padding.bottom - yScale(d);
})
.attr("dx",xScale.rangeBand()/2)
.attr("dy","1em")
.text(function(d){
return d;
});
exitText.remove();
var xAxis = d3.svg.axis()
.scale(xScale)
.orient("bottom");
yScale.range([yAxisWidth,0]);
var yAxis = d3.svg.axis()
.scale(yScale)
.orient("left");
svg.selectAll("g").remove();
svg.append("g")
.attr("class","axis")
.attr("transform", "translate(" + padding.left +","+(height-padding.bottom) + ")" )
.call(xAxis);
svg.append("g")
.attr("class","axis")
.attr("transform","translate(" + padding.left+","+(height-yAxisWidth-padding.top)+ ")" )
.call(yAxis);
}
</script>
<script>
console.log(dataset);
draw();
</script>
<script>
function add()
{
dataset.push( Math.floor(Math.random()*100) );
console.log(dataset);
draw();
}
</script>
<br>
<button type="button" onclick = "add()">添加一个数据</button>
</body>
</html>
效果图如下:
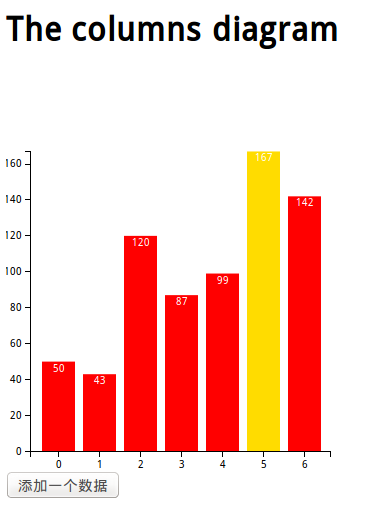
- 呈现出一个柱状图,可以通过点击按钮通过随机数添加一个新的矩形条,颜色从最初的铁蓝色转变为红色
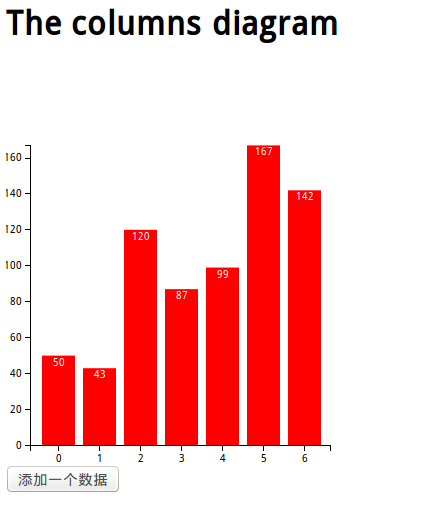
- 当鼠标经过矩形条时,矩形条变为黄色,离开的时候矩形条缓慢变回红色


 4368
4368

 被折叠的 条评论
为什么被折叠?
被折叠的 条评论
为什么被折叠?
 到【灌水乐园】发言


