<?php
include("../jpgraph/src/jpgraph.php");
include("../jpgraph/src/jpgraph_bar.php");

//header('Content-type:image/png');
$datay1=array(58,85,65,39,120,91,152,49,97,130,67);
$datay2=array(18,35,101,69,138,131,112,149,88,60,77);

$graph = new Graph(620,300,'auto');
$graph->SetScale("textlin");
$graph->SetShadow();
$graph->SetMarginColor("yellow");                      //设置画布背景色为淡蓝色
$graph->img->SetMargin(40,30,40,40);
$graph->xaxis->SetTickLabels($gDateLocale->GetShortMonth());
$graph->xaxis->title->SetFont(FF_SIMSUN,FS_BOLD);
//$x="郑";
//$b=iconv("UTF-8","gb2312",$x);
$graph->xaxis->title->Set("这是统计表");
$graph->title->Set('xsd');
$graph->title->SetFont(FF_SIMSUN,FS_BOLD);

$bplot1 = new BarPlot($datay1);
$bplot2 = new BarPlot($datay2);

$bplot1->SetFillColor("orange");
$bplot2->SetFillColor("lightblue");

$bplot1->SetShadow();
$bplot2->SetShadow();

$bplot1->SetShadow();
$bplot2->SetShadow();

$gbarplot = new GroupBarPlot(array($bplot1,$bplot2));
$gbarplot->SetWidth(0.6);
$graph->Add($gbarplot);
ob_clean();
$graph->Stroke();
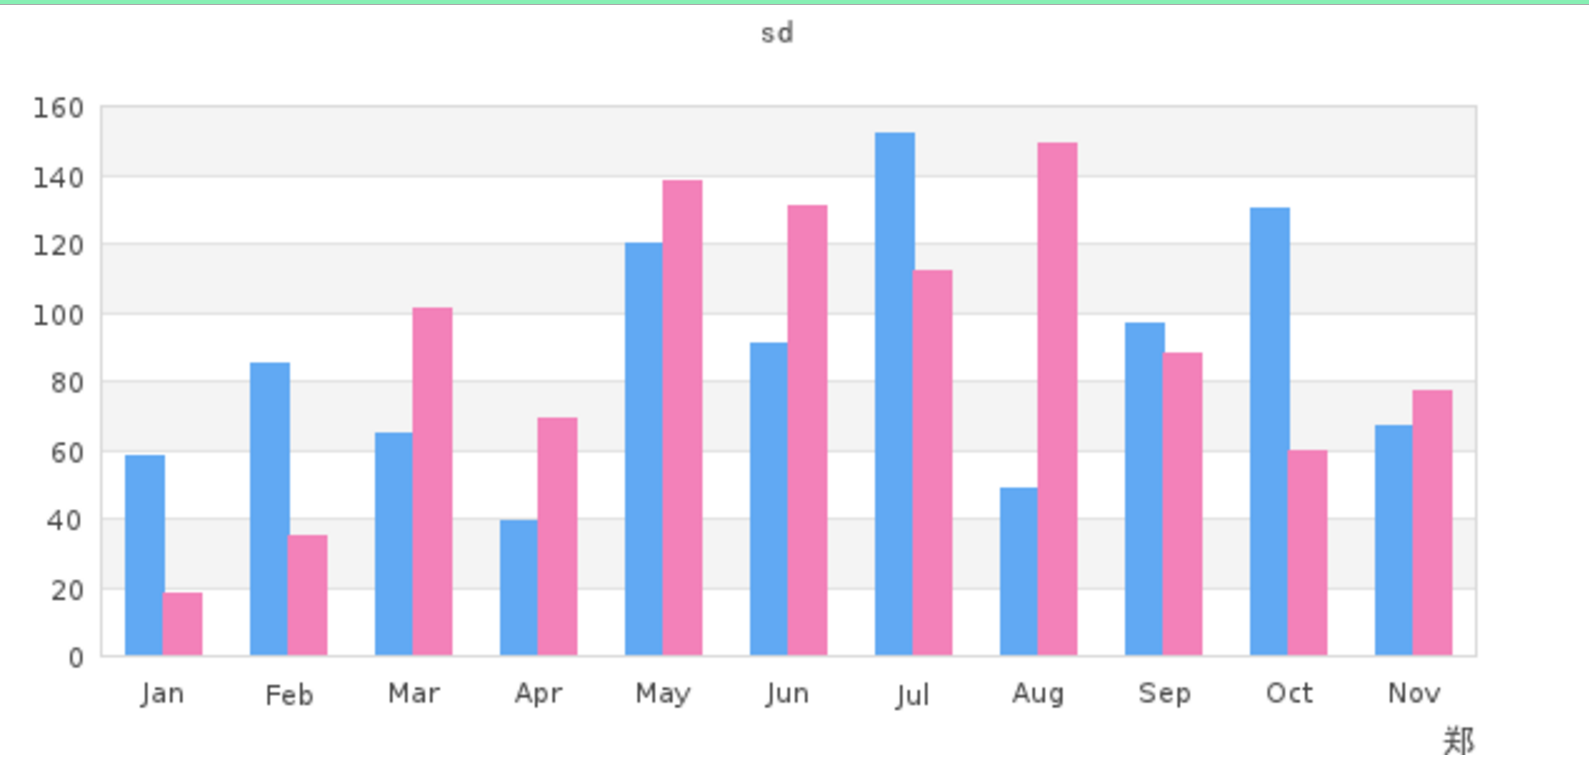
上边的代码在google浏览器运行的结果是只显示:

而在火狐浏览器显示的是:“您的图像显示出现错误”;
在网上查找了解到可能是中文显示出现的问题,所以显示中文的时候需要做相应的处理:
$graph->xaxis->title->Set("这是统计表");用iconv进行转换:
$x="这是统计表";
$b=iconv("UTF-8","gb2312",$x);
$graph->xaxis->title->Set($b);
pgraph默认显示汉字时是把汉字编码认为gb2312,转化为utf-8以后再显示,如果文件的编码方式是gb2312,只需把SetFont()方法的第一个参数设置为FF_SIMSUN即可
如果是utf-8编码的,需要先把汉字编码转化为gb2312,这样汉字才能正常显示
转换编码方式可以使用 iconv(“UTF-8”,”gb2312”,$x);
设置之后的显示就可以看到理想的界面:


 550
550

 被折叠的 条评论
为什么被折叠?


