


上周遇到了一个需求,需要将折线图使用邮件发送给用户,百度了一下java有现成的库可以制作图表,下面就讲过程写出来。
1.首先导入pom文件
<dependency>
     <groupId>org.jfree</groupId>
     <artifactId>jfreechart</artifactId>
     <version>1.0.19</version>
</dependency>
2.创建两个工具类CreatLineChart.java和Serie.java
import java.awt.BasicStroke;
import java.awt.Color;
import java.awt.Font;
import java.awt.Paint;
import java.io.File;
import java.io.FileOutputStream;
import java.io.IOException;
import java.text.NumberFormat;
import java.util.Arrays;
import java.util.Date;
import java.util.List;
import java.util.Vector;
import javax.swing.SwingUtilities;
import org.jfree.chart.ChartFactory;
import org.jfree.chart.ChartPanel;
import org.jfree.chart.ChartUtilities;
import org.jfree.chart.JFreeChart;
import org.jfree.chart.StandardChartTheme;
import org.jfree.chart.axis.CategoryLabelPositions;
import org.jfree.chart.axis.ValueAxis;
import org.jfree.chart.block.BlockBorder;
import org.jfree.chart.labels.ItemLabelAnchor;
import org.jfree.chart.labels.ItemLabelPosition;
import org.jfree.chart.labels.StandardCategoryItemLabelGenerator;
import org.jfree.chart.plot.CategoryPlot;
import org.jfree.chart.plot.DefaultDrawingSupplier;
import org.jfree.chart.plot.PieLabelLinkStyle;
import org.jfree.chart.renderer.category.LineAndShapeRenderer;
import org.jfree.chart.renderer.category.StandardBarPainter;
import org.jfree.chart.renderer.xy.StandardXYBarPainter;
import org.jfree.data.category.DefaultCategoryDataset;
import org.jfree.ui.RectangleInsets;
import org.jfree.ui.TextAnchor;
/**
* @author
* @Title:创建折线图
* @history
* @since JDK1.6
*/
public class CreatLineChart {
/**
* Jfreechart工具类
* <p>
* 解决中午乱码问题<br>
* 用来创建类别图表数据集、创建饼图数据集、时间序列图数据集<br>
* 用来对柱状图、折线图、饼图、堆积柱状图、时间序列图的样式进行渲染<br>
* 设置X-Y坐标轴样式
* <p>
*/
private static String NO_DATA_MSG = "数据加载失败";
private static Font FONT = new Font("宋体", Font.PLAIN, 22);
public static Color[] CHART_COLORS = {
new Color(13, 131, 198), new Color(18, 76, 7),
new Color(255, 117, 153), new Color(255, 204, 102),
new Color(255, 188, 117), new Color(153, 158, 255),
new Color(253, 236, 109), new Color(128, 133, 232),
new Color(158, 90, 102), new Color(92, 92, 97)};//颜色
/**
* 静态代码块
*/
static {
setChartTheme();
}
/**
* 无参构造器
*/
public CreatLineChart() {
}
/**
* TODO 可以通过调用这个方法, 提供对应格式的参数即可生成图片,并存在指定位置
* 生成一个这先出并保存为png格式,
*
* @param title 图片标题
* @param xtitle x轴标题
* @param ytitle y轴标题
* @param filepath 文件路径+文件名
* @param categorie 横坐标类型
* @param series 数据内容
* @param width 图片宽度
* @param height 图片高度
* @throws Exception
*/
public static void CreateNewLineChartForPng(String title, String xtitle, String ytitle, String filepath, List<String> categorie, List<Serie> series, int width, int height) throws Exception {
ChartPanel chartPanel = new CreatLineChart().createChart(title, xtitle, ytitle, categorie, series);
//将图片保存为png格式
saveAsFile(chartPanel.getChart(), filepath, width, height);
}
/**
* 中文主题样式 解决乱码
*/
public static void setChartTheme() {
// 设置中文主题样式 解决乱码
StandardChartTheme chartTheme = new StandardChartTheme("CN");
// 设置标题字体
chartTheme.setExtraLargeFont(FONT);
// 设置图例的字体
chartTheme.setRegularFont(FONT);
// 设置轴向的字体
chartTheme.setLargeFont(FONT);
chartTheme.setSmallFont(FONT);
chartTheme.setTitlePaint(new Color(51, 51, 51));
chartTheme.setSubtitlePaint(new Color(85, 85, 85));
chartTheme.setLegendBackgroundPaint(Color.WHITE);// 设置标注
chartTheme.setLegendItemPaint(Color.BLACK);//
chartTheme.setChartBackgroundPaint(Color.WHITE);
// 绘制颜色绘制颜色.轮廓供应商
// paintSequence,outlinePaintSequence,strokeSequence,outlineStrokeSequence,shapeSequence
Paint[] OUTLINE_PAINT_SEQUENCE = new Paint[]{Color.WHITE};
// 绘制器颜色源
DefaultDrawingSupplier drawingSupplier = new DefaultDrawingSupplier(CHART_COLORS, CHART_COLORS, OUTLINE_PAINT_SEQUENCE,
DefaultDrawingSupplier.DEFAULT_STROKE_SEQUENCE, DefaultDrawingSupplier.DEFAULT_OUTLINE_STROKE_SEQUENCE,
DefaultDrawingSupplier.DEFAULT_SHAPE_SEQUENCE);
chartTheme.setDrawingSupplier(drawingSupplier);
chartTheme.setPlotBackgroundPaint(Color.WHITE);// 绘制区域
chartTheme.setPlotOutlinePaint(Color.WHITE);// 绘制区域外边框
chartTheme.setLabelLinkPaint(new Color(8, 55, 114));// 链接标签颜色
chartTheme.setLabelLinkStyle(PieLabelLinkStyle.CUBIC_CURVE);
chartTheme.setAxisOffset(new RectangleInsets(5, 12, 5, 12));
chartTheme.setDomainGridlinePaint(new Color(192, 208, 224));// X坐标轴垂直网格颜色
chartTheme.setRangeGridlinePaint(new Color(192, 192, 192));// Y坐标轴水平网格颜色
chartTheme.setBaselinePaint(Color.WHITE);
chartTheme.setCrosshairPaint(Color.BLUE);// 不确定含义
chartTheme.setAxisLabelPaint(new Color(51, 51, 51));// 坐标轴标题文字颜色
chartTheme.setTickLabelPaint(new Color(67, 67, 72));// 刻度数字
chartTheme.setBarPainter(new StandardBarPainter());// 设置柱状图渲染
chartTheme.setXYBarPainter(new StandardXYBarPainter());// XYBar 渲染
chartTheme.setItemLabelPaint(Color.black);
chartTheme.setThermometerPaint(Color.white);// 温度计
ChartFactory.setChartTheme(chartTheme);
}
/**
* 创建类别数据集合
*/
public static DefaultCategoryDataset createDefaultCategoryDataset(List<Serie> series, String[] categories) {
DefaultCategoryDataset dataset = new DefaultCategoryDataset();
for (Serie serie : series) {
String name = serie.getName();
Vector<Object> data = serie.getData();
if (data != null && categories != null && data.size() == categories.length) {
for (int index = 0; index < data.size(); index++) {
String value = data.get(index) == null ? "" : data.get(index).toString();
if (isPercent(value)) {
value = value.substring(0, value.length() - 1);
}
if (isNumber(value)) {
dataset.setValue(Double.parseDouble(value), name, categories[index]);
}
}
}
}
return dataset;
}
/**
* 设置图例无边框,默认黑色边框
*/
public static void setLegendEmptyBorder(JFreeChart chart) {
chart.getLegend().setFrame(new BlockBorder(Color.WHITE));
}
/**
* 是不是一个%形式的百分比
*
* @param str
* @return
*/
public static boolean isPercent(String str) {
return str != null ? str.endsWith("%") && isNumber(str.substring(0, str.length() - 1)) : false;
}
/**
* 是不是一个数字
*
* @param str
* @return
*/
public static boolean isNumber(String str) {
return str != null ? str.matches("^[-+]?(([0-9]+)((([.]{0})([0-9]*))|(([.]{1})([0-9]+))))$") : false;
}
/**
* 设置 折线图样式
*
* @param plot
* @param isShowDataLabels 是否显示数据标签 默认不显示节点形状
*/
public static void setLineRender(CategoryPlot plot, boolean isShowDataLabels) {
setLineRender(plot, isShowDataLabels, false);
}
/**
* 设置折线图样式
*
* @param plot
* @param isShowDataLabels 是否显示数据标签
*/
@SuppressWarnings("deprecation")
public static void setLineRender(CategoryPlot plot, boolean isShowDataLabels, boolean isShapesVisible) {
plot.setNoDataMessage(NO_DATA_MSG);
plot.setInsets(new RectangleInsets(10, 10, 0, 10), false);
LineAndShapeRenderer renderer = (LineAndShapeRenderer) plot.getRenderer();
renderer.setStroke(new BasicStroke(6F));
if (isShowDataLabels) {
renderer.setBaseItemLabelsVisible(true);
renderer.setBaseItemLabelGenerator(new StandardCategoryItemLabelGenerator(StandardCategoryItemLabelGenerator.DEFAULT_LABEL_FORMAT_STRING,
NumberFormat.getInstance()));
renderer.setBasePositiveItemLabelPosition(new ItemLabelPosition(ItemLabelAnchor.OUTSIDE1, TextAnchor.BOTTOM_CENTER));// weizhi
}
renderer.setBaseShapesVisible(isShapesVisible);// 数据点绘制形状
renderer.setDrawOutlines(true);
renderer.setUseFillPaint(true);
renderer.setBaseItemLabelGenerator(new StandardCategoryItemLabelGenerator());
renderer.setBaseItemLabelsVisible(true);
plot.setRenderer(renderer);//将修改后的属性值保存到图中
setXAixs(plot);
setYAixs(plot);
}
/**
* 设置类别图表(CategoryPlot) X坐标轴线条颜色和样式
*
* @param axis
*/
public static void setXAixs(CategoryPlot plot) {
Color lineColor = new Color(31, 121, 170);
plot.getDomainAxis().setAxisLinePaint(lineColor);// X坐标轴颜色
plot.getDomainAxis().setTickMarkPaint(lineColor);// X坐标轴标记|竖线颜色
plot.getDomainAxis().setCategoryLabelPositions(CategoryLabelPositions.UP_45);
}
/**
* 设置类别图表(CategoryPlot) Y坐标轴线条颜色和样式 同时防止数据无法显示
*
* @param axis
*/
public static void setYAixs(CategoryPlot plot) {
Color lineColor = new Color(192, 208, 224);
ValueAxis axis = plot.getRangeAxis();
axis.setAxisLinePaint(lineColor);// Y坐标轴颜色
axis.setTickMarkPaint(lineColor);// Y坐标轴标记|竖线颜色
// 隐藏Y刻度
axis.setAxisLineVisible(false);
axis.setTickMarksVisible(false);
// Y轴网格线条
plot.setRangeGridlinePaint(new Color(192, 192, 192));
plot.setRangeGridlineStroke(new BasicStroke(1));
plot.getRangeAxis().setUpperMargin(0.1);// 设置顶部Y坐标轴间距,防止数据无法显示
plot.getRangeAxis().setLowerMargin(0.1);// 设置底部Y坐标轴间距
}
/**
* 必须设置文本抗锯齿
*/
public static void setAntiAlias(JFreeChart chart) {
chart.setTextAntiAlias(false);
}
//-----------------------------------------------------------------------------------------------------------------
/**
* 折线图
* <p>
* 创建图表步骤:<br/>
* 1:创建数据集合<br/>
* 2:创建Chart:<br/>
* 3:设置抗锯齿,防止字体显示不清楚<br/>
* 4:对柱子进行渲染,<br/>
* 5:对其他部分进行渲染<br/>
* 6:使用chartPanel接收<br/>
*
* </p>
*/
//创建折线图图表
public DefaultCategoryDataset createDataset(List<String> categorie, List<Serie> series) {
// 标注类别
String[] categories = categorie.toArray(new String[categorie.size()]);
//横坐标
// String[] categories = { "Jan", "Feb", "Mar", "Apr", "May", "Jun", "Jul", "Aug", "Sep", "Oct", "Nov", "Dec" };
// series = new Vector<Serie>();
// // 柱子名称:柱子所有的值集合
// //纵坐标
// series.add(new Serie("Tokyo", new Double[] { 49.9, 71.5, 106.4, 129.2, 144.0, 176.0, 135.6, 148.5, 216.4, 194.1, 95.6, 54.4 }));
// series.add(new Serie("New York", new Double[] { 83.6, 78.8, 98.5, 93.4, 106.0, 84.5, 105.0, 104.3, 91.2, 83.5, 106.6, 92.3 }));
// series.add(new Serie("London", new Double[] { 48.9, 38.8, 39.3, 41.4, 47.0, 48.3, 59.0, 59.6, 52.4, 65.2, 59.3, 51.2 }));
// series.add(new Serie("Berlin", new Double[] { 42.4, 33.2, 34.5, 39.7, 52.6, 75.5, 57.4, 60.4, 47.6, 39.1, 46.8, 51.1 }));
// 1:创建数据集合
DefaultCategoryDataset dataset = CreatLineChart.createDefaultCategoryDataset(series, categories);
return dataset;
}
/**
* 创建折线图
*
* @param title 折线图标题
* @param xtitle x轴标题
* @param ytitle y轴标题
* @param categorie 横坐标类别
* @param series 数据集
* @return
* @throws Exception
*/
public ChartPanel createChart(String title, String xtitle, String ytitle, List<String> categorie, List<Serie> series) throws Exception {
// 2:创建Chart[创建不同图形]
JFreeChart chart = ChartFactory.createLineChart(title, xtitle, ytitle, createDataset(categorie, series));
// 3:设置抗锯齿,防止字体显示不清楚
CreatLineChart.setAntiAlias(chart);// 抗锯齿
// 4:对柱子进行渲染[[采用不同渲染]]
CreatLineChart.setLineRender(chart.getCategoryPlot(), false, true);//
// 5:对其他部分进行渲染
CreatLineChart.setXAixs(chart.getCategoryPlot());// X坐标轴渲染
CreatLineChart.setYAixs(chart.getCategoryPlot());// Y坐标轴渲染
// 设置标注无边框
chart.getLegend().setFrame(new BlockBorder(Color.WHITE));
// 6:使用chartPanel接收
ChartPanel chartPanel = new ChartPanel(chart);
return chartPanel;
}
/**
* 主方法 用来测试 `
*
* @param args
*/
public static void main(String[] args) {
try {
List<Serie> series = null;
//横坐标
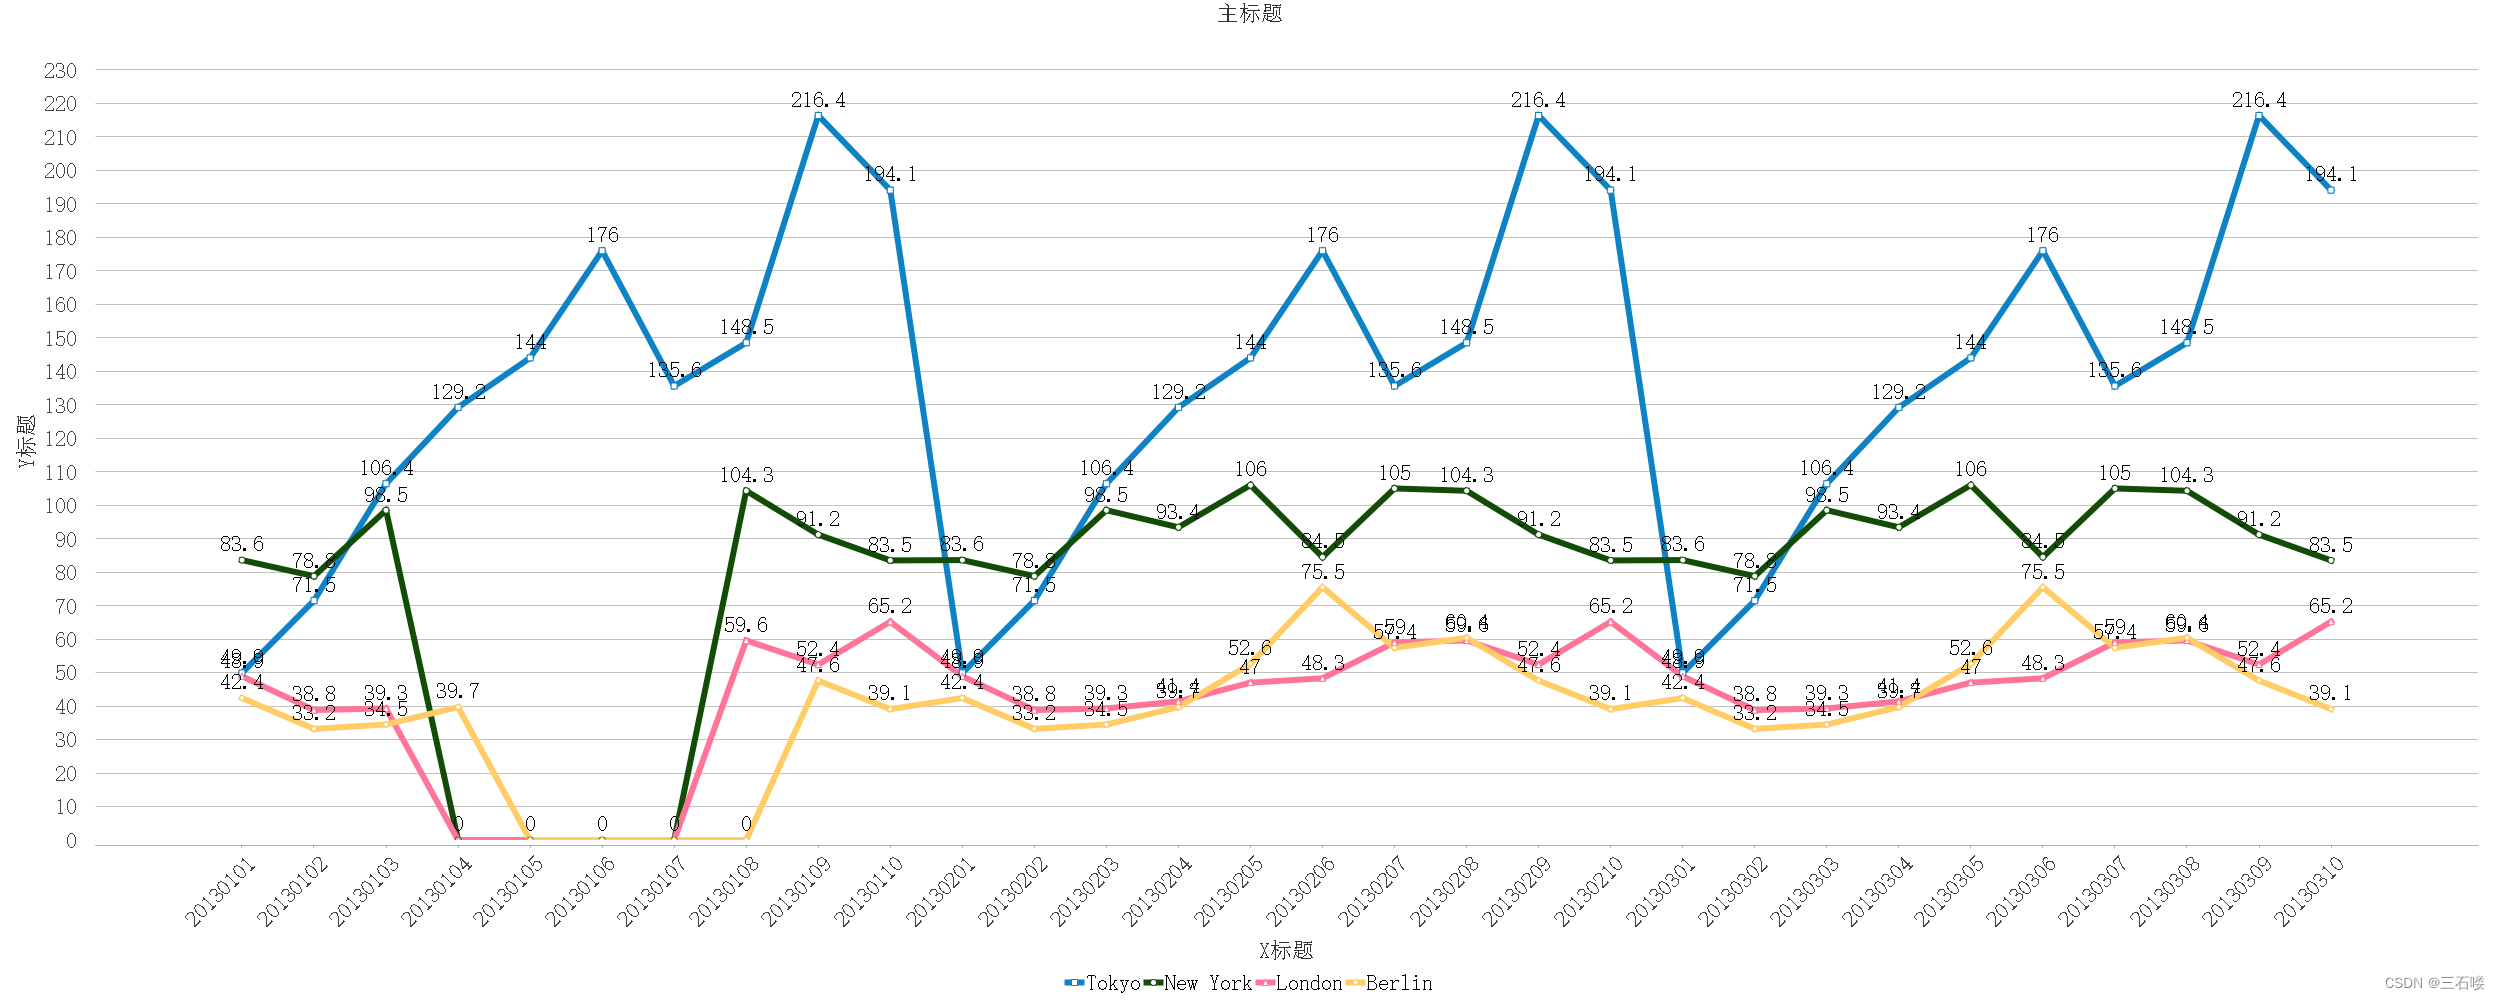
String[] categories = {"20130101", "20130102", "20130103", "20130104", "20130105", "20130106", "20130107", "20130108", "20130109", "20130110", "20130201", "20130202", "20130203", "20130204", "20130205", "20130206", "20130207", "20130208", "20130209", "20130210", "20130301", "20130302", "20130303", "20130304", "20130305", "20130306", "20130307", "20130308", "20130309", "20130310"};
series = new Vector<Serie>();
// 柱子名称:柱子所有的值集合
//纵坐标
series.add(new Serie("Tokyo", new Double[]{49.9, 71.5, 106.4, 129.2, 144.0, 176.0, 135.6, 148.5, 216.4, 194.1, 49.9, 71.5, 106.4, 129.2, 144.0, 176.0, 135.6, 148.5, 216.4, 194.1, 49.9, 71.5, 106.4, 129.2, 144.0, 176.0, 135.6, 148.5, 216.4, 194.1}));
series.add(new Serie("New York", new Double[]{83.6, 78.8, 98.5, 0.0, 0.0, 0.0, 0.0, 104.3, 91.2, 83.5, 83.6, 78.8, 98.5, 93.4, 106.0, 84.5, 105.0, 104.3, 91.2, 83.5, 83.6, 78.8, 98.5, 93.4, 106.0, 84.5, 105.0, 104.3, 91.2, 83.5}));
series.add(new Serie("London", new Double[]{48.9, 38.8, 39.3, 0.0, 0.0, 0.0, 0.0, 59.6, 52.4, 65.2, 48.9, 38.8, 39.3, 41.4, 47.0, 48.3, 59.0, 59.6, 52.4, 65.2, 48.9, 38.8, 39.3, 41.4, 47.0, 48.3, 59.0, 59.6, 52.4, 65.2}));
series.add(new Serie("Berlin", new Double[]{42.4, 33.2, 34.5, 39.7, 0.0, 0.0, 0.0, 0.0, 47.6, 39.1, 42.4, 33.2, 34.5, 39.7, 52.6, 75.5, 57.4, 60.4, 47.6, 39.1, 42.4, 33.2, 34.5, 39.7, 52.6, 75.5, 57.4, 60.4, 47.6, 39.1}));
ChartPanel chartPanel = new CreatLineChart().createChart("主标题", "X标题", "Y标题", Arrays.asList(categories.clone()), series);
//将图片保存为png格式
saveAsFile(chartPanel.getChart(), "D:\\1\\lol.png", 2500, 1000);
} catch (Exception e1) {
e1.printStackTrace();
}
//swing 运行
SwingUtilities.invokeLater(new Runnable() {
@Override
public void run() {
// 创建图形
try {
} catch (Exception e) {
e.printStackTrace();
}
}
});
}
/**
* 将图表保存为PNG、JPEG图片
*
* @param chart 折线图对象
* @param outputPath 文件保存路径, 包含文件名
* @param weight 宽
* @param height 高
* @throws Exception
*/
public static void saveAsFile(JFreeChart chart, String outputPath, int weight, int height) throws Exception {
FileOutputStream out = null;
File outFile = new File(outputPath);
if (!outFile.getParentFile().exists()) {
outFile.getParentFile().mkdirs();
}
out = new FileOutputStream(outputPath);
// 保存为PNG
ChartUtilities.writeChartAsPNG(out, chart, weight, height);
// 保存为JPEG
// ChartUtilities.writeChartAsJPEG(out, chart, weight, height);
out.flush();
if (out != null) {
try {
out.close();
} catch (IOException e) {
// do nothing
e.printStackTrace();
}
}
}
}
import java.io.Serializable;
import java.util.Vector;

/**
 * 系列:名字和数据集合 构成一条曲线</br> 可以将serie看作一根线或者一根柱子:
 *
 * <p>
 * 参照JS图表来描述数据:series: [{ name: 'Tokyo', data: [7.0, 6.9, 9.5, 14.5]
 * }, { name: 'New York', data: [-0.2, 0.8, 5.7, 11.3} ]
 *
 *
 */
public class Serie implements Serializable {

    private static final long serialVersionUID = 1L;
    private String name;// 名字
    private Vector<Object> data;// 数据值ֵ

    public Serie() {

    }

    /**
     *
     * @param name
     *            名称(线条名称)
     * @param data
     *            数据(线条上的所有数据值)
     */
    public Serie(String name, Vector<Object> data) {

        this.name = name;
        this.data = data;
    }

    /**
     *
     * @param name
     *            名称(线条名称)
     * @param array
     *            数据(线条上的所有数据值)
     */
    public Serie(String name, Object[] array) {
        this.name = name;
        if (array != null) {
            data = new Vector<Object>(array.length);
            for (int i = 0; i < array.length; i++) {
                data.add(array[i]);
            }
        }
    }

    public String getName() {
        return name;
    }

    public void setName(String name) {
        this.name = name;
    }

    public Vector<Object> getData() {
        return data;
    }

    public void setData(Vector<Object> data) {
        this.data = data;
    }

}
注:在CreatLineChart.java中有main方法,这里可以先测试一下数据是否能生成。生成后如下图。
3.将生成好的图片放入MAP中
String base5 = getbase64("D:\1\lol.png");
data.put("img5", base5);
注意这里的getbase64()方法是将图片转码为base64格式。
转码如下:
public String getbase64(String path) {
        String base64Image = "";
        String imagePath = path; // 替换为你的图片文件路径
        File imageFile = new File(imagePath);
        try (FileInputStream fis = new FileInputStream(imageFile)) {
            byte[] imageBytes = new byte[(int) imageFile.length()];
            fis.read(imageBytes);
            base64Image = Base64.getEncoder().encodeToString(imageBytes);
            System.out.println(base64Image);
        } catch (IOException e) {
            e.printStackTrace();
        }
        return base64Image;
    }
4.将图片绑定在<img>标签上
<img src="data:image/gif;base64,${img5}" width="1000px">注:这里必须在前面加入 data:image/gif;base64, 否则base64编码将无法解析解析为图片。
这里还需要注意的是,当系统部署在Linux服务的时候需要检查服务器是否有中文字体,如果没有的话,图片上的中文会变成小方框,Linux安装中文字体的教程如下,按照教程安装即可。


 8331
8331


 被折叠的 条评论
为什么被折叠?
被折叠的 条评论
为什么被折叠?
 到【灌水乐园】发言


