


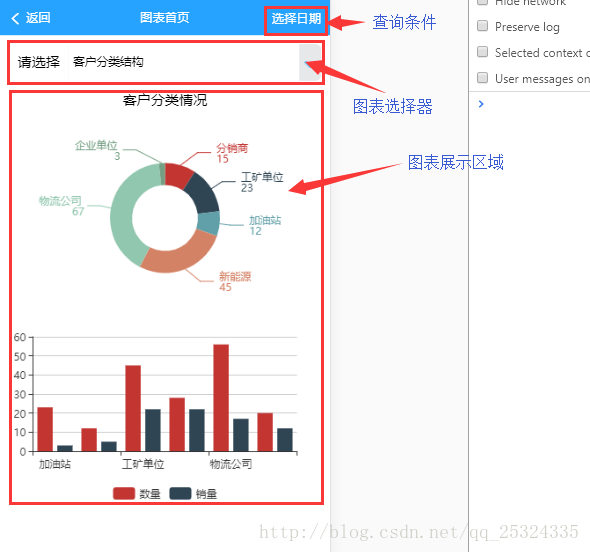
最近项目上有这样一个需求,做统计图表的展示,但是要在一个页面实现图表的切换和按日期条件的查询。
类似这样的。点击图标选择器会弹出一个列表供用户选择要看的图表类型,图表选定后,点击右上角的选择日期会查询数据刷新当前的图表。
其实,这种需求最简单的做法,就是将所有的图表写在一个界面中。但是每个图表的配置项不同,图表一多的话,界面代码将会非常臃肿且难以维护。所以我没有使用这种方法。我采取了子路由的方式。
首先配置路由:
{
      path: '/chartBox',
      name: 'chartBox',
      component: chartBox,
      children: [
        {
          name:'',
          path:'',
          component: CustomerCategory
        },
        {
          name: 'CustomerCategory',
          path: 'CustomerCategory',
          component: CustomerCategory
        },
        {
          name: 'MonthlySalesStatistics',
          path: 'MonthlySalesStatistics',
          component: MonthlySalesStatistics
        },
        {
          name: 'MonthlyTask',
          path: 'MonthlyTask',
          component: MonthlyTask
        },
        {
          name: 'OppFunnel',
          path: 'OppFunnel',
          component: OppFunnel
        },
        {
          name: 'SaleRank',
          path: 'SaleRank',
          component: SaleRank
        }
      ]
}我们知道,当我们切换图表的时候,会调用对应图表界面的指定方法,这里的图表数据展示不会有问题。但是,当我们选定一张图表后,想要根据日期来查询其它数据,可就没这么简单了。你怎么触发数据更新呢?
我们来看看父路由界面的编码:
<!--
    @CreationDate:2018/3/14
    @Author:Joker
    @Usage:图表展示主界面,根据picker切换展示不同的子路由界面
-->
<template>
  <div class="chart-box">


    <mt-header fixed title="图表首页">
      <router-link to="/tool" slot="left">
        <mt-button icon="back">返回</mt-button>
      </router-link>
      <mt-button slot="right" @click="togglePicker">选择日期</mt-button>
    </mt-header>

    <div class="chart-selector">
      <span>请选择</span>
      <div class="input-box">
        <input v-model="chartTypeText" readonly/>
        <span @click="openPicker"><i class="fa fa-chevron-down" style="color: #73ccff"></i></span>
      </div>
    </div>

    <!--路由出口-->
    <div class="chart-container">
      <router-view ref="chartView"></router-view>
    </div>

    <!--图表类型Picker-->
    <mt-popup
      style="width:100%;"
      :closeOnClickModal="false"
      v-model="popupVisible"
      position="bottom">
      <div class="picker-toolbar">
        <span @click="cancelSelect">取消</span>
        <span @click="confirmSelect">确定</span>
      </div>
      <mt-picker :slots="slots" @change="onValuesChange" valueKey="text"></mt-picker>
    </mt-popup>

    <!--日期picker-->
    <mt-popup
      style="width: 100%"
      :closeOnClickModal="false"
      v-model="popupDateVisible"
      position="bottom">
      <div class="picker-toolbar">
        <span @click="cancelSelectDate">取消</span>
        <span @click="confirmSelectDate">确定</span>
      </div>
      <mt-picker :slots="dateSlots" @change="onDateValuesChange" valueKey="text"></mt-picker>
    </mt-popup>

  </div>
</template>
<style scoped lang="scss">
  .chart-box {
    .chart-container {
      text-align: center;
      margin-top: 10px;
    }
    .picker-toolbar {
      height: 45px !important;
      width: 100%;
      line-height: 45px;
      background: #f5f8fa;
      border-bottom: 0.03rem solid #eaeaea;
      font-size: 15px;
      span {
        display: inline-block;
        width: 50%;
        text-align: center;
        color: #26a2ff;
        font-size: 15px;
        line-height: 45px;
      }
      span:first-child {
        float: left;
      }
      span:last-child {
        float: right;
      }
    }
    .chart-selector {
      background-color: white;
      margin: 50px 10px 0 10px;
      display: flex;
      line-height: 40px;
      border-radius: 10px;
      span:first-child {
        text-align: center;
        vertical-align: middle;
        padding: 0 10px;
      }
      .input-box {
        flex: 1;
        display: flex;
        font-size: 15px;
        align-items: center;
        background-color: #b8bbbf55;
        border-bottom-right-radius: 8px;
        border-top-right-radius: 8px;
        input {
          flex: 1;
          height: 40px;
          line-height: 40px;
          border: none;
          padding-left: 5px;
        }
        span {
          width: 25px;
          text-align: center;
        }
      }

    }
  }
</style>
<script>

  import {Indicator} from 'mint-ui'

  export default {
    name: 'chartBox',
    created(){
      let _footer = this.$store.state.footerVisible;
      if (_footer) {
        this.$store.commit('TOGGLE_FOOTER');
      }
    },
    data(){
      return {
        popupDateVisible: false,
        popupVisible: false,
        slots: [{
          flex: 1,
          values: [
            {text: '每月销量统计', value: 'MonthlySalesStatistics'},
            {text: '销售排名情况', value: 'SaleRank'},
            {text: '客户分类结构', value: 'CustomerCategory'},
            {text: '商机漏斗图', value: 'OppFunnel'},
            {text: '每月任务量及完成情况', value: 'MonthlyTask'},
          ],
          textAlign: 'center'
        }],
        goChart: '',
        tmp: '',
        dateSlots: [{
          flex: 1,
          values: [],
          textAlign: 'center'
        },
          {
            divider: true,
            content: '-',
          }, {
            flex: 1,
            values: ['01', '02', '03', '04', '05', '06', '07', '08', '09', '10', '11', '12'],
            textAlign: 'center'
          }],
        yearRange: [],
      }
    },
    computed: {
      'chartTypeText': function () {
        return this.$store.state.chartType;
      }
    },
    mounted(){
      for (let i = 2017; i < 2117; i++) {
        this.yearRange.push(i);
      }
      this.dateSlots[0].values = this.yearRange;
    },
    methods: {
      //表格picker
      openPicker(){
        this.popupVisible = true
      },
      cancelSelect(){
        this.popupVisible = false
      },
      confirmSelect(){
        this.$router.replace({name: this.goChart});
        this.popupVisible = false;
        this.$store.commit('setChartType', this.tmp);
      },
      onValuesChange(picker, values){
        if (values[0]) {
          this.goChart = values[0]['value'];
          this.tmp = values[0]['text']
        }
      },
      //日期Picker
      togglePicker(){
        this.popupDateVisible = true;
      },
      cancelSelectDate(){
        this.popupDateVisible = false
      },
      confirmSelectDate(){
        //刷新当前子路由界面
        if (this.goChart === 'MonthlySalesStatistics') {
          let data = {x1: [], x2: []};
          for (let i = 0; i < 12; i++) {
            data.x1.push(Math.floor(Math.random() * 100 + 1));
            data.x2.push(Math.floor(Math.random() * 100 + 1));
          }
          this.$refs.chartView.drawLine(data)
        }else if(this.goChart === 'SaleRank'){
          let data = {x: []};
          for (let i = 0; i < 7; i++) {
            data.x.push(Math.floor(Math.random() * 100 + 1));
          }
          this.$refs.chartView.drawLine(data)
        }
        this.popupDateVisible = false
      },
      onDateValuesChange(picker, values){
        let year = values[0];
        let month = values[1];
        if (year && month) {
          let d = new Date(year + '-' + month);
          console.info(d)
        }
      }
    }
  }
</script>
<router-view ref="chartView"></router-view>confirmSelectDate(){
//刷新当前子路由界面
if (this.goChart === 'MonthlySalesStatistics') {
let data = {x1: [], x2: []};
for (let i = 0; i < 12; i++) {
data.x1.push(Math.floor(Math.random() * 100 + 1));
data.x2.push(Math.floor(Math.random() * 100 + 1));
}
this.$refs.chartView.drawLine(data)
}else if(this.goChart === 'SaleRank'){
let data = {x: []};
for (let i = 0; i < 7; i++) {
data.x.push(Math.floor(Math.random() * 100 + 1));
}
this.$refs.chartView.drawLine(data)
}
this.popupDateVisible = false
},看看效果:
完美解决!
项目地址:https://github.com/JerryYuanJ/a-vue-app-template/tree/master/src/pages/tool/chart
欢迎star~~~


 1401
1401


 被折叠的 条评论
为什么被折叠?
被折叠的 条评论
为什么被折叠?
 到【灌水乐园】发言


