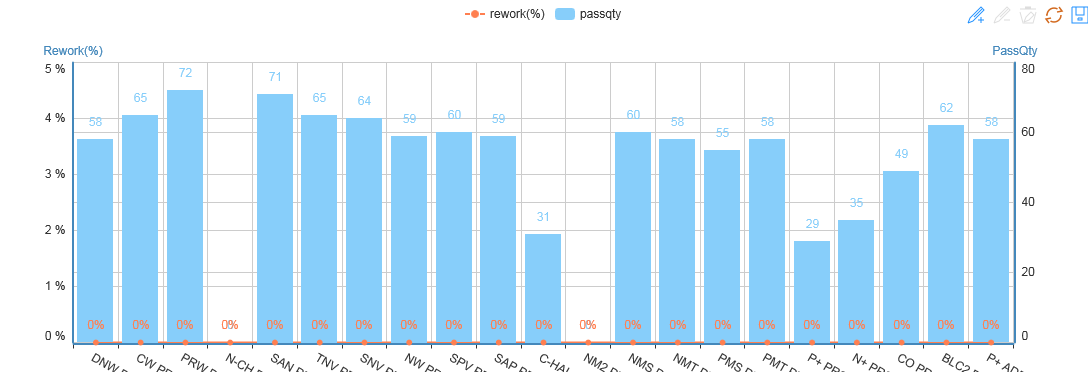
1、废话少说 直接上代码
js代码
function loadchart() {
// 基于准备好的dom,初始化echarts图表var myChart = echarts.init(document.getElementById('main'));
option = {
tooltip: {
trigger: 'axis'
},
toolbox: {
show: true,
feature: {
mark: { show: true },
//dataView: { show: true, readOnly: false },
//magicType: { show: true, type: ['line', 'bar'] },
restore: { show: true },
saveAsImage: { show: true }
}
},
calculable: true,
legend: {
data: ['rework(%)', 'passqty']
},
xAxis: [
{
type: 'category',
data: ['DNW PRST', 'CW PRST', 'PRW PRST', 'N-CH PRST', 'SAN PRST', 'TNV PRST', 'SNV PRST', 'NW PRST', 'SPV PRST', 'SAP PRST',
'C-HALO PRST', 'NM2 PRST', 'NMS PRST', 'NMT PRST', 'PMS PRST', 'PMT PRST', 'P+ PRST', 'N+ PRST', 'CO PRST', 'BLC2 PRST', 'P+ ADD PRST'],
axisLabel: {
interval:0,
rotate: -30 //30度角
}
}
],
yAxis: [
{
type: 'value',
name: 'Rework(%)',
axisLabel: {
formatter: '{value} %'
}
},
{
type: 'value',
name: 'PassQty',
axisLabel: {
formatter: '{value}'
}
}
],
series: [
{
name: 'rework(%)',
type: 'line',
data: [0, 0, 0, 0, 0, 0, 0, 0, 0, 0, 0, 0, 0, 0, 0, 0, 0, 0, 0, 0, 0],
itemStyle: { normal: { label: { show: true, position: 'top', formatter: '{c}%' } } }
},
{
name: 'passqty',
type: 'bar',
yAxisIndex: 1,
data: [58, 65, 72, 0, 71, 65, 64, 59, 60, 59, 31, 0, 60, 58, 55, 58, 29, 35, 49, 62, 58],
itemStyle : { normal: {label : {show: true, position: 'top'}}}
}
]
};
// 为echarts对象加载数据
myChart.setOption(option);
}
html代码:
<div id="main" style="width:1100px;height:400px">
效果图:


 3137
3137

 被折叠的 条评论
为什么被折叠?


