


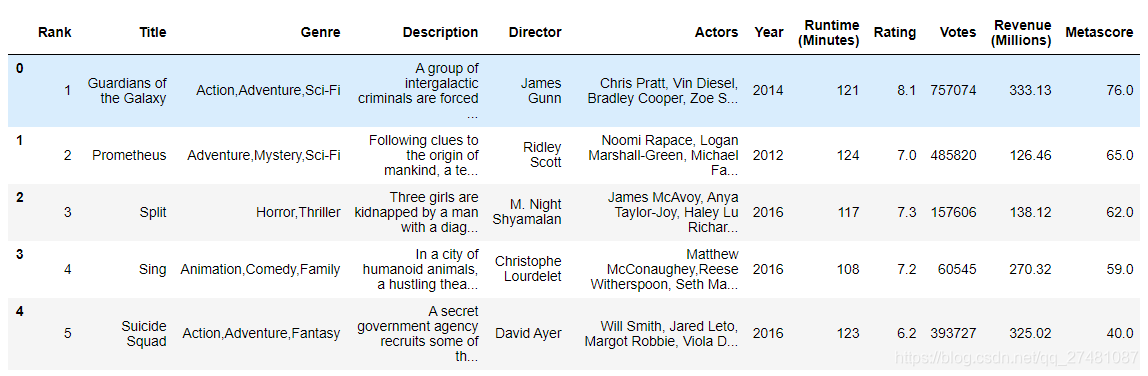
IMDB-Movie-Data.csv
# 导包
import pandas  as pd
import numpy as np
from matplotlib import pyplot as plt

# 读取文件显示前5行信息
path = "./data/IMDB-Movie-Data.csv"
#读取文件
df = pd.read_csv(path)
df.head()
1.电影数据中评分的平均分
df["Rating"].mean()
# 6.723199999999999
2.导演的人数
np.unique(df["Director"]).shape[0]
# 644
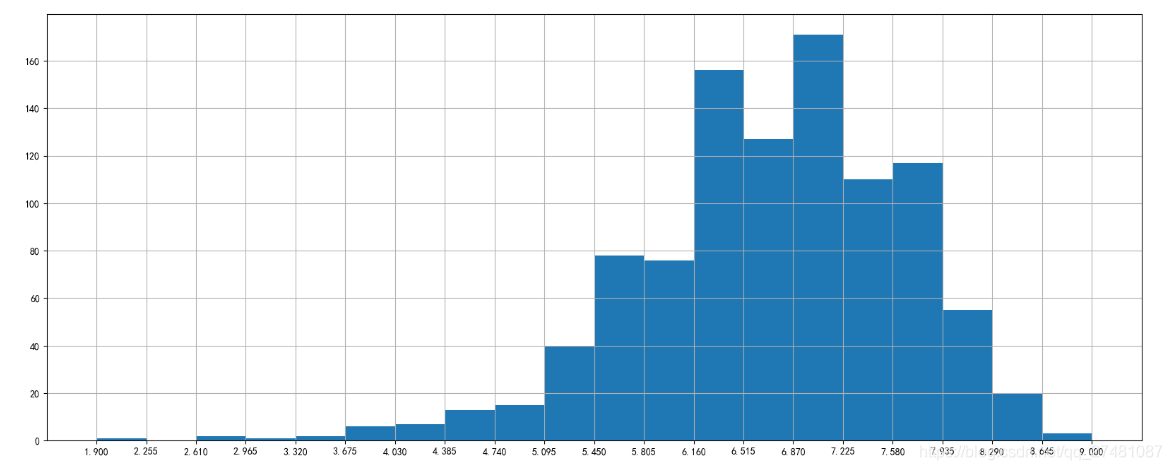
3.呈现rating,runtime的分布情况
# Rating分布

# 1.创建画布
plt.figure(figsize=(20, 8), dpi=100)

# 2.绘制图像
plt.hist(df["Rating"].values, bins=20)

# 2.1 添加刻度
max_ = df["Rating"].max()
min_ = df["Rating"].min()

t1 = np.linspace(min_, max_, num=21)

plt.xticks(t1)

# 2.2 添加网格
plt.grid()

# 3.显示
plt.show()
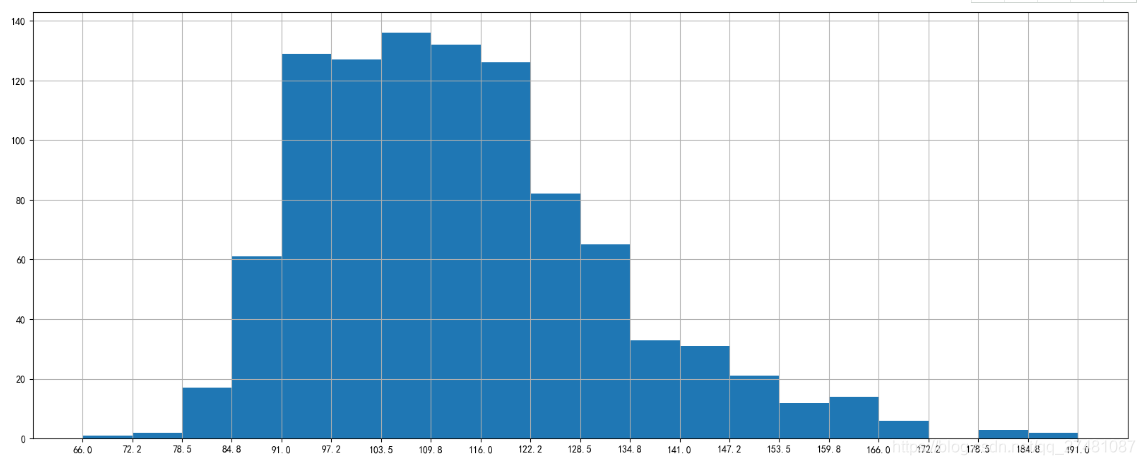
# Runtime (Minutes)分布

# 1.创建画布
plt.figure(figsize=(20, 8), dpi=100)

# 2.绘制图像
plt.hist(df["Runtime (Minutes)"].values, bins=20)

# 2.1 添加刻度
max_ = df["Runtime (Minutes)"].max()
min_ = df["Runtime (Minutes)"].min()

t1 = np.linspace(min_, max_, num=21)

plt.xticks(t1)

# 2.2 添加网格
plt.grid()

# 3.显示
plt.show()
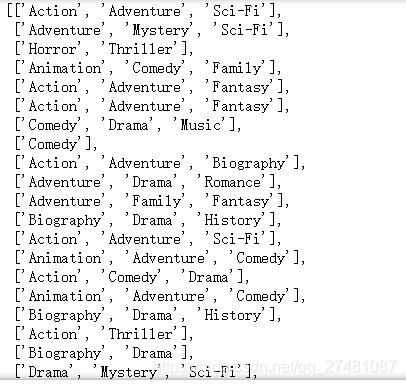
4.统计电影分类(genre)的情况
temp_list = [i.split(',') for i in df["Genre"]]
temp_list
# 获取电影的分类
genre_list = np.unique([i for j in temp_list for i in j])
genre_list

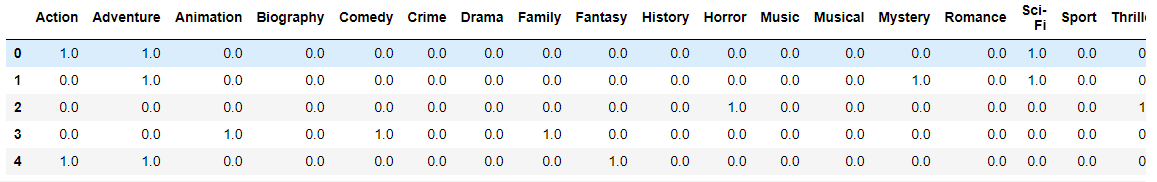
temp_df = pd.DataFrame(np.zeros([df.shape[0],genre_list.shape[0]]),columns=genre_list)
temp_df.shape
# (1000, 20)
temp_df.head()

for i in range(df.shape[0]):
    temp_df.ix[i,temp_list[i]]=1
temp_df.head()
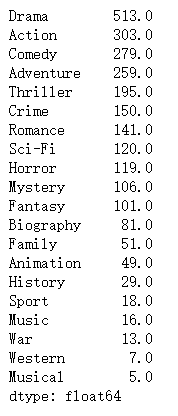
temp_df.sum().sort_values(ascending=False)
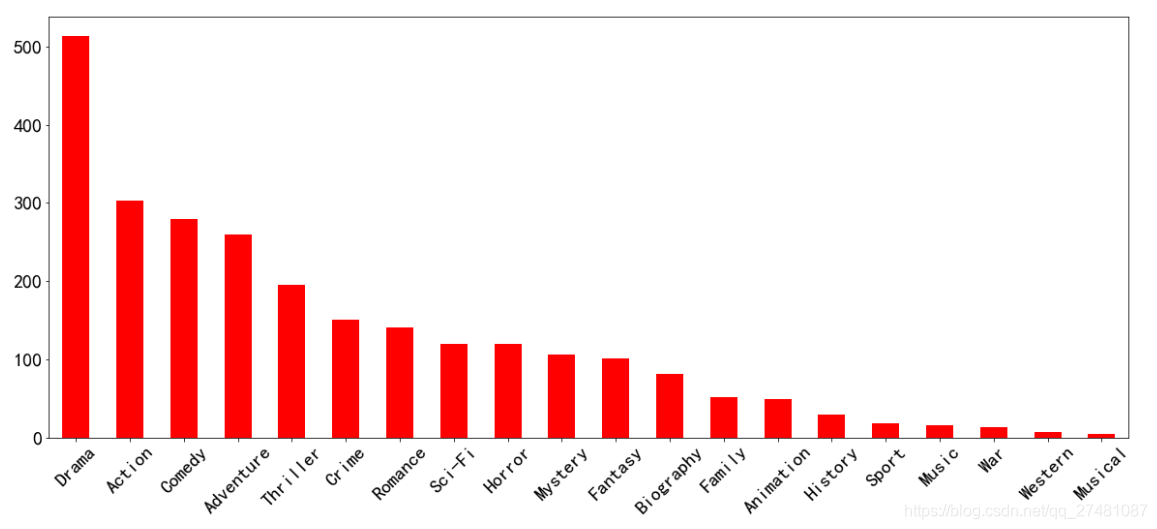
temp_df.sum().sort_values(ascending=False).plot(kind="bar",figsize=(20,8),fontsize=20, color='r', rot=45)


 1558
1558

 被折叠的 条评论
为什么被折叠?
被折叠的 条评论
为什么被折叠?
 到【灌水乐园】发言


