


文章目录
- 0.系列目录
- 1.前言
- 2.Telegraf
- 2.1 安装
- 2.2配置
- 2.2.1 inputs.system.conf
- 2.2.2 inputs.activemq.conf
- 2.2.3 inputs.apache.conf
- 2.2.4 inputs.elasticsearch.conf
- 2.2.5 inputs.kafka.conf
- 2.2.6 inputs.mongodb.conf
- 2.2.7 inputs.mysql.conf
- 2.2.8 inputs.nginx.conf
- 2.2.9 inputs.ping.conf
- 2.2.10 inputs.rabbitmq.conf
- 2.2.11 inputs.redis.conf
- 2.2.11 inputs.zookeeper.conf
- 2.3 启动。
学海无涯,旅“途”漫漫,“途”中小记,如有错误,敬请指出,在此拜谢!
0.系列目录
服务器监控-prometheus使用(1):简介篇
服务器监控-prometheus使用(2):promethues搭建篇
服务器监控-prometheus使用(3):Grafana搭建篇
服务器监控-prometheus使用(4):收集器搭建篇
服务器监控-prometheus使用(5):告警器搭建篇
1.前言
prometheus提供了茫茫多的收集器exporter,就是因为太多了,导致有点挑花眼,并且各各服务器的配置方式没法统一,就导致rules的文件,没法编写。所以俺暂时使用了Telegraf。
2.Telegraf
2.1 安装
吐槽一下Telegraf是真的难下,去了官网,找了一堆下载地址都没有下载下来,官网是
https://portal.influxdata.com/downloads/
但是在下载页,不管怎么选择都下载不下来,我就怀疑,是不是被墙了,捣鼓了一阵,果然是被墙了。这个页面如果在选择版本,正常的话,下面应该会显示如下图所示的下载地址:

上面的内容是
wget https://dl.influxdata.com/telegraf/releases/telegraf-1.21.0~rc1_windows_amd64.zip -UseBasicParsing -OutFile telegraf-1.21.0~rc1_windows_amd64.zip
Expand-Archive .\telegraf-1.21.0~rc1_windows_amd64.zip -DestinationPath 'C:\Program Files\InfluxData\telegraf'
俺又一顿整windows版的wget。发现仍然是不好使,显示host not found。俺的小脑袋灵机一动,访问了内容里面的下面网址:
https://dl.influxdata.com/telegraf/releases/telegraf-1.21.0~rc1_windows_amd64.zip
下载成功!谢天谢地!俺的老天爷啊!下面我把所有的都记录下来,供大家参看
-- centos & redhat
wget https://dl.influxdata.com/telegraf/releases/telegraf-1.21.0-0.rc1.x86_64.rpm
sudo yum localinstall telegraf-1.21.0-0.rc1.x86_64.rpm

-- ubuntu & debian
wget https://dl.influxdata.com/telegraf/releases/telegraf_1.21.0~rc1-1_amd64.deb
sudo dpkg -i telegraf_1.21.0~rc1-1_amd64.deb

-- macOS
https://dl.influxdata.com/telegraf/releases/telegraf-1.21.0~rc1_darwin_amd64.dmg

-- linux 64
wget https://dl.influxdata.com/telegraf/releases/telegraf-1.21.0~rc1_linux_amd64.tar.gz
tar xf telegraf-1.21.0~rc1_linux_amd64.tar.gz

-- linux 32
wget https://dl.influxdata.com/telegraf/releases/telegraf-1.21.0~rc1_linux_i386.tar.gz
tar xf telegraf-1.21.0~rc1_linux_i386.tar.gz

-- linux armv7
wget https://dl.influxdata.com/telegraf/releases/telegraf-1.21.0~rc1_linux_armhf.tar.gz
tar xf telegraf-1.21.0~rc1_linux_armhf.tar.gz

-- linux armv8
wget https://dl.influxdata.com/telegraf/releases/telegraf-1.21.0~rc1_linux_arm64.tar.gz
tar xf telegraf-1.21.0~rc1_linux_arm64.tar.gz
2.2配置
因为在启动的时候,要配置输出内容,所以我们可以创建文件夹,统一输出内容。比如我们创建一个telegraf.d的文件夹,把我们要输出的内容都放进去。

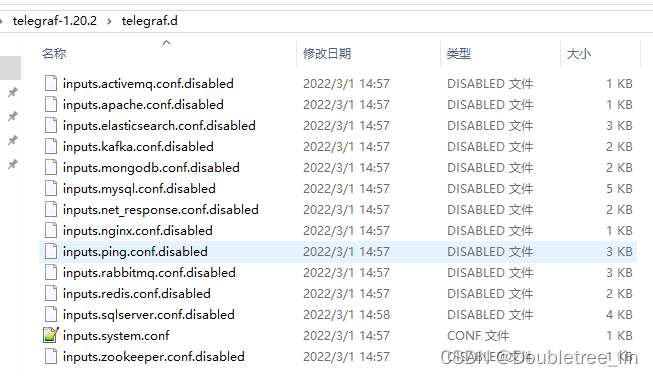
其中要用哪个,就可以把文件名的disabled去掉。其中各文档内容如下所示
2.2.1 inputs.system.conf
[[inputs.cpu]]
  percpu = true
  totalcpu = true
  collect_cpu_time = false
  report_active = false
[inputs.cpu.tags]
    _router_key = "system"

[[inputs.disk]]
  ignore_fs = ["tmpfs", "devtmpfs", "devfs", "iso9660", "overlay", "aufs", "squashfs"]
[inputs.disk.tags]
  _router_key = "system"

[[inputs.diskio]]
[inputs.diskio.tags]
  _router_key = "system"

[[inputs.kernel]]
[inputs.kernel.tags]
  _router_key = "system"

[[inputs.mem]]
[inputs.mem.tags]
  _router_key = "system"

[[inputs.processes]]
[inputs.processes.tags]
  _router_key = "system"

[[inputs.swap]]
[inputs.swap.tags]
  _router_key = "system"

[[inputs.system]]
[inputs.system.tags]
  _router_key = "system"

[[outputs.prometheus_client]]
  listen = ":19200"
  collectors_exclude = ["gocollector", "process"]
[outputs.prometheus_client.tagpass]
  _router_key = ["system"]
2.2.2 inputs.activemq.conf
[[inputs.activemq]]
  ## ActiveMQ WebConsole URL
  url = "http://127.0.0.1:8161"

  username = "admin"
  password = "admin"

  ## Required ActiveMQ webadmin root path
  # webadmin = "admin"

[inputs.activemq.tags]
  # 路由键,不要修改该选项
  _router_key = "activemq"
  # 服务的分组,一般为所属项目
  group = "naoms"
  # 服务名
  # 如果项目中存在多个实例,用来描述属于哪个实例
  service = "external"

[[outputs.prometheus_client]]
  listen = ":19510"
  collectors_exclude = ["gocollector", "process"]
[outputs.prometheus_client.tagpass]
  _router_key = ["activemq"]
2.2.3 inputs.apache.conf
# # Read Apache status information (mod_status)
# [[inputs.apache]]
#   ## An array of URLs to gather from, must be directed at the machine
#   ## readable version of the mod_status page including the auto query string.
#   ## Default is "http://localhost/server-status?auto".
#   urls = ["http://localhost/server-status?auto"]
#
#   ## Credentials for basic HTTP authentication.
#   # username = "myuser"
#   # password = "mypassword"
#
#   ## Maximum time to receive response.
#   # response_timeout = "5s"
#
#   ## Optional TLS Config
#   # tls_ca = "/etc/telegraf/ca.pem"
#   # tls_cert = "/etc/telegraf/cert.pem"
#   # tls_key = "/etc/telegraf/key.pem"
#   ## Use TLS but skip chain & host verification
#   # insecure_skip_verify = false
[inputs.apache.tags]
    _router_key = "apache"

[[outputs.prometheus_client]]
  listen = ":19350"
  collectors_exclude = ["gocollector", "process"]
[outputs.prometheus_client.tagpass]
  _router_key = ["apache"]
2.2.4 inputs.elasticsearch.conf
# # Read stats from one or more Elasticsearch servers or clusters
# [[inputs.elasticsearch]]
#   ## specify a list of one or more Elasticsearch servers
#   # you can add username and password to your url to use basic authentication:
#   # servers = ["http://user:pass@localhost:9200"]
#   servers = ["http://localhost:9200"]
#
#   ## Timeout for HTTP requests to the elastic search server(s)
#   http_timeout = "5s"
#
#   ## When local is true (the default), the node will read only its own stats.
#   ## Set local to false when you want to read the node stats from all nodes
#   ## of the cluster.
#   local = true
#
#   ## Set cluster_health to true when you want to also obtain cluster health stats
#   cluster_health = false
#
#   ## Adjust cluster_health_level when you want to also obtain detailed health stats
#   ## The options are
#   ##  - indices (default)
#   ##  - cluster
#   # cluster_health_level = "indices"
#
#   ## Set cluster_stats to true when you want to also obtain cluster stats.
#   cluster_stats = false
#
#   ## Only gather cluster_stats from the master node. To work this require local = true
#   cluster_stats_only_from_master = true
#
#   ## Indices to collect; can be one or more indices names or _all
#   ## Use of wildcards is allowed. Use a wildcard at the end to retrieve index names that end with a changing value, like a date.
#   indices_include = ["_all"]
#
#   ## One of "shards", "cluster", "indices"
#   indices_level = "shards"
#
#   ## node_stats is a list of sub-stats that you want to have gathered. Valid options
#   ## are "indices", "os", "process", "jvm", "thread_pool", "fs", "transport", "http",
#   ## "breaker". Per default, all stats are gathered.
#   # node_stats = ["jvm", "http"]
#
#   ## HTTP Basic Authentication username and password.
#   # username = ""
#   # password = ""
#
#   ## Optional TLS Config
#   # tls_ca = "/etc/telegraf/ca.pem"
#   # tls_cert = "/etc/telegraf/cert.pem"
#   # tls_key = "/etc/telegraf/key.pem"
#   ## Use TLS but skip chain & host verification
#   # insecure_skip_verify = false

[inputs.elasticsearch.tags]
  _router_key = "elasticsearch"
  # 服务的分组,一般为所属项目
  group = "naoms"
  # 服务名
  # 如果项目中存在多个实例,用来描述属于哪个实例
  service = "external"


[[outputs.prometheus_client]]
  listen = ":19440"
  collectors_exclude = ["gocollector", "process"]
[outputs.prometheus_client.tagpass]
  _router_key = ["elasticsearch"]
2.2.5 inputs.kafka.conf
# # Collect Kafka topics and consumers status from Burrow HTTP API.
# [[inputs.burrow]]
#   ## Burrow API endpoints in format "schema://host:port".
#   ## Default is "http://localhost:8000".
#   servers = ["http://localhost:8000"]
#
#   ## Override Burrow API prefix.
#   ## Useful when Burrow is behind reverse-proxy.
#   # api_prefix = "/v3/kafka"
#
#   ## Maximum time to receive response.
#   # response_timeout = "5s"
#
#   ## Limit per-server concurrent connections.
#   ## Useful in case of large number of topics or consumer groups.
#   # concurrent_connections = 20
#
#   ## Filter clusters, default is no filtering.
#   ## Values can be specified as glob patterns.
#   # clusters_include = []
#   # clusters_exclude = []
#
#   ## Filter consumer groups, default is no filtering.
#   ## Values can be specified as glob patterns.
#   # groups_include = []
#   # groups_exclude = []
#
#   ## Filter topics, default is no filtering.
#   ## Values can be specified as glob patterns.
#   # topics_include = []
#   # topics_exclude = []
#
#   ## Credentials for basic HTTP authentication.
#   # username = ""
#   # password = ""
#
#   ## Optional SSL config
#   # ssl_ca = "/etc/telegraf/ca.pem"
#   # ssl_cert = "/etc/telegraf/cert.pem"
#   # ssl_key = "/etc/telegraf/key.pem"
#   # insecure_skip_verify = false

[inputs.burrow.tags]
  _router_key = "kafka"

[[outputs.prometheus_client]]
  listen = ":19530"
  collectors_exclude = ["gocollector", "process"]
[outputs.prometheus_client.tagpass]
  _router_key = ["kafka"]
2.2.6 inputs.mongodb.conf
# # Read metrics from one or many MongoDB servers
# [[inputs.mongodb]]
#   ## An array of URLs of the form:
#   ##   "mongodb://" [user ":" pass "@"] host [ ":" port]
#   ## For example:
#   ##   mongodb://user:auth_key@10.10.3.30:27017,
#   ##   mongodb://10.10.3.33:18832,
#   servers = ["mongodb://127.0.0.1:27017"]
#
#   ## When true, collect cluster status
#   ## Note that the query that counts jumbo chunks triggers a COLLSCAN, which
#   ## may have an impact on performance.
#   # gather_cluster_status = true
#
#   ## When true, collect per database stats
#   # gather_perdb_stats = false
#
#   ## When true, collect per collection stats
#   # gather_col_stats = false
#
#   ## When true, collect usage statistics for each collection
#   ## (insert, update, queries, remove, getmore, commands etc...).
#   # gather_top_stat = false
#
#   ## List of db where collections stats are collected
#   ## If empty, all db are concerned
#   # col_stats_dbs = ["local"]
#
#   ## Optional TLS Config
#   # tls_ca = "/etc/telegraf/ca.pem"
#   # tls_cert = "/etc/telegraf/cert.pem"
#   # tls_key = "/etc/telegraf/key.pem"
#   ## Use TLS but skip chain & host verification
#   # insecure_skip_verify = false

[inputs.mongodb.tags]
  _router_key = "mongodb"

[[outputs.prometheus_client]]
  listen = ":19430"
  collectors_exclude = ["gocollector", "process"]
[outputs.prometheus_client.tagpass]
  _router_key = ["mongodb"]
2.2.7 inputs.mysql.conf
# # Read metrics from one or many mysql servers
# [[inputs.mysql]]
#   ## specify servers via a url matching:
#   ##  [username[:password]@][protocol[(address)]]/[?tls=[true|false|skip-verify|custom]]
#   ##  see https://github.com/go-sql-driver/mysql#dsn-data-source-name
#   ##  e.g.
#   ##    servers = ["user:passwd@tcp(127.0.0.1:3306)/?tls=false"]
#   ##    servers = ["user@tcp(127.0.0.1:3306)/?tls=false"]
#   #
#   ## If no servers are specified, then localhost is used as the host.
#   servers = ["tcp(127.0.0.1:3306)/"]
#
#   ## Selects the metric output format.
#   ##
#   ## This option exists to maintain backwards compatibility, if you have
#   ## existing metrics do not set or change this value until you are ready to
#   ## migrate to the new format.
#   ##
#   ## If you do not have existing metrics from this plugin set to the latest
#   ## version.
#   ##
#   ## Telegraf >=1.6: metric_version = 2
#   ##           <1.6: metric_version = 1 (or unset)
#   metric_version = 2
#
#   ## if the list is empty, then metrics are gathered from all database tables
#   # table_schema_databases = []
#
#   ## gather metrics from INFORMATION_SCHEMA.TABLES for databases provided above list
#   # gather_table_schema = false
#
#   ## gather thread state counts from INFORMATION_SCHEMA.PROCESSLIST
#   # gather_process_list = false
#
#   ## gather user statistics from INFORMATION_SCHEMA.USER_STATISTICS
#   # gather_user_statistics = false
#
#   ## gather auto_increment columns and max values from information schema
#   # gather_info_schema_auto_inc = false
#
#   ## gather metrics from INFORMATION_SCHEMA.INNODB_METRICS
#   # gather_innodb_metrics = false
#
#   ## gather metrics from SHOW SLAVE STATUS command output
#   # gather_slave_status = false
#
#   ## gather metrics from all channels from SHOW SLAVE STATUS command output
#   # gather_all_slave_channels = false
#
#   ## use MariaDB dialect for all channels SHOW SLAVE STATUS
#   # mariadb_dialect = false
#
#   ## gather metrics from SHOW BINARY LOGS command output
#   # gather_binary_logs = false
#
#   ## gather metrics from PERFORMANCE_SCHEMA.GLOBAL_VARIABLES
#   # gather_global_variables = true
#
#   ## gather metrics from PERFORMANCE_SCHEMA.TABLE_IO_WAITS_SUMMARY_BY_TABLE
#   # gather_table_io_waits = false
#
#   ## gather metrics from PERFORMANCE_SCHEMA.TABLE_LOCK_WAITS
#   # gather_table_lock_waits = false
#
#   ## gather metrics from PERFORMANCE_SCHEMA.TABLE_IO_WAITS_SUMMARY_BY_INDEX_USAGE
#   # gather_index_io_waits = false
#
#   ## gather metrics from PERFORMANCE_SCHEMA.EVENT_WAITS
#   # gather_event_waits = false
#
#   ## gather metrics from PERFORMANCE_SCHEMA.FILE_SUMMARY_BY_EVENT_NAME
#   # gather_file_events_stats = false
#
#   ## gather metrics from PERFORMANCE_SCHEMA.EVENTS_STATEMENTS_SUMMARY_BY_DIGEST
#   # gather_perf_events_statements = false
#
#   ## the limits for metrics form perf_events_statements
#   # perf_events_statements_digest_text_limit = 120
#   # perf_events_statements_limit = 250
#   # perf_events_statements_time_limit = 86400
#
#   ## gather metrics from PERFORMANCE_SCHEMA.EVENTS_STATEMENTS_SUMMARY_BY_ACCOUNT_BY_EVENT_NAME
#   # gather_perf_sum_per_acc_per_event         = false
#
#   ## list of events to be gathered for gather_perf_sum_per_acc_per_event
#   ## in case of empty list all events will be gathered
#   # perf_summary_events                       = []
#
#   ## Some queries we may want to run less often (such as SHOW GLOBAL VARIABLES)
#   ##   example: interval_slow = "30m"
#   # interval_slow = ""
#
#   ## Optional TLS Config (will be used if tls=custom parameter specified in server uri)
#   # tls_ca = "/etc/telegraf/ca.pem"
#   # tls_cert = "/etc/telegraf/cert.pem"
#   # tls_key = "/etc/telegraf/key.pem"
#   ## Use TLS but skip chain & host verification
#   # insecure_skip_verify = false

[inputs.mysql.tags]
  _router_key = "mysql"

[[outputs.prometheus_client]]
  listen = ":19410"
  collectors_exclude = ["gocollector", "process"]
[outputs.prometheus_client.tagpass]
  _router_key = ["mysql"]
2.2.8 inputs.nginx.conf
# # Read Nginx's basic status information (ngx_http_stub_status_module)
# [[inputs.nginx]]
#   # An array of Nginx stub_status URI to gather stats.
#   urls = ["http://localhost/server_status"]
#
#   ## Optional TLS Config
#   tls_ca = "/etc/telegraf/ca.pem"
#   tls_cert = "/etc/telegraf/cert.cer"
#   tls_key = "/etc/telegraf/key.key"
#   ## Use TLS but skip chain & host verification
#   insecure_skip_verify = false
#
#   # HTTP response timeout (default: 5s)
#   response_timeout = "5s"

[inputs.nginx.tags]
  _router_key = "nginx"

[[outputs.prometheus_client]]
  listen = ":19360"
  collectors_exclude = ["gocollector", "process"]
[outputs.prometheus_client.tagpass]
  _router_key = ["nginx"]
2.2.9 inputs.ping.conf
[[inputs.ping]]
#   ## Hosts to send ping packets to.
  urls = ["192.16.2.66", "192.16.2.82", "192.16.2.249"]
#
#   ## Method used for sending pings, can be either "exec" or "native".  When set
#   ## to "exec" the systems ping command will be executed.  When set to "native"
#   ## the plugin will send pings directly.
#   ##
#   ## While the default is "exec" for backwards compatibility, new deployments
#   ## are encouraged to use the "native" method for improved compatibility and
#   ## performance.
#   # method = "exec"
#
#   ## Number of ping packets to send per interval.  Corresponds to the "-c"
#   ## option of the ping command.
#   # count = 1
#
#   ## Time to wait between sending ping packets in seconds.  Operates like the
#   ## "-i" option of the ping command.
#   # ping_interval = 1.0
#
#   ## If set, the time to wait for a ping response in seconds.  Operates like
#   ## the "-W" option of the ping command.
#   # timeout = 1.0
#
#   ## If set, the total ping deadline, in seconds.  Operates like the -w option
#   ## of the ping command.
#   # deadline = 10
#
#   ## Interface or source address to send ping from.  Operates like the -I or -S
#   ## option of the ping command.
#   # interface = ""
#
#   ## Percentiles to calculate. This only works with the native method.
#   # percentiles = [50, 95, 99]
#
#   ## Specify the ping executable binary.
#   # binary = "ping"
#
#   ## Arguments for ping command. When arguments is not empty, the command from
#   ## the binary option will be used and other options (ping_interval, timeout,
#   ## etc) will be ignored.
#   # arguments = ["-c", "3"]
#
#   ## Use only IPv6 addresses when resolving a hostname.
#   # ipv6 = false
#
#   ## Number of data bytes to be sent. Corresponds to the "-s"
#   ## option of the ping command. This only works with the native method.
#   # size = 56
[inputs.ping.tags]
  _router_key = "ping"

[[outputs.prometheus_client]]
  listen = ":19310"
  collectors_exclude = ["gocollector", "process"]
[outputs.prometheus_client.tagpass]
  _router_key = ["ping"]
2.2.10 inputs.rabbitmq.conf
# # Reads metrics from RabbitMQ servers via the Management Plugin
# [[inputs.rabbitmq]]
#   ## Management Plugin url. (default: http://localhost:15672)
#   # url = "http://localhost:15672"
#   ## Tag added to rabbitmq_overview series; deprecated: use tags
#   # name = "rmq-server-1"
#   ## Credentials
#   # username = "guest"
#   # password = "guest"
#
#   ## Optional TLS Config
#   # tls_ca = "/etc/telegraf/ca.pem"
#   # tls_cert = "/etc/telegraf/cert.pem"
#   # tls_key = "/etc/telegraf/key.pem"
#   ## Use TLS but skip chain & host verification
#   # insecure_skip_verify = false
#
#   ## Optional request timeouts
#   ##
#   ## ResponseHeaderTimeout, if non-zero, specifies the amount of time to wait
#   ## for a server's response headers after fully writing the request.
#   # header_timeout = "3s"
#   ##
#   ## client_timeout specifies a time limit for requests made by this client.
#   ## Includes connection time, any redirects, and reading the response body.
#   # client_timeout = "4s"
#
#   ## A list of nodes to gather as the rabbitmq_node measurement. If not
#   ## specified, metrics for all nodes are gathered.
#   # nodes = ["rabbit@node1", "rabbit@node2"]
#
#   ## A list of queues to gather as the rabbitmq_queue measurement. If not
#   ## specified, metrics for all queues are gathered.
#   # queues = ["telegraf"]
#
#   ## A list of exchanges to gather as the rabbitmq_exchange measurement. If not
#   ## specified, metrics for all exchanges are gathered.
#   # exchanges = ["telegraf"]
#
#   ## Metrics to include and exclude. Globs accepted.
#   ## Note that an empty array for both will include all metrics
#   ## Currently the following metrics are supported: "exchange", "federation", "node", "overview", "queue"
#   # metric_include = []
#   # metric_exclude = []
#
#   ## Queues to include and exclude. Globs accepted.
#   ## Note that an empty array for both will include all queues
#   queue_name_include = []
#   queue_name_exclude = []
#
#   ## Federation upstreams include and exclude when gathering the rabbitmq_federation measurement.
#   ## If neither are specified, metrics for all federation upstreams are gathered.
#   ## Federation link metrics will only be gathered for queues and exchanges
#   ## whose non-federation metrics will be collected (e.g a queue excluded
#   ## by the 'queue_name_exclude' option will also be excluded from federation).
#   ## Globs accepted.
#   # federation_upstream_include = ["dataCentre-*"]
#   # federation_upstream_exclude = []
[inputs.rabbitmq.tags]
  _router_key = "rabbitmq"

[[outputs.prometheus_client]]
  listen = ":19520"
  collectors_exclude = ["gocollector", "process"]
[outputs.prometheus_client.tagpass]
  _router_key = ["rabbitmq"]
2.2.11 inputs.redis.conf
# # Read metrics from one or many redis servers
# [[inputs.redis]]
#   ## specify servers via a url matching:
#   ##  [protocol://][:password]@address[:port]
#   ##  e.g.
#   ##    tcp://localhost:6379
#   ##    tcp://:password@192.168.99.100
#   ##    unix:///var/run/redis.sock
#   ##
#   ## If no servers are specified, then localhost is used as the host.
#   ## If no port is specified, 6379 is used
#   servers = ["tcp://localhost:6379"]
#
#   ## Optional. Specify redis commands to retrieve values
#   # [[inputs.redis.commands]]
#   #   # The command to run where each argument is a separate element
#   #   command = ["get", "sample-key"]
#   #   # The field to store the result in
#   #   field = "sample-key-value"
#   #   # The type of the result
#   #   # Can be "string", "integer", or "float"
#   #   type = "string"
#
#   ## specify server password
#   # password = "s#cr@t%"
#
#   ## Optional TLS Config
#   # tls_ca = "/etc/telegraf/ca.pem"
#   # tls_cert = "/etc/telegraf/cert.pem"
#   # tls_key = "/etc/telegraf/key.pem"
#   ## Use TLS but skip chain & host verification
#   # insecure_skip_verify = true
[inputs.redis.tags]
  _router_key = "redis"

[[outputs.prometheus_client]]
  listen = ":19450"
  collectors_exclude = ["gocollector", "process"]
[outputs.prometheus_client.tagpass]
  _router_key = ["redis"]
2.2.11 inputs.zookeeper.conf
# # Reads 'mntr' stats from one or many zookeeper servers
# [[inputs.zookeeper]]
#   ## An array of address to gather stats about. Specify an ip or hostname
#   ## with port. ie localhost:2181, 10.0.0.1:2181, etc.
#
#   ## If no servers are specified, then localhost is used as the host.
#   ## If no port is specified, 2181 is used
#   servers = [":2181"]
#
#   ## Timeout for metric collections from all servers.  Minimum timeout is "1s".
#   # timeout = "5s"
#
#   ## Optional TLS Config
#   # enable_tls = true
#   # tls_ca = "/etc/telegraf/ca.pem"
#   # tls_cert = "/etc/telegraf/cert.pem"
#   # tls_key = "/etc/telegraf/key.pem"
#   ## If false, skip chain & host verification
#   # insecure_skip_verify = true
[inputs.zookeeper.tags]
  _router_key = "zookeeper"

[[outputs.prometheus_client]]
  listen = ":19610"
  collectors_exclude = ["gocollector", "process"]
[outputs.prometheus_client.tagpass]
  _router_key = ["zookeeper"]
2.3 启动。
启动的时候,需要指定以下参数:
(1)conf文件夹的位置:此位置可以在启动命令中指定,或者在环境变量中配置,不然就会出现以下报错。

(2)output参数内容:
所以总命令为:
-config (conf文件地址) -config-directory (输出内容文件地址)
例如:
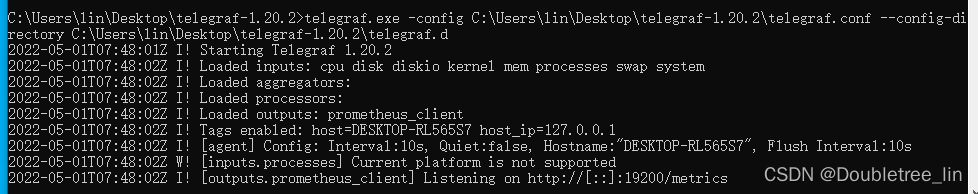
# Windows中启动
telegraf.exe -config C:\Users\lin\Desktop\telegraf-1.20.2\telegraf.conf --config-directory C:\Users\lin\Desktop\telegraf-1.20.2\telegraf.d
启动成功后,会出现如图所示
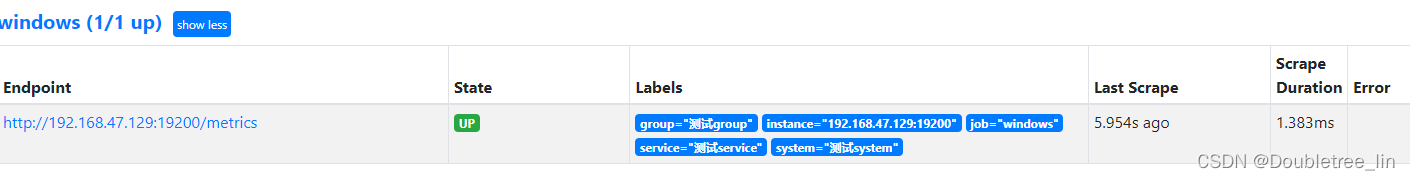
当打开prometheus的页面,点击status->Target页面的时候,就会出现如下图,则证明prometheus已连接成功
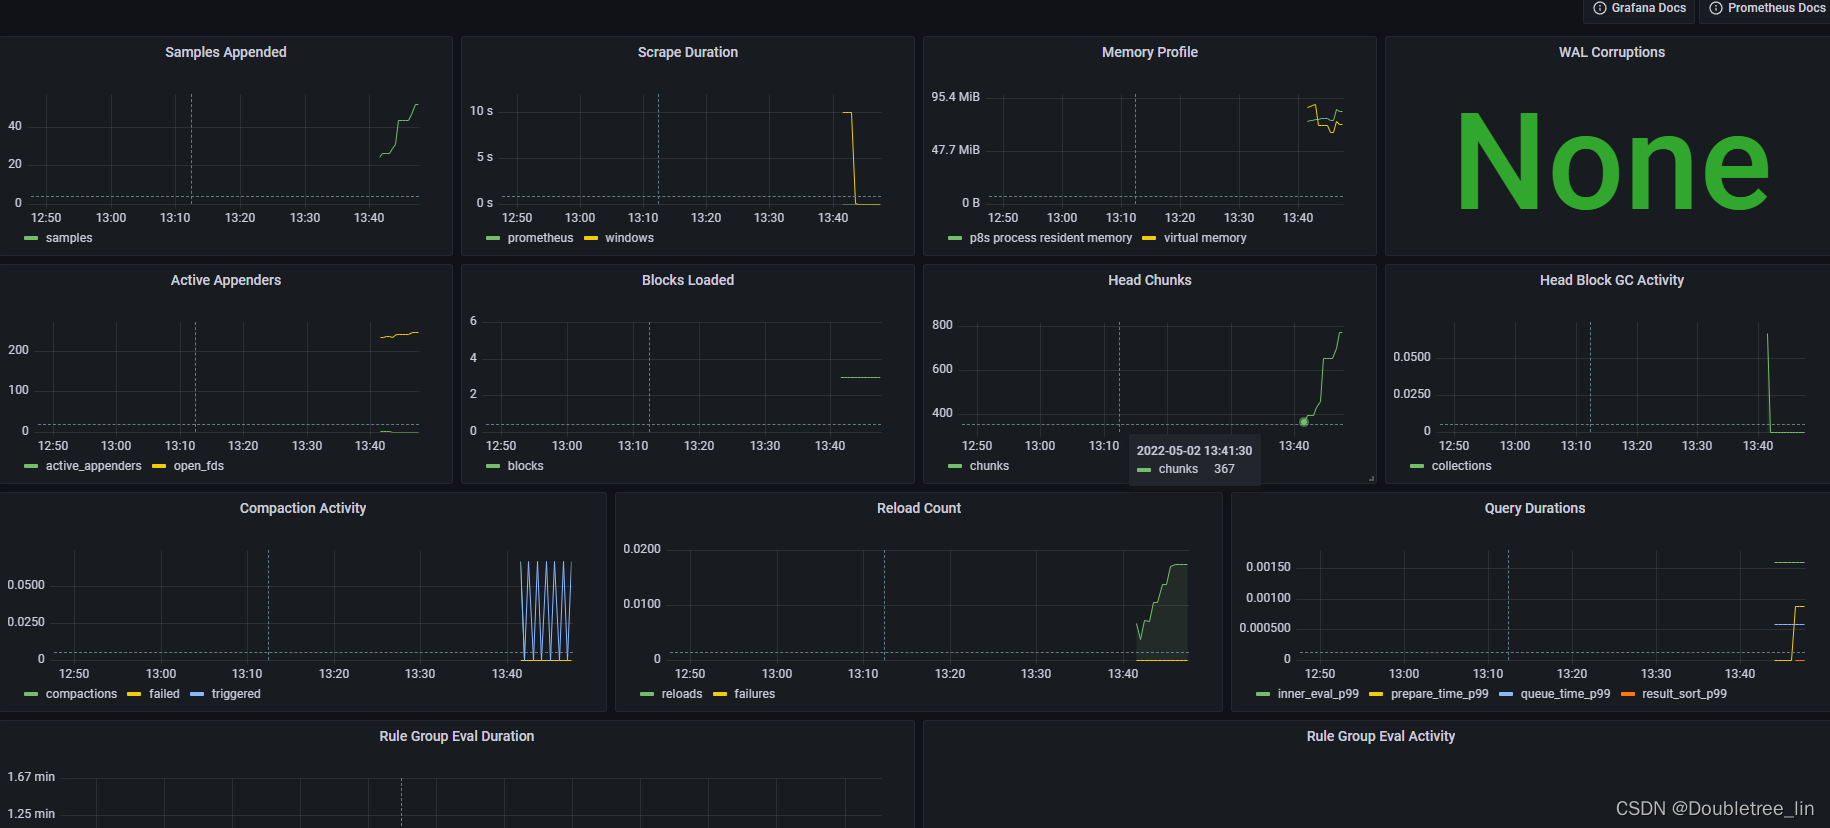
再打开Grafana后,能看到已经有数据进入了


 588
588


 被折叠的 条评论
为什么被折叠?
被折叠的 条评论
为什么被折叠?
 到【灌水乐园】发言


