


Prometheus+grafana安装步骤
1. 环境准备
1.1 系统
CentOS Linux release 7.4.1708 (Core)
1.2 软件下载
Prometheus下载地址
https://prometheus.io/download/
下载Prometheus+node_exporter+alertmanager
wget https://github.com/prometheus/prometheus/releases/download/v2.27.0-rc.0/prometheus-2.27.0-rc.0.linux-amd64.tar.gz
wget https://github.com/prometheus/node_exporter/releases/download/v1.1.2/node_exporter-1.1.2.linux-amd64.tar.gz
wget https://github.com/prometheus/alertmanager/releases/download/v0.22.0-rc.0/alertmanager-0.22.0-rc.0.linux-amd64.tar.gz
grafana 下载
https://grafana.com/grafana/download
wget https://dl.grafana.com/oss/release/grafana-7.5.5-1.x86_64.rpm
sudo yum install grafana-7.5.5-1.x86_64.rpm
1.3 安装ntp
#安装ntp的目的是为了避免时间偏移,prometheus如果时间有偏移将无法获取信息。
yum install -y ntp
systemctl enable ntpd && systemctl start ntpd
#如果时间没有同步手动选择时间服务器
[root@localhost local]# ntpdate time3.aliyun.com
10 May 13:51:04 ntpdate[15914]: step time server 203.107.6.88 offset -28801.501282 sec
1.4 关闭防火墙和selinux
为了方便安装,所以关闭,生产环境看自身需求决定关闭或开启。如果开启记得开端口。
systemctl status firewalld.service
systemctl stop firewalld.service
systemctl disable firewalld.service
sed -i 's/SELINUX=enforcing/SELINUX=disabled/g' /etc/selinux/config
cat /etc/selinux/config
临时关闭selinux
[root@localhost ~]# getenforce #查看selinux状态
Enforcing
[root@localhost ~]# setenforce 0 #0为关闭,1为开启
[root@localhost ~]# getenforce
Permissive
2.安装prometheus
2.1 解压到安装路径,创建数据目录
 tar xzf prometheus-2.26.0.linux-amd64.tar.gz -C /usr/local/
 cd /usr/local/
 mv prometheus-2.26.0.linux-amd64 prometheus
mkdir -p /data/prometheus/prometheus/data
2.2 托管到systemd
vim /usr/lib/systemd/system/prometheus.service
[Unit]
Description= Prometheus
After=network.target

[Service]
Type=simple
User=root #注意这里是设置prometheus的属主和属组,如果之前改为了prometheus或者其他用户记得修改,为了方便我直接使用的root
#这里要注意路径!另外prometheus不是重复的,而是启动程序。
ExecStart=/usr/local/prometheus/prometheus --config.file=/usr/local/prometheus/prometheus.yml --storage.tsdb.path=/data/prometheus/prometheus/data
ExecReload=/bin/kill -HUP $MAINPID
Restart=on-failure

[Install]
WantedBy=multi-user.target
2.3 设置自启动
systemctl enable prometheus.service
systemctl start prometheus.service
systemctl status prometheus.service
tips
如果之后修改了/usr/lib/systemd/system/下的配置文件记得reload
systemctl daemon-reload
启动之后访问本机9090端口应有以下显示

2.4 添加节点
在被监控机上开启node_exporter之后在prometheus.yml中添加节点
vim /usr/local/prometheus/prometheus.yml
  - job_name: 'linux-node'
    static_configs:
    - targets: ['192.168.139.131:9100']
重新启动
[root@localhost ~]# systemctl restart prometheus.service
[root@localhost ~]# systemctl status prometheus.service
● prometheus.service - Prometheus
   Loaded: loaded (/usr/lib/systemd/system/prometheus.service; enabled; vendor preset: disabled)
   Active: active (running) since Mon 2021-05-10 14:44:50 CST; 1min 33s ago
 Main PID: 1398 (prometheus)
   CGroup: /system.slice/prometheus.service
           └─1398 /usr/local/prometheus/prometheus --config.file=/usr/local/prometheus/prometheus.yml --storage.ts...
在prometheus中可以查看到节点信息


3.在被监控端安装node_exporter
3.1 解压到安装目录
tar -xzf node_exporter-1.1.2.linux-amd64.tar.gz -C /usr/local/
cd /usr/local/
mv node_exporter-1.1.2.linux-amd64 node_exporter
3.2 托管到systemd
vim /usr/lib/systemd/system/node_exporter.service
[Unit]
Description=node-exporter

[Service]
ExecStart=/usr/local/node_exporter/node_exporter

[Install]
WantedBy=multi-user.target
3.3 自启动
systemctl start node_exporter
systemctl enable node_exporter
systemctl status node_exporter
启动之后访问本机9100端口有以下显示为正常


4 安装 alertmanager告警
4.1解压到安装目录
tar xzf alertmanager-0.22.0-rc.0.linux-amd64.tar.gz -C /usr/local/
cd /usr/local/
mv alertmanager-0.22.0-rc.0.linux-amd64 alertmanager
4.2 设置systemd
vim /usr/lib/systemd/system/alertmanager.service
[Unit]
Description=https://prometheus.io

[Service]
ExecStart=/usr/local/alertmanager/alertmanager --config.file=/usr/local/alertmanager/alertmanager.yml --storage.path=/usr/local/alertmanager/data

[Install]
WantedBy=multi-user.target

4.3 设置自启动
systemctl start alertmanager.service
systemctl enable alertmanager.service
systemctl status alertmanager.service
4.4 创建报警规则
#创建目录
 mkdir /usr/local/prometheus/rules
# 编辑报价规则
 vim /usr/local/prometheus/rules/node_alerts.yml
groups:
# 组名,报警规则组名称
- name: general.rules
  # 定义角色
  rules:
  # 告警名称。
  - alert: 磁盘使用率
    # 表达式,获取磁盘使用率 大于 1% 触发
    expr: 100 - (node_filesystem_free_bytes{mountpoint="/",fstype=~"ext4|xfs"} / node_filesystem_size_bytes{fstype=~"ext4|xfs"} * 100) > 80
    # 持续时间,表示持续 1 分钟获取不到信息,则触发报警。0 表示不使用持续时间
    for: 1m
    # 定义当前告警规则级别
    labels:
      # 指定告警级别。
      severity: warning
    # 注释,告警通知
    annotations:
      # 调用标签具体指附加通知信息
      # 自定义摘要
      summary: "Instance {{ $labels.instance  }} :{{ $labels.mountpoint }} 分区使用率过高"
      # 自定义具体描述
      description: "{{ $labels.instance  }} : {{ $labels.job  }} :{{ $labels.mountpoint  }} 这个分区使用大于百
分之80% (当前值:{{ $value }})"
在prometheus中添加报警规则
 vim /usr/local/prometheus/prometheus.yml
 rule_files:
  - /usr/local/prometheus/rules/*.yml
重启
 systemctl restart prometheus
 systemctl status prometheus
在status→rules查看

4.5 alertmanager邮件设置
vim /usr/local/alertmanager/alertmanager.yml
global:
  smtp_smarthost: smtp.qq.com:465
  smtp_from: XXXXXX@qq.com
  smtp_auth_username: XXXXXX@qq.com
  smtp_auth_identity: XXXXXX@qq.com
  smtp_auth_password: XXXXXX #注意有些邮箱这里是授权码
  smtp_require_tls: false
  resolve_timeout: 5m

route:
  group_by: ['alertname']
  group_wait: 30s
  group_interval: 5m
  repeat_interval: 1h
  receiver: 'email'


inhibit_rules:
  - source_match:
      severity: 'critical'
    target_match:
      severity: 'warning'
    equal: ['alertname', 'dev', 'instance']

receivers:
  - name: email
    email_configs:
      - to: XXXX@dingtalk.com #收件人邮箱地址
        send_resolved: true
检查alertmanager配置文件
[root@localhost alertmanager]# ./amtool  check-config alertmanager.yml
Checking 'alertmanager.yml'  SUCCESS
Found:
 - global config
 - route
 - 1 inhibit rules
 - 1 receivers
 - 0 templates
重启服务
[root@localhost alertmanager]# systemctl restart alertmanager.service
[root@localhost alertmanager]# systemctl status alertmanager.service
● alertmanager.service - https://prometheus.io
   Loaded: loaded (/usr/lib/systemd/system/alertmanager.service; disabled; vendor preset: disabled)
   Active: active (running) since Mon 2021-05-10 14:59:39 CST; 3s ago
 Main PID: 1499 (alertmanager)
   CGroup: /system.slice/alertmanager.service
           └─1499 /usr/local/alertmanager/alertmanager --config.file=/usr/local/alertmanager/alertmanager.yml
访问本机9093端口
vim /usr/local/prometheus/prometheus.yml
alerting:
  alertmanagers:
  - static_configs:
    - targets:
       - 192.168.139.130:9093
检查配置
[root@localhost prometheus]# /usr/local/prometheus/promtool check config /usr/local/prometheus/prometheus.yml
Checking /usr/local/prometheus/prometheus.yml
  SUCCESS: 1 rule files found

Checking /usr/local/prometheus/rules/hoststatus.yml
  SUCCESS: 1 rules found
#重启服务
systemctl restart prometheus.service
 systemctl status prometheus.service
在服务器上查看命令
[root@test3 alertmanager]# ./amtool alert --alertmanager.url=http://localhost:9093
4.6 测试告警
将硬盘告警规则修改为使用超过百分之一报警
vim node_alerts.yml
    groups:
# 组名,报警规则组名称
- name: general.rules
  # 定义角色
  rules:
  # 告警名称。
  - alert: 磁盘使用率
    # 表达式,获取磁盘使用率 大于 1% 触发
    expr: 100 - (node_filesystem_free_bytes{mountpoint="/",fstype=~"ext4|xfs"} / node_filesystem_size_bytes{fstype=~"ext4|xfs"} * 100) > 1
    # 持续时间,表示持续 1 分钟获取不到信息,则触发报警。0 表示不使用持续时间
    for: 1m
    # 定义当前告警规则级别
    labels:
      # 指定告警级别。
      severity: warning
    # 注释,告警通知
    annotations:
      # 调用标签具体指附加通知信息
      # 自定义摘要
      summary: "Instance {{ $labels.instance  }} :{{ $labels.mountpoint }} 分区使用率过高"
      # 自定义具体描述
      description: "{{ $labels.instance  }} : {{ $labels.job  }} :{{ $labels.mountpoint  }} 这个分区使用大于百
分之80% (当前值:{{ $value }})"
在 prometheus→status→alerts查看

在alertmanager查看

5 启动grafana
之前使用grafana官网的命令时候,已经安装了,所以直接启动就好了
[root@localhost rules]# systemctl start grafana-server.service
[root@localhost rules]# systemctl enable grafana-server.service
Created symlink from /etc/systemd/system/multi-user.target.wants/grafana-server.service to /usr/lib/systemd/system/grafana-server.service.
[root@localhost rules]# systemctl status grafana-server.service
● grafana-server.service - Grafana instance
   Loaded: loaded (/usr/lib/systemd/system/grafana-server.service; enabled; vendor preset: disabled)
   Active: active (running) since Tue 2021-05-11 09:59:52 CST; 17s ago
     Docs: http://docs.grafana.org
 Main PID: 3410 (grafana-server)
   CGroup: /system.slice/grafana-server.service
           └─3410 /usr/sbin/grafana-server --config=/etc/grafana/grafana.ini --pidfile=/var/run/grafana/grafana-se...
[root@localhost rules]#
5.1 访问本机3000端口 http://192.168.139.130:3000/login

初始用户名admin 密码 admin

输入新密码
5.2 导入promethues


5.3 导入仪表板

输入仪表板ID

导入后,会进行数据源的选择,这里选择prometheus,然后点击import按钮就成功导入了


6 参考文章列表
https://jingyan.baidu.com/article/9faa7231ae65c2063c28cba9.html
https://blog.csdn.net/xiaoxiangzi520/article/details/114972641
https://blog.csdn.net/anqixiang/article/details/104329276
https://www.cnblogs.com/xuwujing/p/14065740.html
https://www.cnblogs.com/jhxxb/p/10579816.html
https://blog.csdn.net/wc1695040842/article/details/107013862
补充
2021年5月19日添加
在实际工作遇到alertmanager的端口被占用的情况,搜了一下,没有找到类似的情况,一般都是只指定–web.listen-addres 监听地址端口。
在遇到端口被占用的情况,需要修改9093和9094两个端口。
–web.listen-addres=“IP:9093” 监听地址端口。
–cluster.listen-address=“IP:9094” 集群的监听端口地址。
./alertmanager --web.listen-address=192.168.10.10:8093 --cluster.listen-address=192.168.10.10:8094 --config.file=alertmanager.yml
查看两个端口
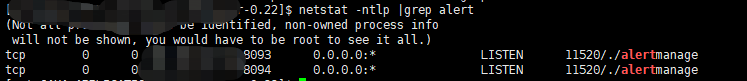
服务已启动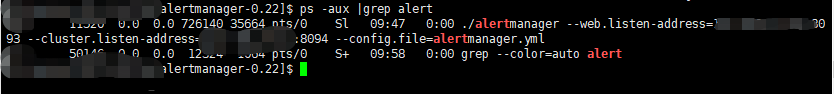


 1504
1504


 被折叠的 条评论
为什么被折叠?
被折叠的 条评论
为什么被折叠?
 到【灌水乐园】发言


