


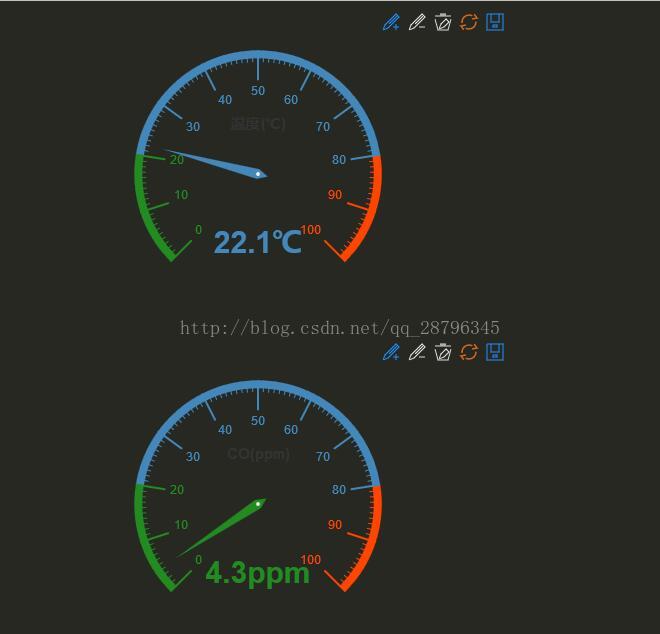
功能:从数据库查询两个数据(温度与一氧化碳浓度),显示到页面,页面嵌入echarts的仪表盘
思路:
1、通过mybatis从数据库获取数据(封装为list)
2、Spring管理mybatis的mapper与struts2的action
3、Struts2的action完成数据的封装(转为Json数组)
4、jsp页面通过ajax获取action的数据
关于mybatis到action的查询数据功能,会在后续的框架搭建中讲述,现在直接进入action到页面的显示块
1、action代码:
package com.bs.view.action;

import java.io.IOException;
import java.io.UnsupportedEncodingException;
import java.util.ArrayList;
import java.util.List;

import javax.servlet.http.HttpServletRequest;
import javax.servlet.http.HttpServletResponse;

import org.apache.struts2.ServletActionContext;

import com.bs.container.ServiceProvider;
import com.bs.po.Data;
import com.bs.service.DataService;
import com.opensymphony.xwork2.ActionSupport;

import net.sf.json.JSONArray;
/*
 *@Author swxctx
 *@time 2017年4月30日
 *@Explain:查询数据库数据,转换为json数据到前台页面显示
 */
public class DataAction extends ActionSupport{

	private static final long serialVersionUID = 1L;

	/*加载applicationContext.xml*/
	private DataService dataService = (DataService)ServiceProvider.getService(DataService.SERVICE_NAME);

	@SuppressWarnings("unchecked")
	public String getData() throws Exception{

		HttpServletRequest request = ServletActionContext.getRequest();
		HttpServletResponse response = ServletActionContext.getResponse();

		try {
			request.setCharacterEncoding("utf-8");
			response.setCharacterEncoding("utf-8");
		} catch (UnsupportedEncodingException e) {
			// TODO Auto-generated catch block
			e.printStackTrace();
		}

		/*获取到数据库返回的data list(调用service层方法)*/
		List<Data> datas = dataService.findLastData();

		//获取temp与co
		@SuppressWarnings("rawtypes")
		List tempList = new ArrayList();//温度
		@SuppressWarnings("rawtypes")
		List coList = new ArrayList();//二氧化碳

		for(Data data:datas){
			//将获取到的数据分别放到各自的数组中
			tempList.add(data.getTemp());
			coList.add(data.getCo());
		}

		//将数据放入到同一个list
		@SuppressWarnings("rawtypes")
		List<List> lists = new ArrayList();
		/*先放入temp*/
		lists.add(tempList);
		/*co*/
		lists.add(coList);

		/*转换为json数组*/
		JSONArray jsonArray = JSONArray.fromObject(lists);

		try {
			response.setHeader("Cache-Control", "no-cache");
			response.setContentType("aplication/json;charset=UTF-8");
			response.getWriter().print(jsonArray);//发送到页面
		} catch (IOException e) {
			e.printStackTrace();
		}

		return null;
	}
}
2、jsp页面
<%@ page language="java" import="java.util.*" contentType="text/html; charset=UTF-8"
    pageEncoding="UTF-8"%>
<!DOCTYPE html PUBLIC "-//W3C//DTD HTML 4.01 Transitional//EN" "http://www.w3.org/TR/html4/loose.dtd">
<html>
<head>
<meta http-equiv="Content-Type" content="text/html; charset=UTF-8">

 <!-- ECharts单文件引入 -->
  <script src="js/dist/echarts.js"></script>
  <!-- jquery引入 -->
  <script src="js/jquery.js"></script>

<title>Insert title here</title>
</head>
<body>

	<!-- 为ECharts准备一个具备大小(宽高)的Dom -->
    <div id="temp" style="height:330px;width:500px"></div>
    <div id="co" style="height:330px;width:500px"></div>

</body>


<script type="text/javascript">
	var tempArray = new Array();
	var coArray = new Array();
	$.ajax({
		url : 'getData.action',
		type : 'GET',
		dataType : 'json',
		async : false,
		success : function(jsonArray) {
			for (x in jsonArray[0]) {
				tempArray[x] = jsonArray[0][x];//将action发送来的数据放入数组
			}
			for (x in jsonArray[0]) {
				coArray[x] = jsonArray[1][x];
			}
		}
	});


	// 路径配置
	require.config({
	    paths: {
	        echarts: 'js/dist'
	    }
	});

     // 使用
     require(
         [
             'echarts',
             'echarts/chart/gauge' // 浅色仪表盘
         ],
         SetEcharts
       );

     function SetEcharts(ec){
  	   TempGauge(ec);//调用显示
  	   CoGauge(ec);
     }

    /*温度值监测图表*/
   function TempGauge(ec) {
     // 基于准备好的dom,初始化echarts图表
     var TempChart = ec.init(document.getElementById('temp'));

     var option = {
	    tooltip : {
	        formatter: "{a} <br/>{b} : {c}℃"
	    },
	    toolbox: {
	        show : true,
	        feature : {
	            mark : {show: true},
	            restore : {show: true},
	            saveAsImage : {show: true}
	        }
	    },
	    series : [
	        {
	            name:'当前温度值',
	            type:'gauge',
	            splitNumber: 10,       // 分割段数,默认为5
	            axisLine: {            // 坐标轴线
	                lineStyle: {       // 属性lineStyle控制线条样式
	                    color: [[0.2, '#228b22'],[0.8, '#48b'],[1, '#ff4500']],
	                    width: 8
	                }
	            },
	            axisTick: {            // 坐标轴小标记
	                splitNumber: 10,   // 每份split细分多少段
	                length :12,        // 属性length控制线长
	                lineStyle: {       // 属性lineStyle控制线条样式
	                    color: 'auto'
	                }
	            },
	            axisLabel: {           // 坐标轴文本标签,详见axis.axisLabel
	                textStyle: {       // 其余属性默认使用全局文本样式,详见TEXTSTYLE
	                    color: 'auto'
	                }
	            },
	            splitLine: {           // 分隔线
	                show: true,        // 默认显示,属性show控制显示与否
	                length :30,         // 属性length控制线长
	                lineStyle: {       // 属性lineStyle(详见lineStyle)控制线条样式
	                    color: 'auto'
	                }
	            },
	            pointer : {
	                width : 5
	            },
	            title : {
	                show : true,
	                offsetCenter: [0, '-40%'],       // x, y,单位px
	                textStyle: {       // 其余属性默认使用全局文本样式,详见TEXTSTYLE
	                    fontWeight: 'bolder'
	                }
	            },
	            detail : {
	                formatter:'{value}℃',
	                textStyle: {       // 其余属性默认使用全局文本样式,详见TEXTSTYLE
	                    color: 'auto',
	                    fontWeight: 'bolder'
	                }
	            },
	            data:[{value: tempArray, name: '温度(℃)'}]//放置temp数据
	        }
	    ]
	};

	  TempChart.setOption(option);
 }
    /*二氧化碳数值图表*/
    function CoGauge(ec) {
     // 基于准备好的dom,初始化echarts图表
     var CoChart = ec.init(document.getElementById('co'));

     var option = {
	    tooltip : {
	        formatter: "{a} <br/>{b} : {c}ppm"
	    },
	    toolbox: {
	        show : true,
	        feature : {
	            mark : {show: true},
	            restore : {show: true},
	            saveAsImage : {show: true}
	        }
	    },
	    series : [
	        {
	            name:'当前CO浓度值',
	            type:'gauge',
	            splitNumber: 10,       // 分割段数,默认为5
	            axisLine: {            // 坐标轴线
	                lineStyle: {       // 属性lineStyle控制线条样式
	                    color: [[0.2, '#228b22'],[0.8, '#48b'],[1, '#ff4500']],
	                    width: 8
	                }
	            },
	            axisTick: {            // 坐标轴小标记
	                splitNumber: 10,   // 每份split细分多少段
	                length :12,        // 属性length控制线长
	                lineStyle: {       // 属性lineStyle控制线条样式
	                    color: 'auto'
	                }
	            },
	            axisLabel: {           // 坐标轴文本标签,详见axis.axisLabel
	                textStyle: {       // 其余属性默认使用全局文本样式,详见TEXTSTYLE
	                    color: 'auto'
	                }
	            },
	            splitLine: {           // 分隔线
	                show: true,        // 默认显示,属性show控制显示与否
	                length :30,         // 属性length控制线长
	                lineStyle: {       // 属性lineStyle(详见lineStyle)控制线条样式
	                    color: 'auto'
	                }
	            },
	            pointer : {
	                width : 5
	            },
	            title : {
	                show : true,
	                offsetCenter: [0, '-40%'],       // x, y,单位px
	                textStyle: {       // 其余属性默认使用全局文本样式,详见TEXTSTYLE
	                    fontWeight: 'bolder'
	                }
	            },
	            detail : {
	                formatter:'{value}ppm',
	                textStyle: {       // 其余属性默认使用全局文本样式,详见TEXTSTYLE
	                    color: 'auto',
	                    fontWeight: 'bolder'
	                }
	            },
	            data:[{value: coArray, name: 'CO(ppm)'}]//方式co数据
	        }
	   	  ]
		};

  		  CoChart.setOption(option);
	}
 </script>


</body>
</html>
3、Struts.xml的配置
<!-- 数据监控 -->
         <action name="getData" class="getDataAction" method="getData"></action>
4、application,xml处的配置
<!-- 数据监控 -->
	<bean id="getDataAction" class="com.bs.view.action.DataAction" scope="prototype"></bean>
效果图如下所示:
注:
关于实时刷新克采用java script计时回调方法
关于echarts的引入见此文:点击打开链接
echarts可到百度官网下载:点击打开链接
使用Json所需要的jar包:


 6135
6135


 被折叠的 条评论
为什么被折叠?
被折叠的 条评论
为什么被折叠?
 到【灌水乐园】发言


