


1 背景
公司本来用的是普通的基于CPU和内存的HPA扩容策略,但是运维发现效果并不是太好,所以开发这边花点时间去研究一下自定义HPA,希望达到的目的大概是这样:比如一个service下当前只有一个pod,这个pod能抗的并发是100,那么假如当前的并发变成了300,那么此时HPA就应该要能监测到这个变化,将pod扩容为3个。
2 理论基础
1 普罗米修斯

第一种 Metrics,是宿主机的监控数据。这部分数据的提供,需要借助一个由 Prometheus 维护的Node Exporter 工具。一般来说,Node Exporter 会以 DaemonSet 的方式运行在宿主机上。其实,所谓的 Exporter,就是代替被监控对象来对 Prometheus 暴露出可以被“抓取”的 Metrics 信息的一个辅助进程。
第二种 Metrics,是来自于 Kubernetes 的 API Server、kubelet 等组件的 /metrics API。除了常规的 CPU、内存的信息外,这部分信息还主要包括了各个组件的核心监控指标。比如,对于 API Server 来说,它就会在 /metrics API 里,暴露出各个 Controller 的工作队列(Work Queue)的长度、请求的 QPS 和延迟数据等等。这些信息,是检查 Kubernetes 本身工作情况的主要依据。
第三种 Metrics,是 Kubernetes 相关的监控数据。这部分数据,一般叫作 Kubernetes 核心监控数据(core metrics)。这其中包括了 Pod、Node、容器、Service 等主要 Kubernetes 核心概念的 Metrics。
其实我们要做的事情,就是让我们的Pod暴露一个接口,然后用普罗米修斯等服务去将这个接口中的指标拿到,拿到以后再汇总。此时我们的HPA去拿到这个汇总的数据然后做对比,根据对比的结果来做扩缩容。
2 流程图示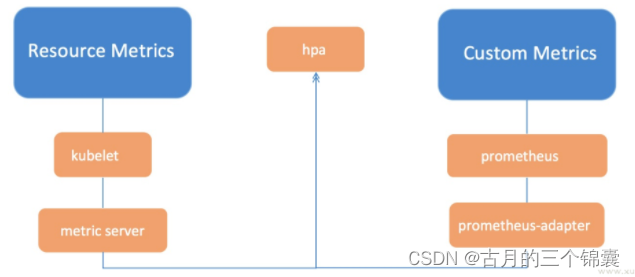
这张图网上随便找的,但是含义基本上就是这样,根据下面的部署流程去部署一遍后,你才会知道其中的含义。
3 部署
1 部署 Prometheus
1、将如下代码保存到prometheus-oprator.yaml文件中,然后apply一下。
apiVersion: rbac.authorization.k8s.io/v1
kind: ClusterRole
metadata:
  name: prometheus-operator
rules:
- apiGroups:
  - extensions
  resources:
  - thirdpartyresources
  verbs:
  - create
- apiGroups:
  - apiextensions.k8s.io
  resources:
  - customresourcedefinitions
  verbs:
  - "*"
- apiGroups:
  - monitoring.coreos.com
  resources:
  - alertmanagers
  - prometheuses
  - servicemonitors
  verbs:
  - "*"
- apiGroups:
  - apps
  resources:
  - statefulsets
  verbs: ["*"]
- apiGroups: [""]
  resources:
  - configmaps
  - secrets
  verbs: ["*"]
- apiGroups: [""]
  resources:
  - pods
  verbs: ["list", "delete"]
- apiGroups: [""]
  resources:
  - services
  - endpoints
  verbs: ["get", "create", "update"]
- apiGroups: [""]
  resources:
  - nodes
  verbs: ["list", "watch"]
- apiGroups: [""]
  resources:
  - namespaces
  verbs: ["list"]
---
apiVersion: v1
kind: ServiceAccount
metadata:
  name: prometheus-operator
---
apiVersion: rbac.authorization.k8s.io/v1
kind: ClusterRoleBinding
metadata:
  name: prometheus-operator
roleRef:
  apiGroup: rbac.authorization.k8s.io
  kind: ClusterRole
  name: prometheus-operator
subjects:
- kind: ServiceAccount
  name: prometheus-operator
  namespace: default
---
apiVersion: apps/v1
kind: Deployment
metadata:
  name: prometheus-operator
  labels:
    operator: prometheus
spec:
  replicas: 1
  selector:
    matchLabels:
      operator: prometheus
  template:
    metadata:
      labels:
        operator: prometheus
    spec:
      serviceAccountName: prometheus-operator
      containers:
       - name: prometheus-operator
         image: luxas/prometheus-operator:v0.17.0
         resources:
           requests:
             cpu: 100m
             memory: 50Mi
           limits:
             cpu: 200m
             memory: 100Mi
2、将如下代码保存到sample-prometheus-instance.yaml文件中,然后apply一下。特别需要注意的是,sample-prometheus-instance.yaml这个文件里面在启动普罗米修斯的时候需要创建PVC,所以我本地环境用的是test-promethous-sc这个storageclass,请根据实际情况修改哈。不然这个服务启动不了的。
apiVersion: rbac.authorization.k8s.io/v1
kind: ClusterRole
metadata:
  name: prometheus
rules:
- apiGroups:
  - ""
  resources:
  - nodes
  - services
  - endpoints
  - pods
  verbs:
  - get
  - list
  - watch
---
apiVersion: v1
kind: ServiceAccount
metadata:
  name: prometheus
---
apiVersion: rbac.authorization.k8s.io/v1
kind: ClusterRoleBinding
metadata:
  name: prometheus
roleRef:
  apiGroup: rbac.authorization.k8s.io
  kind: ClusterRole
  name: prometheus
subjects:
- kind: ServiceAccount
  name: prometheus
  namespace: default
---
apiVersion: monitoring.coreos.com/v1
kind: Prometheus
metadata:
  name: sample-metrics-prom
  labels:
    app: sample-metrics-prom
    prometheus: sample-metrics-prom
spec:
  replicas: 1
  baseImage: luxas/prometheus
  version: v2.2.1
  serviceAccountName: prometheus
  serviceMonitorSelector:
    matchLabels:
      service-monitor: sample-metrics-app
  resources:
    requests:
      memory: 300Mi
  retention: 7d
  storage:
    class: "test-promethous-sc"
    selector: {}
    resources: {}
    volumeClaimTemplate:
      spec:
        storageClassName: "test-promethous-sc"
        resources:
          requests:
            storage: 1Gi
---
apiVersion: v1
kind: Service
metadata:
  name: sample-metrics-prom
  labels:
    app: sample-metrics-prom
    prometheus: sample-metrics-prom
spec:
  type: NodePort
  ports:
  - name: web
    nodePort: 30999
    port: 9090
    targetPort: web
  selector:
    prometheus: sample-metrics-prom
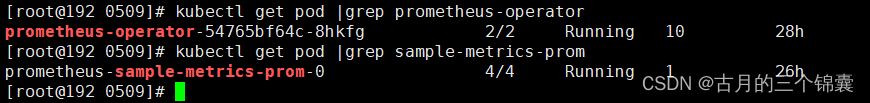
这两步都执行完以后,来验证一下服务是否启动正常。注意,我这里都是部署到了default命名空间,可以查看:(当然,我这里只是查看了pod资源,其他资源肯定也是有的)
kubectl get pod |grep prometheus-operator
kubectl get pod |grep sample-metrics-prom
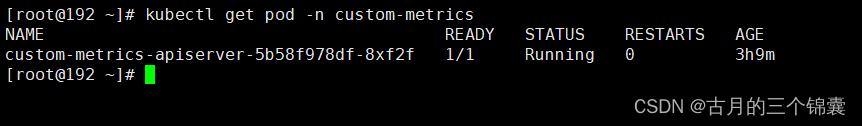
2 部署Custom Metrics APIServer
1、将如下代码保存到custom-metrics.yaml文件中,然后apply一下。
kind: Namespace
apiVersion: v1
metadata:
name: custom-metrics
---
kind: ServiceAccount
apiVersion: v1
metadata:
name: custom-metrics-apiserver
namespace: custom-metrics
---
apiVersion: rbac.authorization.k8s.io/v1
kind: ClusterRoleBinding
metadata:
name: custom-metrics:system:auth-delegator
roleRef:
apiGroup: rbac.authorization.k8s.io
kind: ClusterRole
name: system:auth-delegator
subjects:
- kind: ServiceAccount
name: custom-metrics-apiserver
namespace: custom-metrics
---
apiVersion: rbac.authorization.k8s.io/v1
kind: RoleBinding
metadata:
name: custom-metrics-auth-reader
namespace: kube-system
roleRef:
apiGroup: rbac.authorization.k8s.io
kind: Role
name: extension-apiserver-authentication-reader
subjects:
- kind: ServiceAccount
name: custom-metrics-apiserver
namespace: custom-metrics
---
apiVersion: rbac.authorization.k8s.io/v1
kind: ClusterRole
metadata:
name: custom-metrics-resource-reader
rules:
- apiGroups:
- ""
resources:
- namespaces
- pods
- services
verbs:
- get
- list
---
apiVersion: rbac.authorization.k8s.io/v1
kind: ClusterRoleBinding
metadata:
name: custom-metrics-apiserver-resource-reader
roleRef:
apiGroup: rbac.authorization.k8s.io
kind: ClusterRole
name: custom-metrics-resource-reader
subjects:
- kind: ServiceAccount
name: custom-metrics-apiserver
namespace: custom-metrics
---
apiVersion: rbac.authorization.k8s.io/v1
kind: ClusterRole
metadata:
name: custom-metrics-getter
rules:
- apiGroups:
- custom.metrics.k8s.io
resources:
- "*"
verbs:
- "*"
---
apiVersion: rbac.authorization.k8s.io/v1
kind: ClusterRoleBinding
metadata:
name: hpa-custom-metrics-getter
roleRef:
apiGroup: rbac.authorization.k8s.io
kind: ClusterRole
name: custom-metrics-getter
subjects:
- kind: ServiceAccount
name: horizontal-pod-autoscaler
namespace: kube-system
---
apiVersion: apps/v1
kind: Deployment
metadata:
name: custom-metrics-apiserver
namespace: custom-metrics
labels:
app: custom-metrics-apiserver
spec:
replicas: 1
selector:
matchLabels:
app: custom-metrics-apiserver
template:
metadata:
labels:
app: custom-metrics-apiserver
spec:
tolerations:
- key: beta.kubernetes.io/arch
value: arm
effect: NoSchedule
- key: beta.kubernetes.io/arch
value: arm64
effect: NoSchedule
serviceAccountName: custom-metrics-apiserver
containers:
- name: custom-metrics-server
image: luxas/k8s-prometheus-adapter:v0.2.0-beta.0
args:
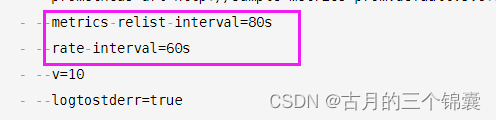
- --prometheus-url=http://sample-metrics-prom.default.svc:9090
- --metrics-relist-interval=80s
- --rate-interval=60s
- --v=10
- --logtostderr=true
ports:
- containerPort: 443
securityContext:
runAsUser: 0
---
apiVersion: v1
kind: Service
metadata:
name: api
namespace: custom-metrics
spec:
ports:
- port: 443
targetPort: 443
selector:
app: custom-metrics-apiserver
---
apiVersion: apiregistration.k8s.io/v1
kind: APIService
metadata:
name: v1beta1.custom.metrics.k8s.io
spec:
insecureSkipTLSVerify: true
group: custom.metrics.k8s.io
groupPriorityMinimum: 1000
versionPriority: 5
service:
name: api
namespace: custom-metrics
version: v1beta1
---
apiVersion: rbac.authorization.k8s.io/v1
kind: ClusterRole
metadata:
name: custom-metrics-server-resources
rules:
- apiGroups:
- custom-metrics.metrics.k8s.io
resources: ["*"]
verbs: ["*"]
---
apiVersion: rbac.authorization.k8s.io/v1
kind: ClusterRoleBinding
metadata:
name: hpa-controller-custom-metrics
roleRef:
apiGroup: rbac.authorization.k8s.io
kind: ClusterRole
name: custom-metrics-server-resources
subjects:
- kind: ServiceAccount
name: horizontal-pod-autoscaler
namespace: kube-system
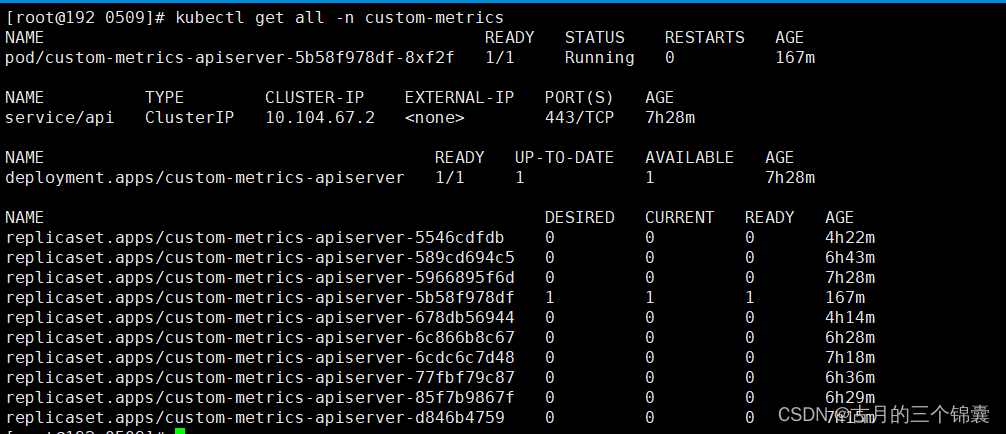
这个执行完以后,我这边的结果是这个:
kubectl get all -n custom-metrics
其实这个服务的本质就是k8s-prometheus-adapter,从镜像即可以看出来。而且这里配置了地址
prometheus-url=http://sample-metrics-prom.default.svc:9090 表示访问普罗米修斯的地址。当然,按照这个教程的话,都不需要修改!
注意:这两个时间特别是下面rate-interval的时间,必须能转换为完整的分钟,比如60正好可以换成1分钟。因为adapter会去查普罗米修斯,经过我的测试,这个版本下,如配置为30s这种,查出来的结果会一直为空,这就会导致你在请求的时候发现自定义指标一直看不到。 另一个就是上面这个时间,先配置为80s吧, 因为我刚开始部署的时候,一直刷不出来数据,后来改大以后数据就有了,原因未知。
3 添加权限
执行如下命令即可。
kubectl create clusterrolebinding allowall-cm --clusterrole custom-metrics-server-resources --user system:anonymous
4 部署测试应用
将如下文件保存到sample-metrics-app.yaml文件中,然后apply一下
apiVersion: apps/v1
kind: Deployment
metadata:
  labels:
    app: sample-metrics-app
  name: sample-metrics-app
spec:
  replicas: 2
  selector:
    matchLabels:
      app: sample-metrics-app
  template:
    metadata:
      labels:
        app: sample-metrics-app
    spec:
      tolerations:
      - key: beta.kubernetes.io/arch
        value: arm
        effect: NoSchedule
      - key: beta.kubernetes.io/arch
        value: arm64
        effect: NoSchedule
      - key: node.alpha.kubernetes.io/unreachable
        operator: Exists
        effect: NoExecute
        tolerationSeconds: 0
      - key: node.alpha.kubernetes.io/notReady
        operator: Exists
        effect: NoExecute
        tolerationSeconds: 0
      containers:
      - image: luxas/autoscale-demo:v0.1.2
        name: sample-metrics-app
        ports:
        - name: web
          containerPort: 8080
        readinessProbe:
          httpGet:
            path: /
            port: 8080
          initialDelaySeconds: 3
          periodSeconds: 5
        livenessProbe:
          httpGet:
            path: /
            port: 8080
          initialDelaySeconds: 3
          periodSeconds: 5
---
apiVersion: v1
kind: Service
metadata:
  name: sample-metrics-app
  labels:
    app: sample-metrics-app
spec:
  ports:
  - name: web
    port: 80
    targetPort: 8080
  selector:
    app: sample-metrics-app
---
apiVersion: monitoring.coreos.com/v1
kind: ServiceMonitor
metadata:
  name: sample-metrics-app
  labels:
    service-monitor: sample-metrics-app
spec:
  selector:
    matchLabels:
      app: sample-metrics-app
  endpoints:
  - port: web
---
kind: HorizontalPodAutoscaler
apiVersion: autoscaling/v2beta2
metadata:
  name: sample-metrics-app-hpa
spec:
  scaleTargetRef:
    apiVersion: apps/v1
    kind: Deployment
    name: sample-metrics-app
  minReplicas: 2
  maxReplicas: 10
#  metrics:
#  - type: Object
#    object:
#      target:
#        kind: Service
#        name: sample-metrics-app
#      metricName: http_requests
#      targetValue: 200000000m

  metrics:
  - type: Pods
    pods:
      metric:
        name: http_requests
      target:
        type: AverageValue
        averageValue: 200

---
apiVersion: extensions/v1beta1
kind: Ingress
metadata:
  name: sample-metrics-app
  namespace: default
  annotations:
    traefik.frontend.rule.type: PathPrefixStrip
spec:
  rules:
  - http:
      paths:
      - path: /sample-app
        backend:
          serviceName: sample-metrics-app
          servicePort: 80
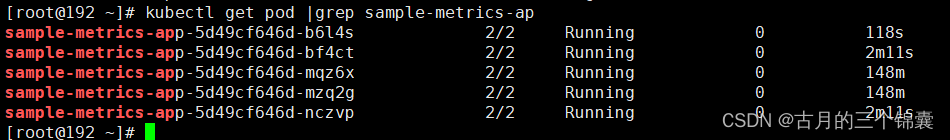
上面的配置已经是我修改过的,没有什么问题的话不要乱动哈。这个部署完了以后,理论上你就能看到这个pod了。kubectl get pod |grep sample-metrics-ap

4 验证
1 验证部署是否正常
这个时候一定不要急,先来验证一下,否则后续你就晕了。
首先找到kubectl get svc -n custom-metrics,这个svc的ip地址,然后手动访问一下。
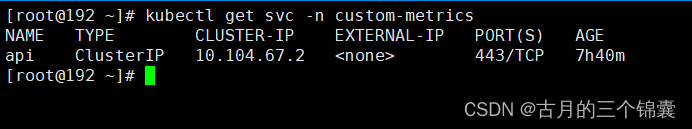
我这边是这个ip:(注意:一定要保证能拿到如下图所示的数据格式,因为HPA能扩容,本质上就是去请求这个地址拿你自定义的指标值的。所以如果为空,一定要去查日志排查问题!!!原因有很多,要具体分析)
curl -sSLk https://10.104.67.2/apis/custom.metrics.k8s.io/v1beta1
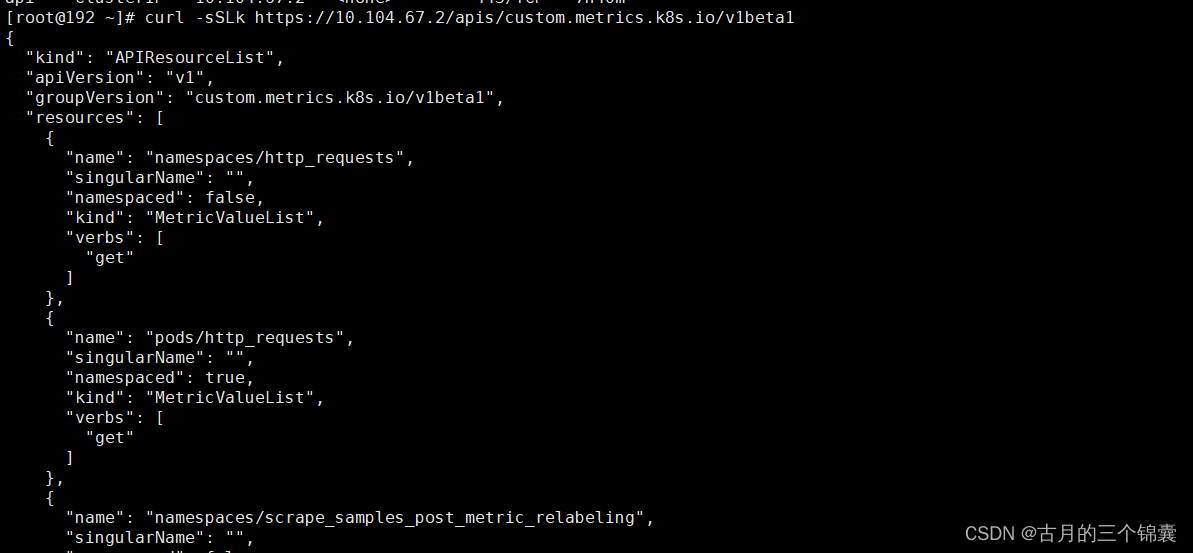
如果这里有数据,说明服务已经通了,即已经可以通过adpter去普罗米修斯拿到数据了。
接着你访问一下这个地址(这个表示的是sample-metrics-app这个svc中的http_requests指标):
curl -sSLk https://10.104.67.2/apis/custom.metrics.k8s.io/v1beta1/namespaces/default/services/sample-metrics-app/http_requests
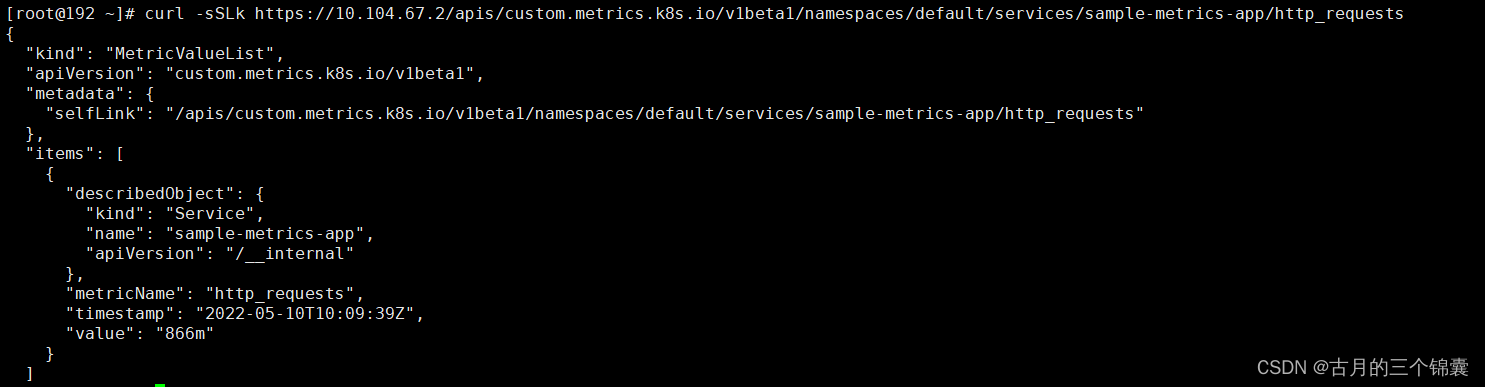
你可能难以理解为什么就有自定义指标了,这是因为我们上面的示例pod中,写了一个/metrics的接口,这个接口会返回一个http_requests_total的数据来统计当前pod收到的所有请求数! 所以当你查询http_requests指标的时候,服务做了转换。具体后面会讲到。
如果service也能拿到数据,那么可以说马上就要成功了。
2 检查HPA
此时你查看HPA,kubectl get hpa ,会发现有下面这个一个

还记得上面在部署这个HPA的时候吗?看看配置文件:
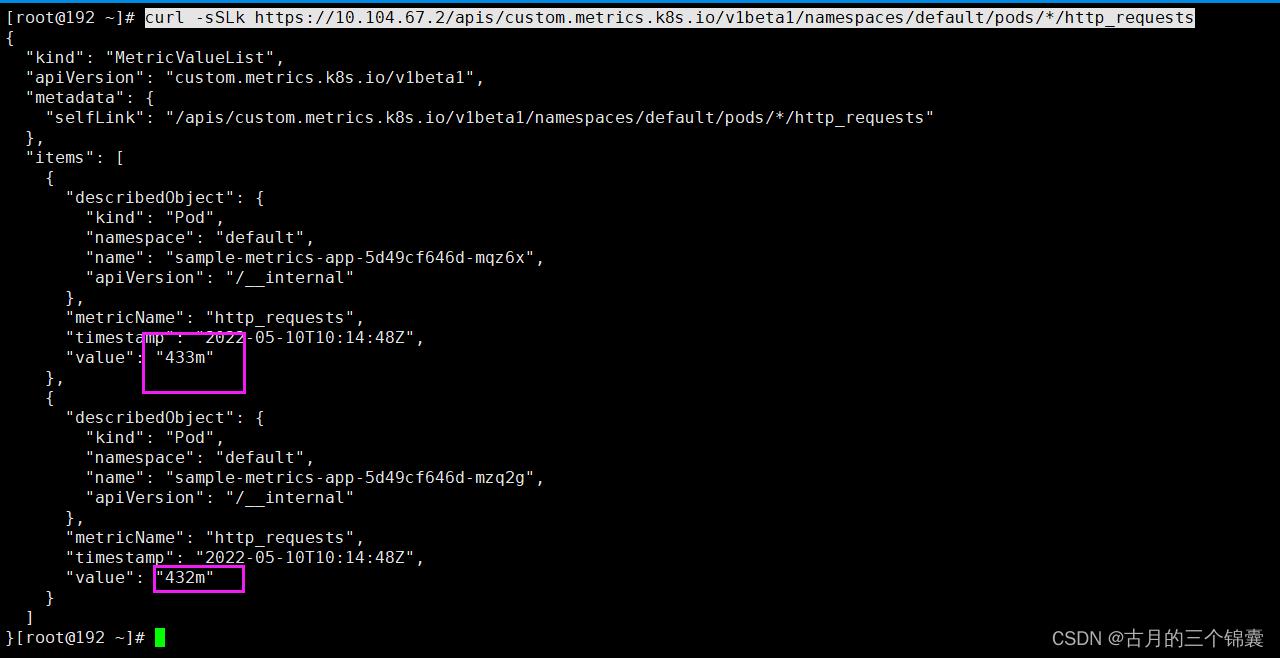
这里指定了说要去拿pod的http_requests指标。

所以你访问
curl -sSLk https://10.104.67.2/apis/custom.metrics.k8s.io/v1beta1/namespaces/default/pods/*/http_requests
这个能拿到指标,自然HPA也能通过这个方式拿到指标了。
这个指标是怎么来的?其实你可以去查看下面这个pod的日志。
里面会有去请求普罗米修斯的接口(如果你遇到什么问题,也一定要来这里查,如果为空,那么你上面的验证肯定是不通过的!)

说明:
前面的 Custom Metircs URL 进行访问时,会看到值是 501484m(类似),这里的格式,其实就是 milli-requests,相当于是在过去两分钟内,每秒有 501 个请求
5 压测
校验的时候到了,先看下这个HPA的含义:

443m其实就是0.443/s,表示现在这个平均每个pod的请求量。而当每个pod的请求量达到200的时候才扩容。
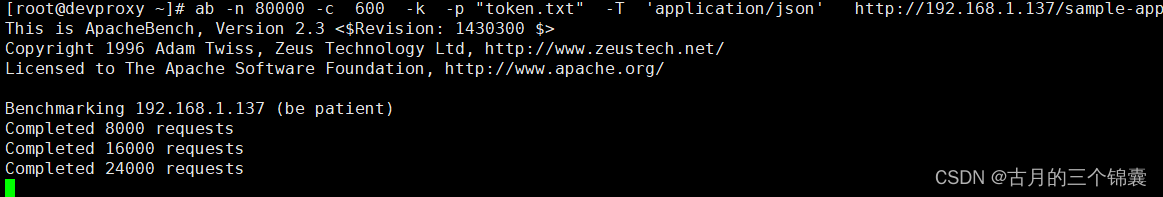
通过下面这个命令压测我们的测试APP:(ab如果没有的话安装下吧,或者jmeter也行),这里表示的是600个并发,发80000个请求,
ab -n 80000 -c 600 -k -p “token.txt” -T ‘application/json’ http://192.168.1.137/sample-app
开始发送请求了。接下来看HPA的变化:只看这个HPA的哈:sample-metrics-app-hpa
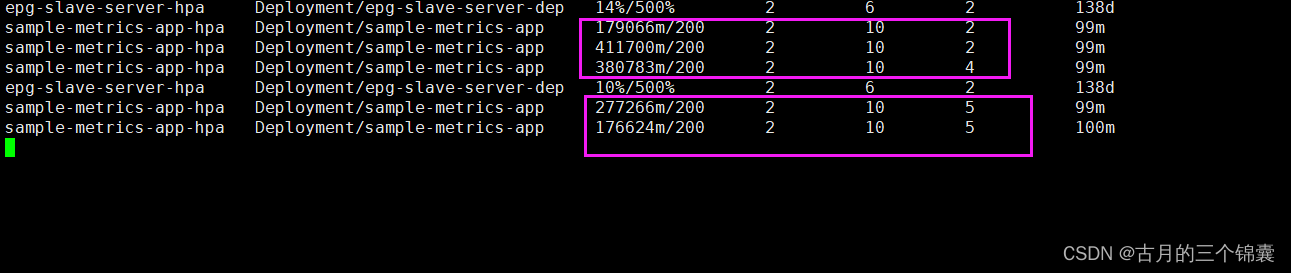
发现没,先是每个POD的请求变成了400多,发现需要扩容了,先从2变为4,然后变为5,pod数量增加的同时,每个pod的请求也下去了。
大概就是这么个意思。


 2450
2450


 被折叠的 条评论
为什么被折叠?
被折叠的 条评论
为什么被折叠?
 到【灌水乐园】发言


