


常用流量监控命令:
- nload
- iptraf-ng
- nethogs
- iftop
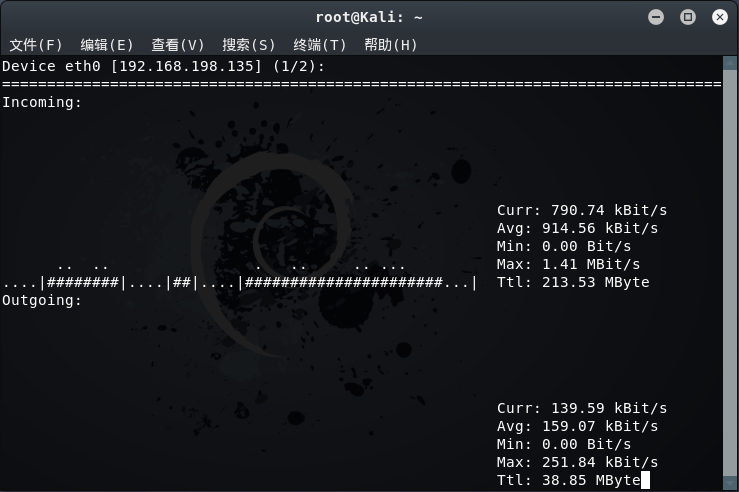
nload(监控网卡进出状态)
#启动监控
root@kali:~# nload
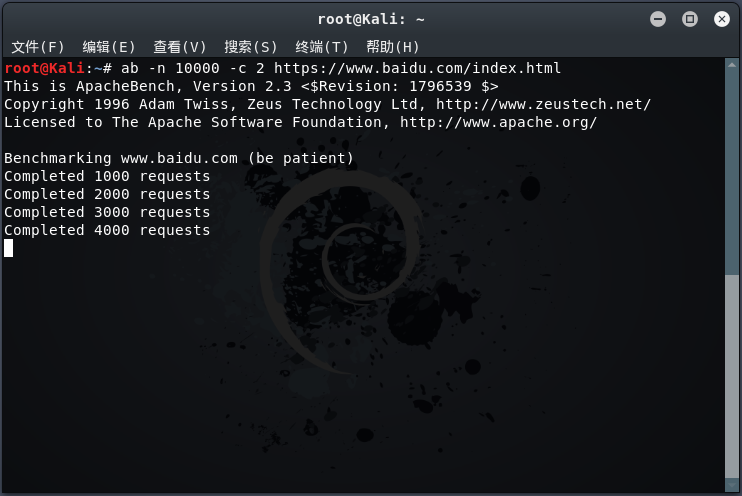
#配合测试
root@kali:~# ab -n 10000 https://www.baidu.com/index.html
root@Kali:~# nload --help

nload version 0.7.4
Copyright (C) 2001 - 2012 by Roland Riegel <feedback@roland-riegel.de>
nload comes with ABSOLUTELY NO WARRANTY. This is free software, and you are
welcome to redistribute it under certain conditions. For more details see the
GNU General Public License Version 2 (http://www.gnu.org/copyleft/gpl.html).

Command line syntax:
nload [options] [devices]
nload --help|-h

Options:
-a period       Sets the length in seconds of the time window for average
                calculation.
                Default is 300.
-i max_scaling  Specifies the 100% mark in kBit/s of the graph indicating the
                incoming bandwidth usage. Ignored if max_scaling is 0 or the
                switch -m is given.
                Default is 10240.
-m              Show multiple devices at a time; no traffic graphs.
-o max_scaling  Same as -i but for the graph indicating the outgoing bandwidth
                usage.
                Default is 10240.
-t interval     Determines the refresh interval of the display in milliseconds.
                Default is 500.
-u h|b|k|m|g    Sets the type of unit used for the display of traffic numbers.
   H|B|K|M|G    h: auto, b: Bit/s, k: kBit/s, m: MBit/s etc.
                H: auto, B: Byte/s, K: kByte/s, M: MByte/s etc.
                Default is h.
-U h|b|k|m|g    Same as -u, but for a total amount of data (without "/s").
   H|B|K|M|G    Default is H.
devices         Network devices to use.
                Default is to use all auto-detected devices.
--help
-h              Print this help.

example: nload -t 200 -i 1024 -o 128 -U M
root@Kali:~# ab --help
ab: wrong number of arguments
Usage: ab [options] [http[s]://]hostname[:port]/path
Options are:
    -n requests     Number of requests to perform
    -c concurrency  Number of multiple requests to make at a time
    -t timelimit    Seconds to max. to spend on benchmarking
                    This implies -n 50000
    -s timeout      Seconds to max. wait for each response
                    Default is 30 seconds
    -b windowsize   Size of TCP send/receive buffer, in bytes
    -B address      Address to bind to when making outgoing connections
    -p postfile     File containing data to POST. Remember also to set -T
    -u putfile      File containing data to PUT. Remember also to set -T
    -T content-type Content-type header to use for POST/PUT data, eg.
                    'application/x-www-form-urlencoded'
                    Default is 'text/plain'
    -v verbosity    How much troubleshooting info to print
    -w              Print out results in HTML tables
    -i              Use HEAD instead of GET
    -x attributes   String to insert as table attributes
    -y attributes   String to insert as tr attributes
    -z attributes   String to insert as td or th attributes
    -C attribute    Add cookie, eg. 'Apache=1234'. (repeatable)
    -H attribute    Add Arbitrary header line, eg. 'Accept-Encoding: gzip'
                    Inserted after all normal header lines. (repeatable)
    -A attribute    Add Basic WWW Authentication, the attributes
                    are a colon separated username and password.
    -P attribute    Add Basic Proxy Authentication, the attributes
                    are a colon separated username and password.
    -X proxy:port   Proxyserver and port number to use
    -V              Print version number and exit
    -k              Use HTTP KeepAlive feature
    -d              Do not show percentiles served table.
    -S              Do not show confidence estimators and warnings.
    -q              Do not show progress when doing more than 150 requests
    -l              Accept variable document length (use this for dynamic pages)
    -g filename     Output collected data to gnuplot format file.
    -e filename     Output CSV file with percentages served
    -r              Don't exit on socket receive errors.
    -m method       Method name
    -h              Display usage information (this message)
    -I              Disable TLS Server Name Indication (SNI) extension
    -Z ciphersuite  Specify SSL/TLS cipher suite (See openssl ciphers)
    -f protocol     Specify SSL/TLS protocol
                    (SSL2, TLS1, TLS1.1, TLS1.2 or ALL)
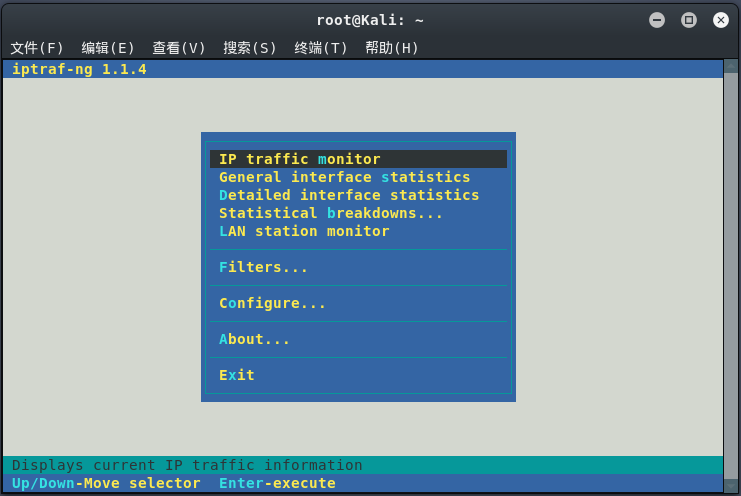
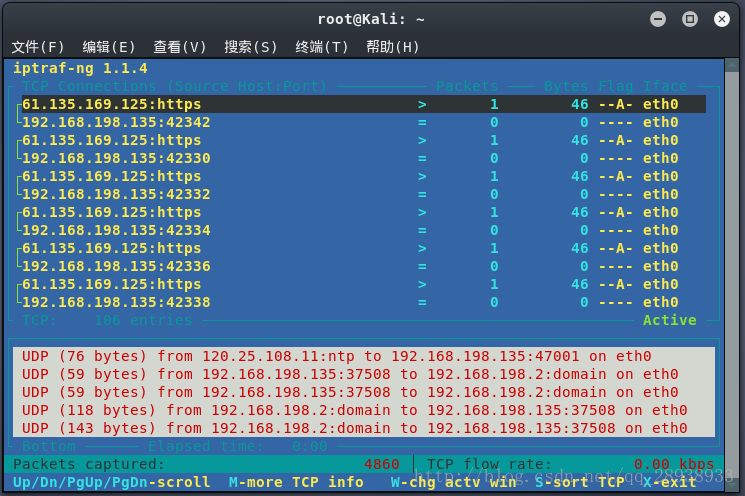
iptraf-ng(图形化工具)
#启动监控程序
root@kali:~# iptraf-ng
#配合测试
root@kali:~# ab -n 10000 https://www.baidu.com/index.html
root@Kali:~# iptraf-ng --help
usage: iptraf-ng [options]
   or: iptraf-ng [options] -B [-i <iface> | -d <iface> | -s <iface> | -z <iface> | -l <iface> | -g]

    -h, --help            show this help message

    -i <iface>            start the IP traffic monitor (use '-i all' for all interfaces)
    -d <iface>            start the detailed statistics facility on an interface
    -s <iface>            start the TCP and UDP monitor on an interface
    -z <iface>            shows the packet size counts on an interface
    -l <iface>            start the LAN station monitor (use '-l all' for all LAN interfaces)
    -g                    start the general interface statistics

    -B                    run in background (use only with one of the above parameters
    -f                    clear all locks and counters
    -t <n>                run only for the specified <n> number of minutes
    -L <logfile>          specifies an alternate log file
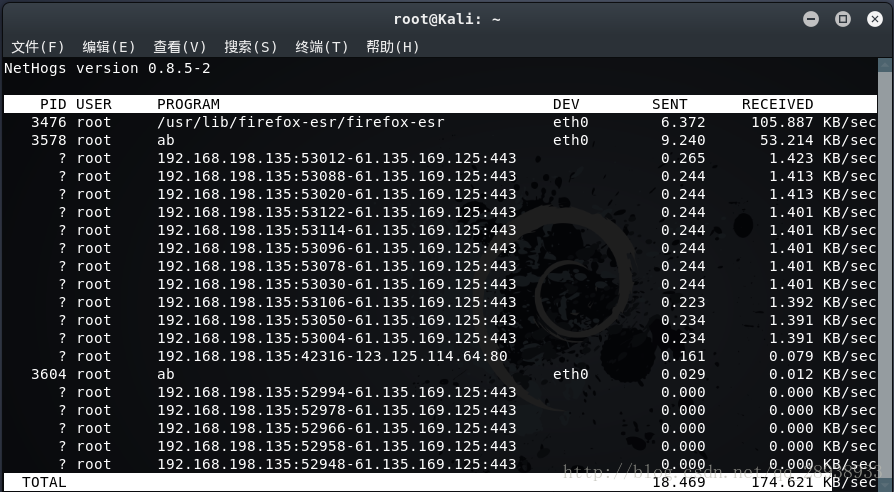
nethogs(监控进程出入)
#启动监控程序
root@kali:~# nethogs
root@Kali:~# nethogs --help
nethogs: invalid option -- '-'
usage: nethogs [-V] [-h] [-b] [-d seconds] [-v mode] [-c count] [-t] [-p] [-s] [device [device [device ...]]]
		-V : prints version.
		-h : prints this help.
		-b : bughunt mode - implies tracemode.
		-d : delay for update refresh rate in seconds. default is 1.
		-v : view mode (0 = KB/s, 1 = total KB, 2 = total B, 3 = total MB). default is 0.
		-c : number of updates. default is 0 (unlimited).
		-t : tracemode.
		-p : sniff in promiscious mode (not recommended).
		-s : sort output by sent column.
   -a : monitor all devices, even loopback/stopped ones.
		device : device(s) to monitor. default is all interfaces up and running excluding loopback

When nethogs is running, press:
 q: quit
 s: sort by SENT traffic
 r: sort by RECEIVE traffic
 m: switch between total (KB, B, MB) and KB/s mode
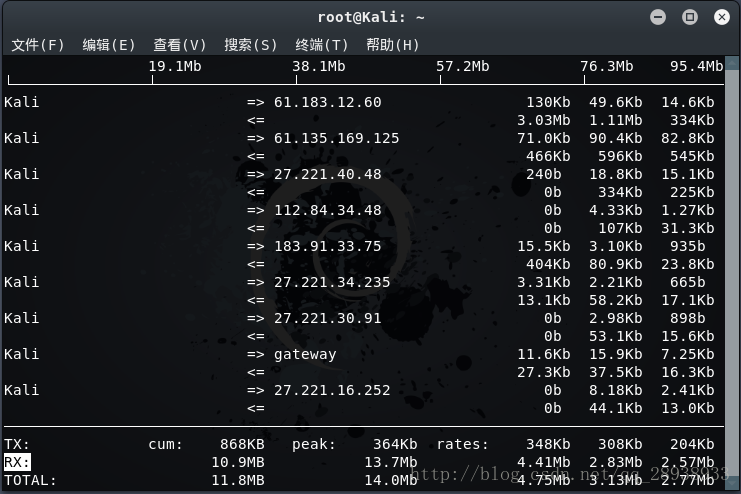
iftop(监控IP出入)
#启动监控程序
root@kali:~# iftop
root@Kali:~# iftop --help
iftop: unknown option --
iftop: display bandwidth usage on an interface by host

Synopsis: iftop -h | [-npblNBP] [-i interface] [-f filter code]
                               [-F net/mask] [-G net6/mask6]

   -h                  display this message
   -n                  don't do hostname lookups
   -N                  don't convert port numbers to services
   -p                  run in promiscuous mode (show traffic between other
                       hosts on the same network segment)
   -b                  don't display a bar graph of traffic
   -B                  Display bandwidth in bytes
   -i interface        listen on named interface
   -f filter code      use filter code to select packets to count
                       (default: none, but only IP packets are counted)
   -F net/mask         show traffic flows in/out of IPv4 network
   -G net6/mask6       show traffic flows in/out of IPv6 network
   -l                  display and count link-local IPv6 traffic (default: off)
   -P                  show ports as well as hosts
   -m limit            sets the upper limit for the bandwidth scale
   -c config file      specifies an alternative configuration file
   -t                  use text interface without ncurses

   Sorting orders:
   -o 2s                Sort by first column (2s traffic average)
   -o 10s               Sort by second column (10s traffic average) [default]
   -o 40s               Sort by third column (40s traffic average)
   -o source            Sort by source address
   -o destination       Sort by destination address

   The following options are only available in combination with -t
   -s num              print one single text output afer num seconds, then quit
   -L num              number of lines to print


 被折叠的 条评论
为什么被折叠?
被折叠的 条评论
为什么被折叠?
 到【灌水乐园】发言


