


 本文介绍了如何在Linux环境中利用Docker安装并使用Grokdebug,一个用于调试Logstash grok语法的工具。通过这个工具,可以有效提高在墙内调试grok表达式的效率。
如何搭建Logstash中自己的grokdebug工具
1、说明原因
grokdebug 一个方便的 grok 调试工具,grok 的语法编写起来还是有点吃力的,但是使用grokdebug可以提高我们排查问题的效率,但是服务提供大多数是国外的服务器,我们在墙内服务比较困难,目前grokdebug 提供了docker 版本了,在dockerhub上有镜像。
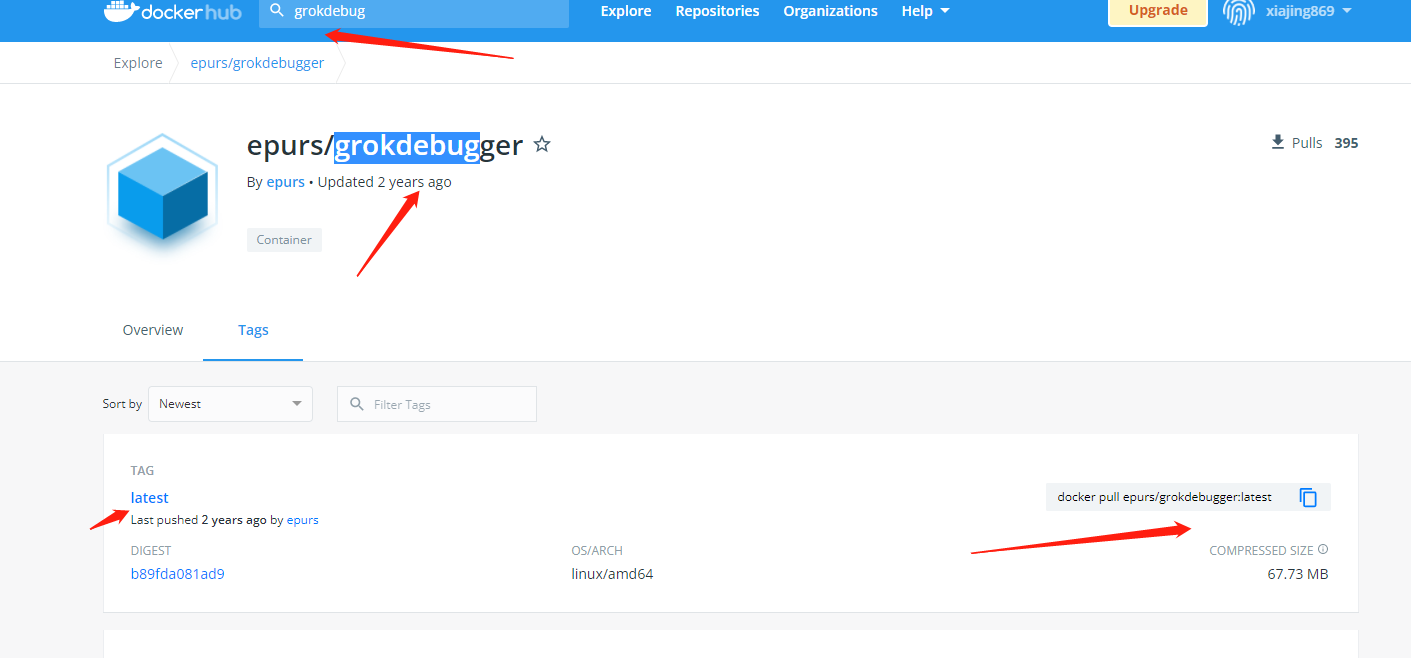
2、安装
root@localhost ~]# docker pull epurs/grokdebugger:latest
latest: Pulling from epurs/grokdebugger
88286f41530e: Pull complete
55c9e9766f9e: Pull complete
e935c9e40c5f: Pull complete
d1a745922c99: Pull complete
0eb620fc0bdf: Pull complete
5298ab6100d8: Pull complete
6af00fe4a291: Pull complete
Digest: sha256:b89fda081ad95c0b7dd58ef7a580889a400b713e8a419fc7a23305a12e93de91
Status: Downloaded newer image for epurs/grokdebugger:latest
docker.io/epurs/grokdebugger:latest
[root@localhost ~]# docker images
REPOSITORY                                              TAG       IMAGE ID       CREATED         SIZE
registry.cn-hangzhou.aliyuncs.com/cheungssh/cheungssh   latest    699cb9a5b61c   15 months ago   2.39GB
epurs/grokdebugger                                      latest    e916adece9a1   23 months ago   158MB
[root@localhost ~]# docker run -d --name grokdebugger -p 80:80  epurs/grokdebugger
3af7e1fc20e9dbb4f942bd5f49883543def98d819f04f87b3d10420662594044
[root@localhost ~]#
3、使用展示
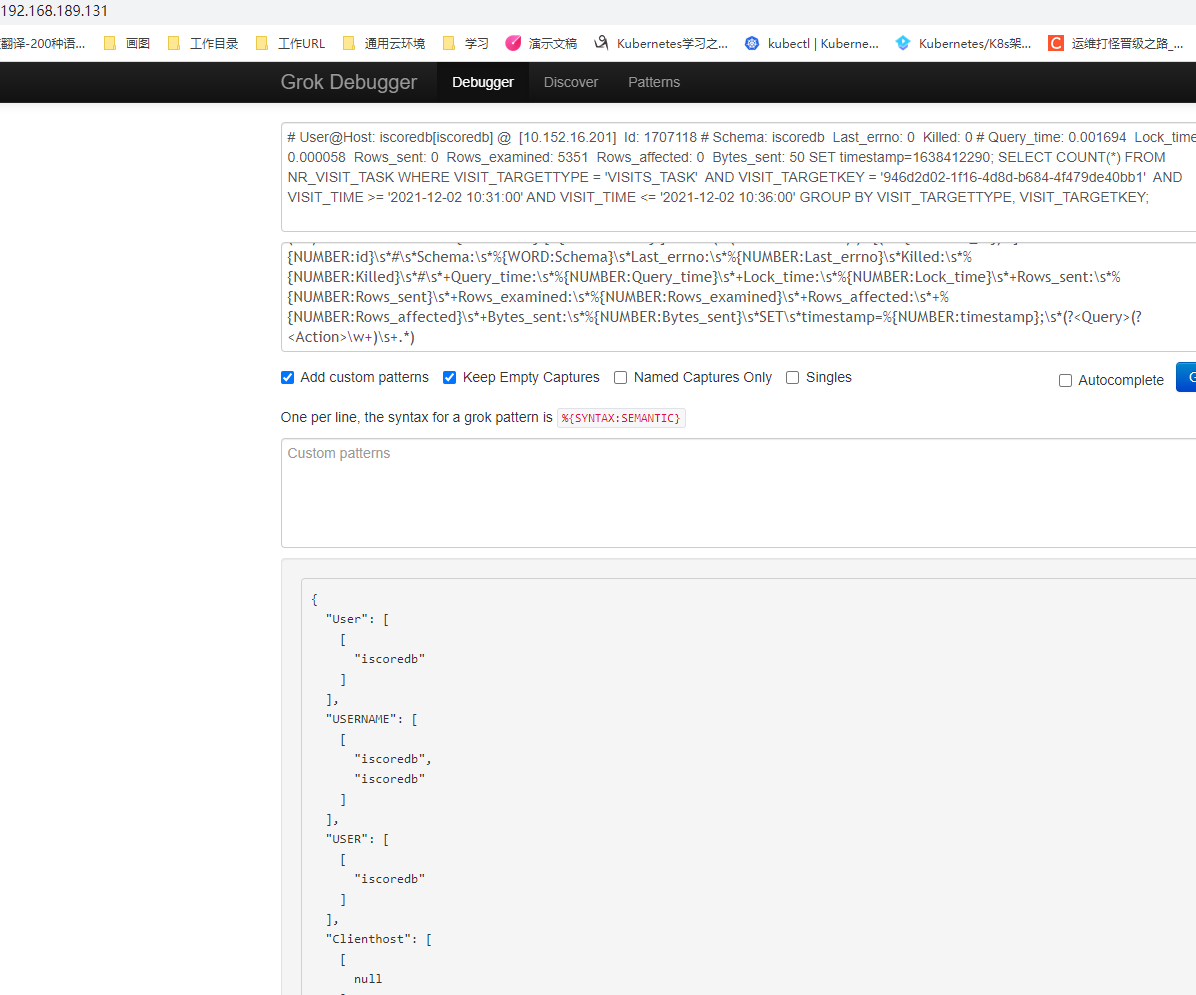
源字符串:
# User@Host: iscoredb[iscoredb] @ [10.152.16.201] Id: 1707118 # Schema: iscoredb Last_errno: 0 Killed: 0 # Query_time: 0.001694 Lock_time: 0.000058 Rows_sent: 0 Rows_examined: 5351 Rows_affected: 0 Bytes_sent: 50 SET timestamp=1638412290; SELECT COUNT(*) FROM NR_VISIT_TASK WHERE VISIT_TARGETTYPE = 'VISITS_TASK' AND VISIT_TARGETKEY = '946d2d02-1f16-4d8d-b684-4f479de40bb1' AND VISIT_TIME >= '2021-12-02 10:31:00' AND VISIT_TIME <= '2021-12-02 10:36:00' GROUP BY VISIT_TARGETTYPE, VISIT_TARGETKEY;
grok拆分语法:
(?m)^#\s*User@Host:\s*%{USER:User}\[%{USER-2:User}\]\s*@\s*(?:(?<Clienthost>\S*) )?\[(?:%{IP:Client_IP})?\]\s*Id:\s*%{NUMBER:id}\s*#\s*Schema:\s*%{WORD:Schema}\s*Last_errno:\s*%{NUMBER:Last_errno}\s*Killed:\s*%{NUMBER:Killed}\s*#\s*+Query_time:\s*%{NUMBER:Query_time}\s*+Lock_time:\s*%{NUMBER:Lock_time}\s*+Rows_sent:\s*%{NUMBER:Rows_sent}\s*+Rows_examined:\s*%{NUMBER:Rows_examined}\s*+Rows_affected:\s*+%{NUMBER:Rows_affected}\s*+Bytes_sent:\s*%{NUMBER:Bytes_sent}\s*SET\s*timestamp=%{NUMBER:timestamp};\s*(?<Query>(?<Action>\w+)\s+.*)
拆分后的效果:
{
  "User": [
    [
      "iscoredb"
    ]
  ],
  "USERNAME": [
    [
      "iscoredb",
      "iscoredb"
    ]
  ],
  "USER": [
    [
      "iscoredb"
    ]
  ],
  "Clienthost": [
    [
      null
    ]
  ],
  "Client_IP": [
    [
      "10.152.16.201"
    ]
  ],
  "IPV6": [
    [
      null
    ]
  ],
  "IPV4": [
    [
      "10.152.16.201"
    ]
  ],
  "id": [
    [
      "1707118"
    ]
  ],
  "BASE10NUM": [
    [
      "1707118",
      "0",
      "0",
      "0.001694",
      "0.000058",
      "0",
      "5351",
      "0",
      "50",
      "1638412290"
    ]
  ],
  "Schema": [
    [
      "iscoredb"
    ]
  ],
  "Last_errno": [
    [
      "0"
    ]
  ],
  "Killed": [
    [
      "0"
    ]
  ],
  "Query_time": [
    [
      "0.001694"
    ]
  ],
  "Lock_time": [
    [
      "0.000058"
    ]
  ],
  "Rows_sent": [
    [
      "0"
    ]
  ],
  "Rows_examined": [
    [
      "5351"
    ]
  ],
  "Rows_affected": [
    [
      "0"
    ]
  ],
  "Bytes_sent": [
    [
      "50"
    ]
  ],
  "timestamp": [
    [
      "1638412290"
    ]
  ],
  "Query": [
    [
      "SELECT COUNT(*) FROM NR_VISIT_TASK WHERE VISIT_TARGETTYPE = 'VISITS_TASK'  AND VISIT_TARGETKEY = '946d2d02-1f16-4d8d-b684-4f479de40bb1'  AND VISIT_TIME >= '2021-12-02 10:31:00' AND VISIT_TIME <= '2021-12-02 10:36:00' GROUP BY VISIT_TARGETTYPE, VISIT_TARGETKEY;"
    ]
  ],
  "Action": [
    [
      "SELECT"
    ]
  ]
}
敢想、敢做、爱拼才会赢。


 被折叠的 条评论
为什么被折叠?
被折叠的 条评论
为什么被折叠?
 到【灌水乐园】发言


