


装了kubesphere 会默认帮我们装了 prometheus-operator ,通常我们不怎么会用operator,也不敢用,只能自己再去装个prometheus服务,这样容易造成资源浪费。
prometheus-operator架构图如下,可以自行百度,下面直接进行基于已经装好的prometheus-operator进行新的监控服务创建

1 创建Prometheus实例
若已经存在Prometheus服务实例 通常不用下面操作】
ks里已经有了operator 现在测试直接使用Prometheus的CRD 创建一个Prometheus实例
现在创建一个监控我们 springboot项目的实例
文件放在 192.168.xxx.xxx /root/prometheus/k8s-yaml (这是自己K8s管理的任意一台服务器+任意地址)
vi prometheus-boot.yaml
apiVersion: monitoring.coreos.com/v1
kind: Prometheus
metadata:
  name: springboot
  namespace: kubesphere-monitoring-system
spec:
  serviceAccountName: prometheus-jeq
  serviceMonitorSelector:
    matchLabels:
      team: springboot-sm
  resources:
    requests:
      memory: 200Mi
部署
kubectl apply -f prometheus-boot.yaml
查看Pod实例:
kubectl -n kubesphere-monitoring-system get pods
上述创建了sts,但是没有 service 不能外部访问界面, 需要手动再创建下先。
创建好后 访问http://192.168.160.144:31322/ 得到ui界面
2 给springboot项目配置依赖
pom依赖
           <dependency>
                <groupId>org.springframework.boot</groupId>
                <artifactId>spring-boot-starter-actuator</artifactId>
                <version>${springboot.version}</version>
            </dependency>
            <dependency>
                <groupId>io.micrometer</groupId>
                <artifactId>micrometer-registry-prometheus</artifactId>
                <version>1.5.1</version>
            </dependency>
nacos 或者application.yaml增加配置
management:
  metrics:
    prometheus:
      enabled: true
    tags:
      application: ${spring.application.name}
  endpoints:
    web:
      exposure:
        include: ["*"]
    shutdown:
      enabled: true
上述配置好后 将服务部署到k8s
3 创建/编辑 ServiceMonitor CRD
文件放在 192.168.xxx.xxx /root/prometheus/k8s-yaml/serviceMonitor/acp-export.yaml
apiVersion: monitoring.coreos.com/v1
kind: ServiceMonitor
metadata:
  name: springboot-sm
  namespace: kubesphere-monitoring-system
  labels:
    team: springboot-sm
spec:
  endpoints:
    - interval: 15s
      path: /acp/ams/actuator/prometheus
      port: http-8084
  namespaceSelector:
    any: true
  selector:
    matchLabels:
      micrometer-prometheus-discovery: 'true'
kubectl apply -f acp-export.yaml
再到kubesphere里找到这个部署的serviceMonitor CRD
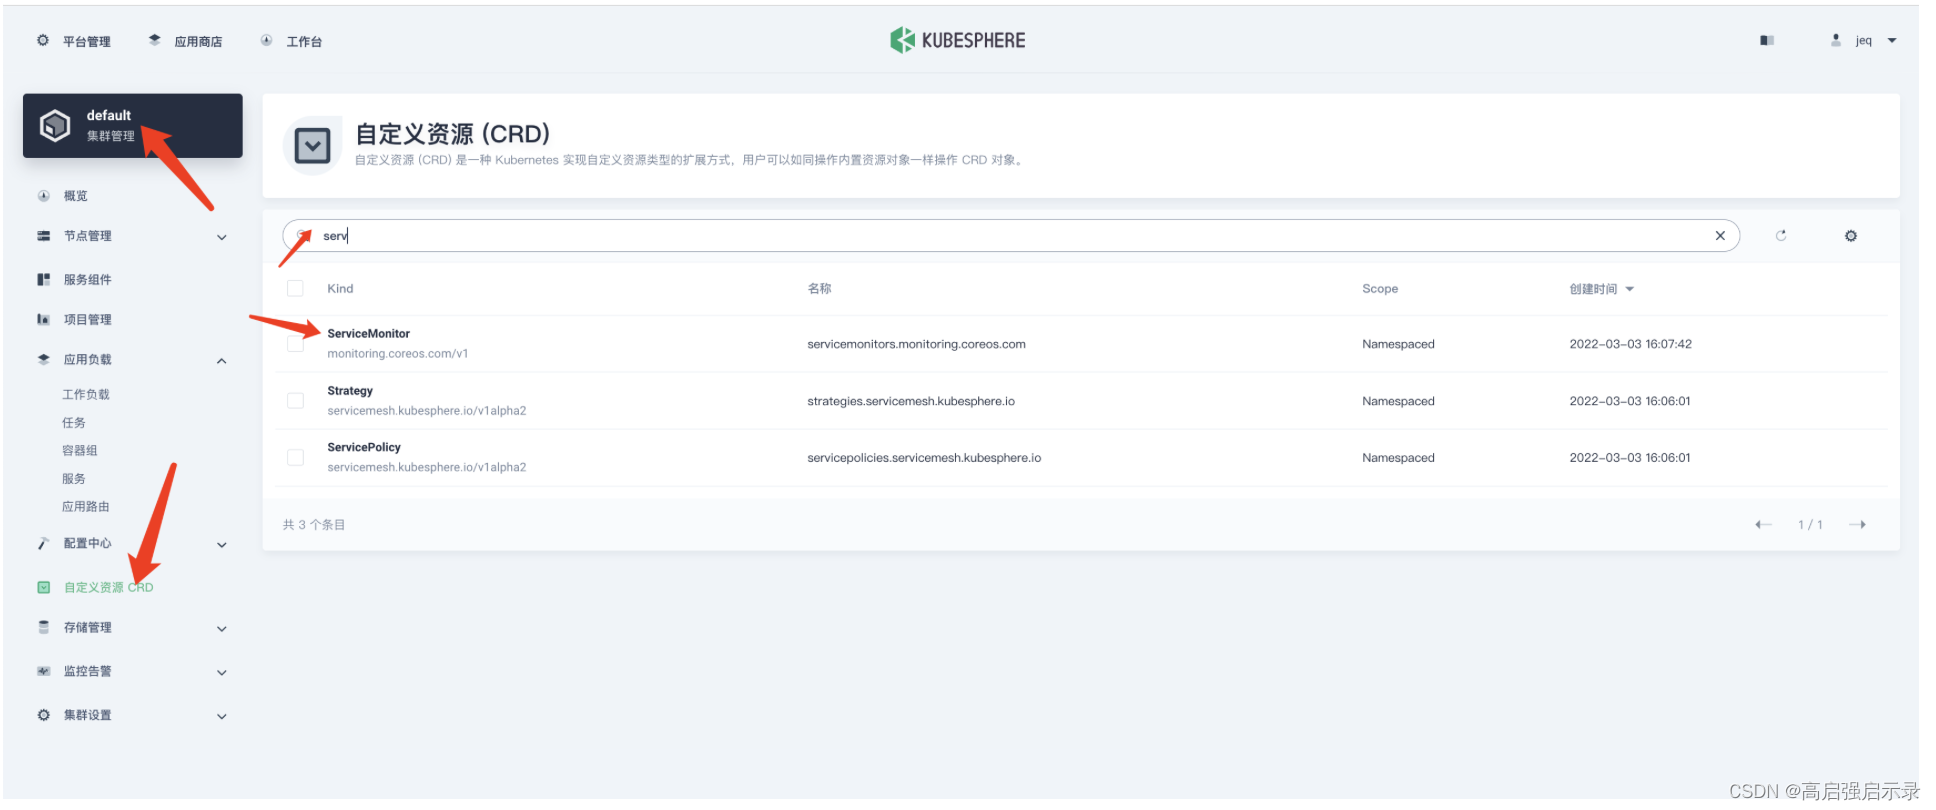
如上图所示 点击 ServiceMonitor 进入页面
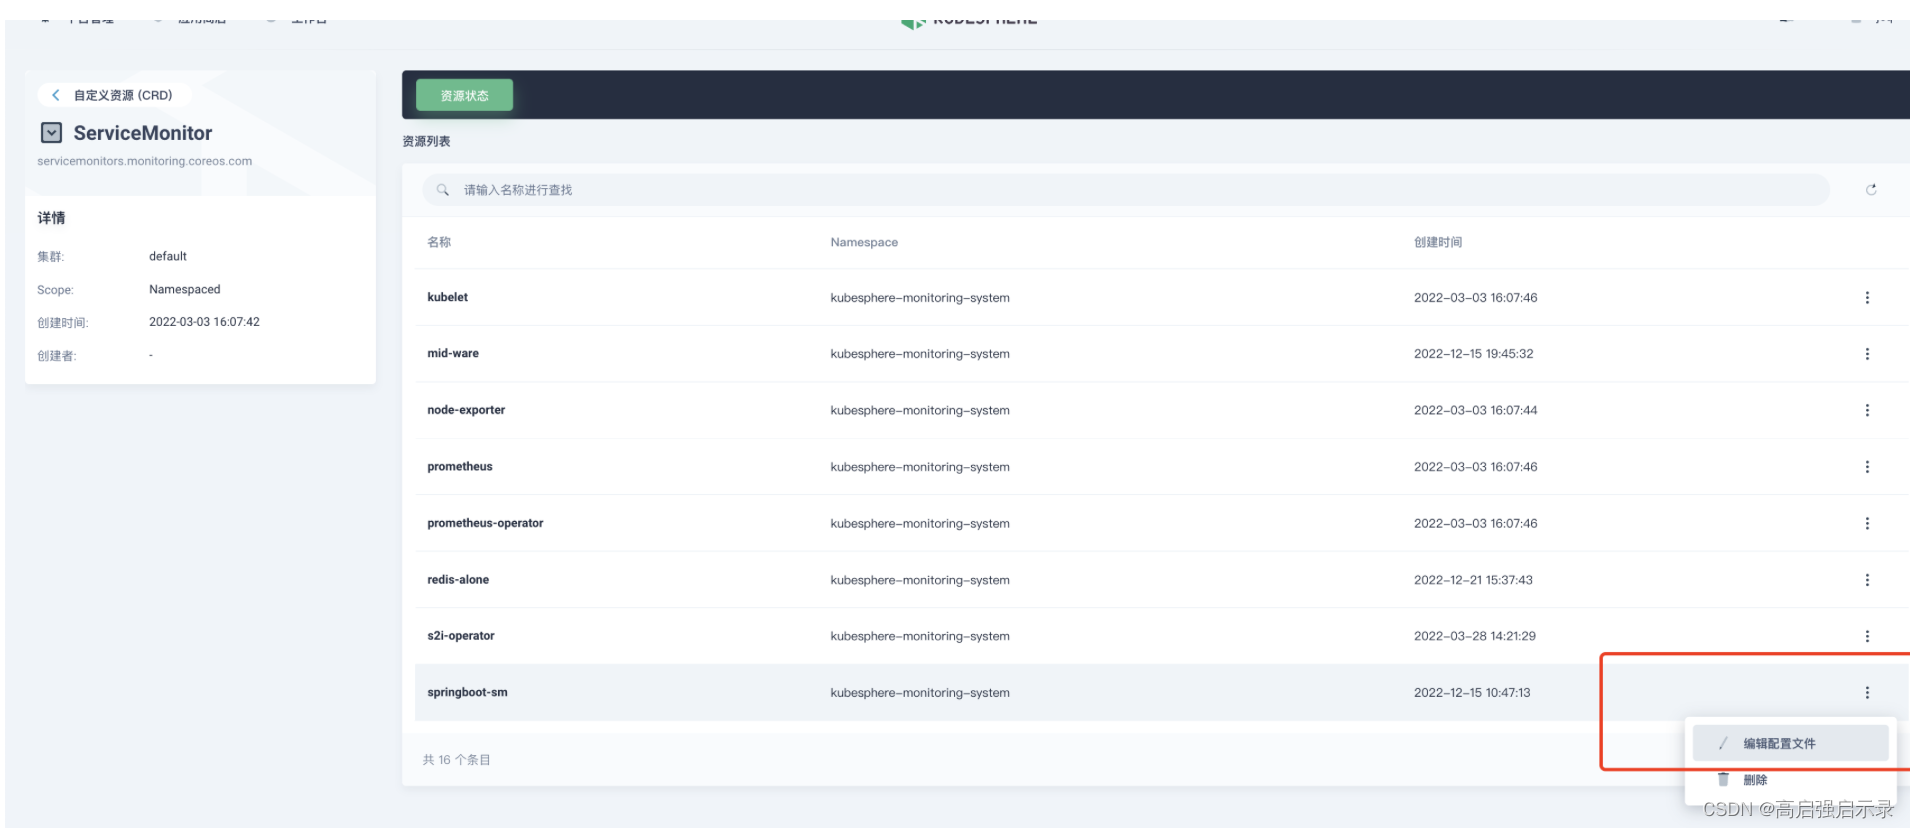
要新增监控的springboot服务 在上述ServiceMonitor直接添加endpoints即可
endpoints.port 是对应springboot项目的Service的name, 并且要给对应的service添加labels micrometer-prometheus-discovery: 'true'

4 grafana查看效果
成功后 prometheus ui页面的target能看到新增的目标
(servicemonitor更新先后 prometheus 的界面要过个几分钟才能看到数据)
grafana里也能看到新的数据


 1375
1375


 被折叠的 条评论
为什么被折叠?
被折叠的 条评论
为什么被折叠?
 到【灌水乐园】发言


