


安装
- perf
sudo yum install -y perf- 火焰图
到gitee中搜索一个火焰图的国内仓库
git clone git@gitee.com:wrran/FlameGraph.gitStep.1 编译运行要测试的程序
//   gcc -o test_flame test_flame.c
#include <fcntl.h>
#include <stdio.h>
#include <unistd.h>
int main()
{
	int fd = open("./file.txt", O_CREAT | O_RDWR);

	if (fd < 0)
	{
		printf("fd: %d\n", fd);
	}
	while (1)
	{

		char buf[8] = "xxxxxxx";
		int w_size = write(fd, buf, 8);
		char buf2[8];
		read(fd, buf2, 8);
	}
	return 0;
}
Step.2 使用命令生成perf.data数据
sudo ./gen_graph.sh # 清理数据
rm -f ./perf.data ./perf.data.old ./perf.svg ./perf.unfold ./per.folded
#1. perf 抓取数据
perf record -F 99 -a -g -p `pidof test_flame` -- sleep 2
#2. perf script 对perf.data进行解析
perf script -i perf.data &> perf.unfold
#3. 符号折叠
FlameGraph/stackcollapse-perf.pl perf.unfold &> perf.folded
#4. 生成火焰图
FlameGraph/flamegraph.pl perf.folded > perf.svgperf
-F 99 :1秒钟进行采集99次
-a:采集所有cpus信息
-g:收集调用栈
-- sleep 30:采集时间为30秒
-t:收集的线程id
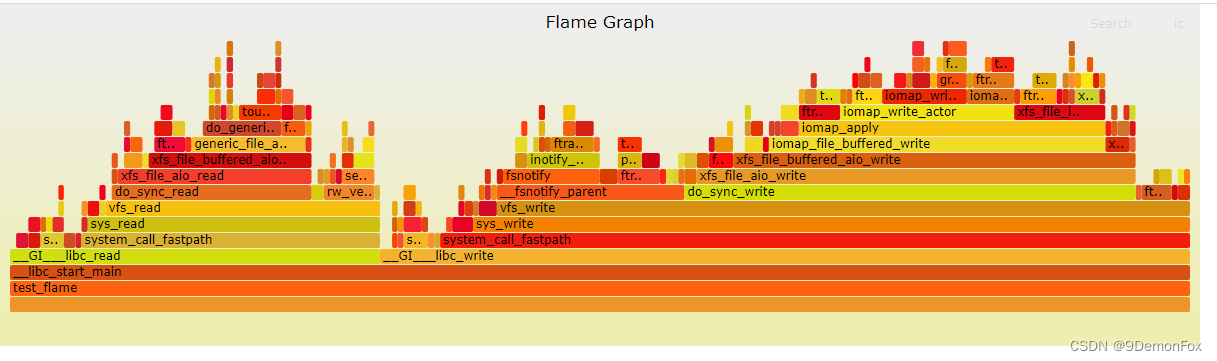
-p: 收集的进程idStep.3 生成的perf.svg


 895
895


 被折叠的 条评论
为什么被折叠?
被折叠的 条评论
为什么被折叠?
 到【灌水乐园】发言


