


 本文详细介绍如何在ECharts地图上绘制逼真的铁路线,包括多点连线、黑白相间效果及动态小火车图标实现。
工作中我们总是会遇到许多“无敌”的需求,当我正在专心搬砖时,突然被老板打断,他告诉我要在echarts地图上画一条铁路线,
这,官方好像没有这些api,但谁让我是一个勇于挑战的人呢,于是我在百度里遨游了半个多小时后,我只看到下面这些,传送门:https://gallery.echartsjs.com/editor.html?c=xCDj68xRo1
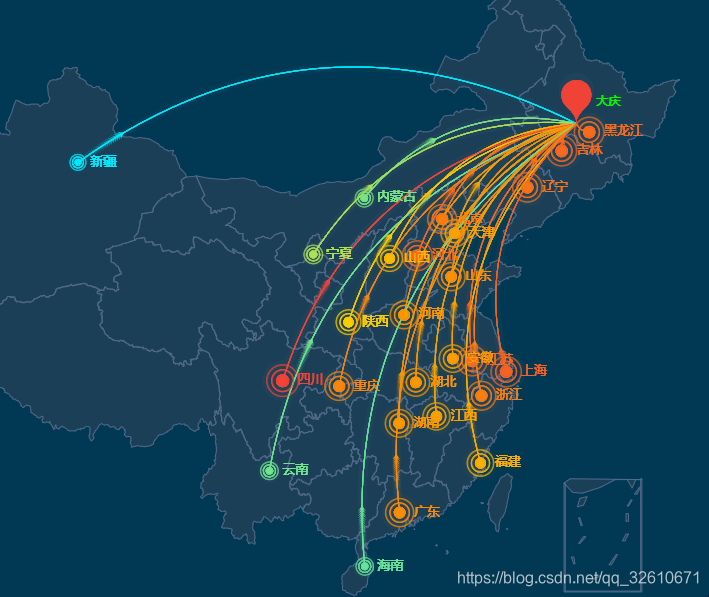
但这并不符合我的需求,我想要线路图,但不是这种只有终点和起点的线路,而是类似于公路一样的线路,在掉了两根头发之后,我找到了下面的例子
传送门:https://blog.csdn.net/bolanlaike/article/details/86234909
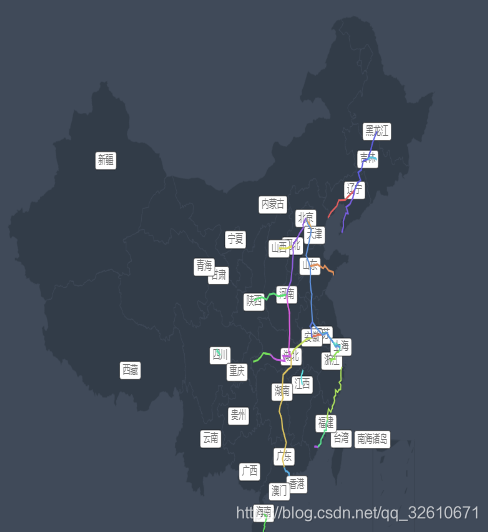
从这我得到了启发,于是我开始绘制铁路图,我用的vue,所以代码可能不一样,但我们主要看options,首先加载准备好的地图,想要地图文件的小伙伴可以看我这篇博客
https://blog.csdn.net/qq_32610671/article/details/103199936
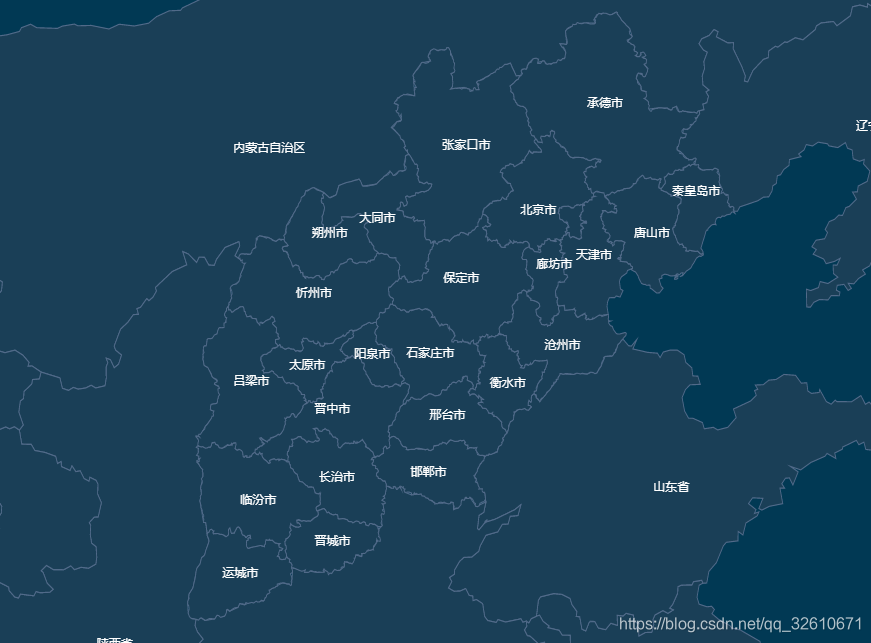
然后配置geo
      axios.get("./static/json/map/map.json", {}).then(data => {//加载地图文件
        // console.log(data);
        echarts.registerMap("map",data.data);
        this.chartOptions= {
          geo: {
            map: 'map',
            zoom: 4,
            roam:true,
            center:[116.4632992051,40.2979563489],
              label:{
              show:true,
                offset: [1, 1000],
                color:"#fff"
              },
            itemStyle: {
                color: '#1A3F57', //地图背景色
                borderColor: '#516a89', //省市边界线00fcff 516a89
                borderWidth: 1
              },
              emphasis: {
                itemStyle: {
                  color: '#87CEEB' //悬浮背景
                },
              }
          },
          backgroundColor:"#013954",
        };
      })
效果如下:
然后我们配置lines,准备画线,我的思路是在一条lines上加入多个转弯点,这样会比较形象,于是找了40多个点,分享一下我用的找点工具,在线经纬度查询:http://www.gpsspg.com/maps.htm
代码如下:
var trainLines=[
  [113.2299915090,39.9740137595],
  [113.2440222746,40.0112798938],
  [113.3205599644,39.9793044406],
  [113.5897397104,39.9935195891],
  [113.6323071328,40.0198128677],
  [113.8410727439,40.0150987625],
  [114.4927191451,40.2099428870],
  [114.6972954652,40.2848528330],
  [114.7763247358,40.2492769771],
  [115.1237282065,40.3351402443],
  [115.3980349329,40.3365057085],
  [115.5288097250,40.3541452998],
  [115.6386383872,40.3554242305],
  [115.7347770152,40.3962330991],
  [115.8220218461,40.4553254384],
  [115.9331074866,40.5098818055],
  [115.9976856501,40.4771481623],
  [116.0787930898,40.4188610923],
  [116.1805699260,40.3966647294],
  [116.3496784000,40.3334798038],
  [116.4363997773,40.2848511711],
  [116.4632992051,40.2979563489],
  [116.5608981005,40.2807742090],
  [116.6353132497,40.2810950813],
  [116.7438012799,40.2510310010],
  [116.8890266543,40.1809692086],
  [117.0436772920,40.1081611627],
  [117.0881500867,40.0402227345],
  [117.1534061331,39.9808125645],
  [117.3257262736,40.0097217651],
  [117.4160471025,40.0073872152],
  [117.4984682179,39.9753135523],
  [117.5904577438,39.9774022050],
  [117.6783250968,39.9584408860],
  [117.8170650554,40.0899211878],
  [117.9955507123,40.2273765912],
  [118.3897079730,40.1634100519],
  [118.5737399463,40.1844054101],
  [118.8497693728,40.0457762723],
  [119.0337606296,40.0068410146],
  [119.2590000686,40.0363047577],
  [119.4159339421,39.9429499750],
  [119.5889017503,39.9665806839],
  [119.6953706089,39.9866073744],
  [119.7109338177,39.9490638606],
  [119.6841482180,39.9455054281],
];//火车线路

series: [
            {type:"lines",
            coordinateSystem: 'geo',// 这句的意思是连线是基于地理坐标的,geo组件将在下面给出
            polyline: true,// 这表示连线是否为多端点的连线
            data: [{
              coords: trainLines
            }],
              lineStyle: {
                color: "black",
                width:4,
              },
            progressiveThreshold: 500,
            progressive: 200,
            },]
效果如下:
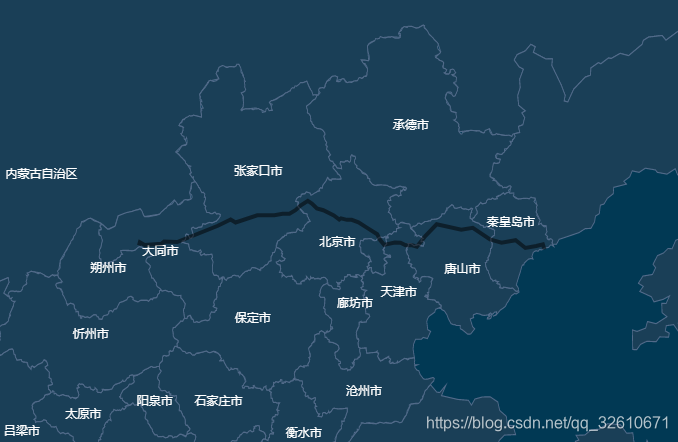
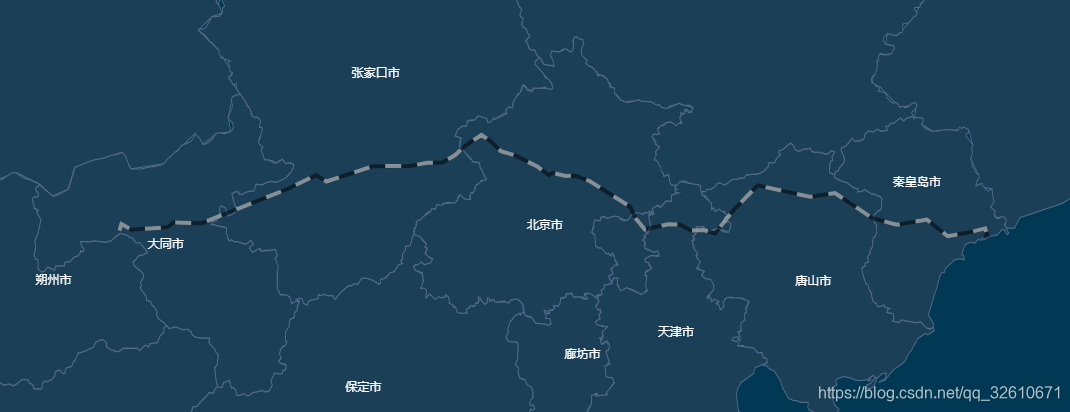
于是我得到了这样一坨黑线,但还是不够形象,总觉得差了点东西,对,是黑白相间的铁路,在我经过两根头发的消耗后,我又找到了解决办法,那就是在画一条一模一样的虚线,颜色变为白色这样就会出现,一截黑一截白的样子,嗯,完美
 series: [
            {type:"lines",
            coordinateSystem: 'geo',// 这句的意思是连线是基于地理坐标的,geo组件将在下面给出
            polyline: true,// 这表示连线是否为多端点的连线
            data: [{
              coords: trainLines
            }],
              lineStyle: {
                color: "black",
                width:4,
              },
            progressiveThreshold: 500,
            progressive: 200,
            },
            {type:"lines",
              coordinateSystem: 'geo',// 这句的意思是连线是基于地理坐标的,geo组件将在下面给出
              polyline: true,// 这表示连线是否为多端点的连线
              data: [{
                coords: trainLines
              }],
              lineStyle:{
              color:"#fff",
                width:4,
                type:"dashed",
              },
              progressiveThreshold: 500,
              progressive: 200,
            },]
于是得到了这样一幅图
完全ok,后期优化的时候我又加入了一个小火车图标,图标使用了svgpath格式,从阿里巴巴矢量图标网下载的,具体可以参考这里:
https://www.iconfont.cn/
https://www.echartsjs.com/zh/option.html#series-lines.effect.symbol
并让它在铁路线上循环移动,感觉还是很不错的,最终代码如下:
<template>
  <div style="width: 100%;height: 670px;">
    <chart id="chart" ref="chart" style="width:100%;height:100%" :options="chartOptions"></chart>
  </div>
</template>

<script>
  import echarts from "echarts";
  import axios from "axios";
var trainLines=[
  [113.2299915090,39.9740137595],
  [113.2440222746,40.0112798938],
  [113.3205599644,39.9793044406],
  [113.5897397104,39.9935195891],
  [113.6323071328,40.0198128677],
  [113.8410727439,40.0150987625],
  [114.4927191451,40.2099428870],
  [114.6972954652,40.2848528330],
  [114.7763247358,40.2492769771],
  [115.1237282065,40.3351402443],
  [115.3980349329,40.3365057085],
  [115.5288097250,40.3541452998],
  [115.6386383872,40.3554242305],
  [115.7347770152,40.3962330991],
  [115.8220218461,40.4553254384],
  [115.9331074866,40.5098818055],
  [115.9976856501,40.4771481623],
  [116.0787930898,40.4188610923],
  [116.1805699260,40.3966647294],
  [116.3496784000,40.3334798038],
  [116.4363997773,40.2848511711],
  [116.4632992051,40.2979563489],
  [116.5608981005,40.2807742090],
  [116.6353132497,40.2810950813],
  [116.7438012799,40.2510310010],
  [116.8890266543,40.1809692086],
  [117.0436772920,40.1081611627],
  [117.0881500867,40.0402227345],
  [117.1534061331,39.9808125645],
  [117.3257262736,40.0097217651],
  [117.4160471025,40.0073872152],
  [117.4984682179,39.9753135523],
  [117.5904577438,39.9774022050],
  [117.6783250968,39.9584408860],
  [117.8170650554,40.0899211878],
  [117.9955507123,40.2273765912],
  [118.3897079730,40.1634100519],
  [118.5737399463,40.1844054101],
  [118.8497693728,40.0457762723],
  [119.0337606296,40.0068410146],
  [119.2590000686,40.0363047577],
  [119.4159339421,39.9429499750],
  [119.5889017503,39.9665806839],
  [119.6953706089,39.9866073744],
  [119.7109338177,39.9490638606],
  [119.6841482180,39.9455054281],
];//火车线路
  //火车小图标
   var trainPath="path://M807.4 938.5c-139.5-8-250.2-31.7-250.2-173.2v-95.5c0-35.5 72.5-64.3 108-64.3h0.3l0.9-152.4c0-8.5-6.9-15.4-15.4-15.4H373.2c-8.5 0-15.4 6.9-15.4 15.4l0.6 148.7c33.6 2.1 103.8 30 103.8 64.1v95.5c0 142.2-111.8 168.4-252.3 175.3l-0.1 0.3 0.9 71.5c0 8.5 6.9 15.4 15.4 15.4h568.1c8.5 0 15.4-6.9 15.4-15.4l-0.8-69.8-1.4-0.2zM598.2 64.5V18.6c0-8.5-6.9-15.4-15.4-15.4H428.6c-8.5 0-15.4 6.9-15.4 15.4V67C212.1 111.8 61.7 291.3 61.7 506c0 153.6 77 289.2 194.4 370.3l42.7-136.7C236 681 196.7 597.4 196.7 504.7c0-177.4 143.8-321.3 321.3-321.3s321.3 143.8 321.3 321.3c0 97.9-43.8 185.5-112.8 244.5l40.1 127.4C884.2 795.4 961.4 659.7 961.4 506c0-218.8-156.2-401.1-363.2-441.5z";

  export default {
    data(){
      return{
        chartOptions:{},
      }
    },
    mounted() {
      axios.get("./static/json/map/map.json", {}).then(data => {
        // console.log(data);
        echarts.registerMap("map",data.data);
        this.chartOptions= {
          series: [
            {type:"lines",//第一条实线
            coordinateSystem: 'geo',// 这句的意思是连线是基于地理坐标的,geo组件将在下面给出
            polyline: true,// 这表示连线是否为多端点的连线
            data: [{
              coords: trainLines
            }],
              lineStyle: {
                color: "black",
                width:4,
              },
              effect: {//线特效,小火车
                constantSpeed: 10,
                show: true,
                color: '#00EAFF',
                symbolSize: 15,
                symbol: trainPath,
              },
            progressiveThreshold: 500,
            progressive: 200,
            },
            {type:"lines",//第二条虚线
              coordinateSystem: 'geo',// 这句的意思是连线是基于地理坐标的,geo组件将在下面给出
              polyline: true,// 这表示连线是否为多端点的连线
              data: [{
                coords: trainLines
              }],
              lineStyle:{
              color:"#fff",
                width:4,
                type:"dashed",
              },
              progressiveThreshold: 500,
              progressive: 200,
            }
          ],
          geo: {//地图配置
            map: 'map',
            zoom: 4,
            roam:true,
            center:[116.4632992051,40.2979563489],
              label:{
              show:true,
                offset: [1, 1000],
                color:"#fff"
              },
            itemStyle: {
                color: '#1A3F57', //地图背景色
                borderColor: '#516a89', //省市边界线00fcff 516a89
                borderWidth: 1
              },
              emphasis: {
                itemStyle: {
                  color: '#87CEEB' //悬浮背景
                },
              }
          },
          backgroundColor:"#013954",
        };
      })
    }
  }

</script>
最终效果:
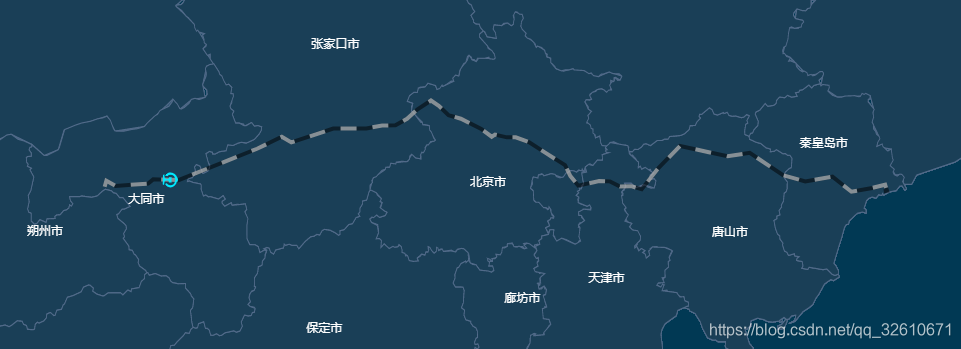
ok,大功告成,摸着我略微发凉的头皮,目光远眺,我仿佛看到了那天夕阳的奔跑,那是我逝去的青春!!!


 406
406

 被折叠的 条评论
为什么被折叠?
被折叠的 条评论
为什么被折叠?
 到【灌水乐园】发言


