


环境
Qt 5.4.2
QCustomPlot
功能
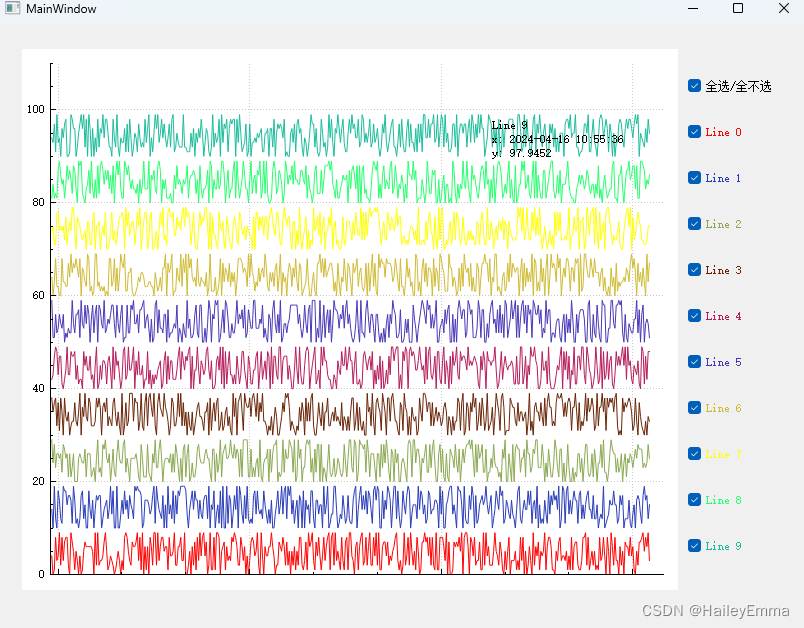
1.X:时间, Y:实时数据, 鼠标移动显示坐标点
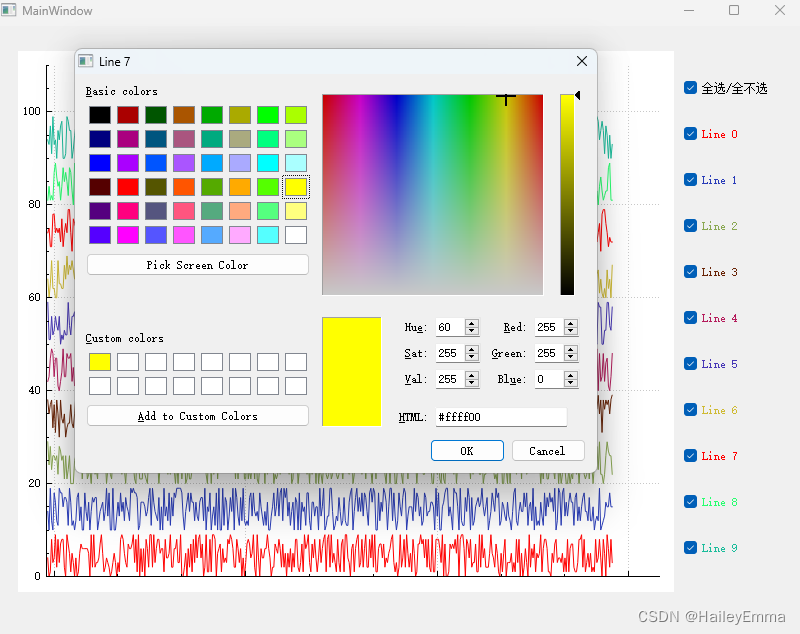
2.实时显示曲线,可更改曲线颜色,可隐藏/显示曲线
源码
1.下载QCustomPlot,将源码添加到项目中
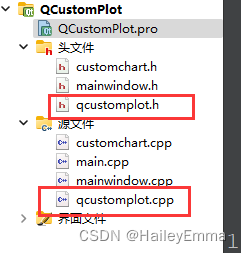
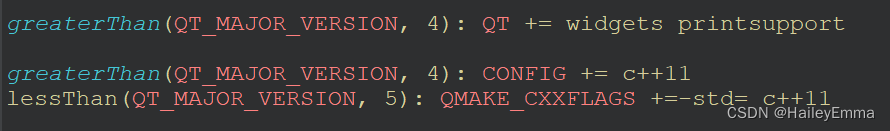
2.修改Pro文件
3.CustomChart 源码
CustomChart.h
struct Point    //坐标点
{
   QString sX;
   double  dX;
   double  dY;
   Point(){
     sX="";
     dX=0;
     dY=0;
  }
};

struct Line                     //曲线
{
    QString sName;             //曲线名称
    QList<Point> tPoints;      //坐标
    Line()
    {
        sName = "";
        tPoints.clear();
    }
};

namespace Ui { class CustomChart; }
class ChartCheckBox;

class CustomChart : public QMainWindow
{
    Q_OBJECT
public:
    explicit CustomChart(QWidget *parent = 0);
    ~CustomChart();
private:
    Ui::CustomChart *ui;
private:
    QCustomPlot *pCustomPlot;
    QList<Line> tLineArray;            //曲线点
    QList<ChartCheckBox *> checkArray; //曲线

    QLabel *pLabel;                    //鼠标移动显示坐标
    QWidget *pScrollWidget;
    QVBoxLayout *pVBoxLayout;

    double dLower;                      //X轴范围
    double dUpper;
public:
    int AddLine(QString lineName);
    int DelLine(QString lineName);
    int AddPoint(QString lineName,Point point);
    int ClearLine();
private:
    void InitCustomChart();
private slots:
    void CheckBoxStateChanged(int identify,int state);
    void CheckBoxColorChanged(int identify,QColor color);
    void ChartMouseMove(QMouseEvent *event);
    void SelecetChanged(int state);
};
class ChartCheckBox:public QCheckBox
{
    Q_OBJECT
public:
    explicit ChartCheckBox(){installEventFilter(this); }
    explicit ChartCheckBox(const QString &text){this->setText(text); installEventFilter(this);}
    ~ChartCheckBox(){}
protected:
    bool eventFilter(QObject *obj, QEvent *event)    //Change Color
    {
        if(obj == this && event->type() == QEvent::MouseButtonPress)
        {
            QMouseEvent *mouseEvent = static_cast<QMouseEvent*>(event);
            if (mouseEvent->button() == Qt::RightButton)
            {
              QColorDialog colorDialog;
              QColor selectedColor = colorDialog.getColor(Qt::red,NULL,this->text());
              if(selectedColor.isValid())
              {
                 setStyleSheet(QString("QCheckBox { color: %1; }").arg(selectedColor.name()));
                 emit  changeColors(nIdentify,selectedColor);
              }
              return true;
            }
        }
        return QCheckBox::eventFilter(obj, event);
    }
public:
    void SetIdentify(int nindex)
    {
        nIdentify = nindex;
        connect(this,SIGNAL(stateChanged(int)),this,SLOT(slot_stateChanged(int)));
    }
signals:
    void stateSignals(int identify,int state);
    void changeColors(int identify,QColor color);
private slots:
    void slot_stateChanged(int state){emit stateSignals(nIdentify,state);}
private:
    int nIdentify;
};
CustomChart.cpp:
CustomChart::CustomChart(QWidget *parent) :
    QMainWindow(parent),
    ui(new Ui::CustomChart)
{
    ui->setupUi(this);
    InitCustomChart();
}
CustomChart::~CustomChart()
{
    delete ui;
}

int CustomChart::AddLine(QString lineName)
{
      int ColorR = rand()%210;
      int ColorG = rand()%210;
      int ColorB = rand()%210;

      Line tLine;

      tLine.sName = lineName;
      tLine.tPoints.clear();
      tLineArray.append(tLine);

      ui->WChart->addGraph();
      ui->WChart->graph(tLineArray.count()-1)->setPen(QPen(QColor(ColorR,ColorG,ColorB)));
      ui->WChart->graph(tLineArray.count()-1)->setName(lineName);


      if(1 == tLineArray.count())
      {
         QCheckBox *checkBox= new QCheckBox();
         checkBox->setText("全选/全不选");
         checkBox->setChecked(true);
         pVBoxLayout->addWidget(checkBox);

         connect(checkBox,SIGNAL(stateChanged(int)),this,SLOT(SelecetChanged(int)));
       }

        ChartCheckBox *cbxChart=new ChartCheckBox();
        pVBoxLayout->addWidget(cbxChart);


        cbxChart->setText(lineName);         //曲线名
        cbxChart->setCheckState(Qt::Checked); //设置checkBox状态为勾选状态
        cbxChart->SetIdentify(tLineArray.count()-1);
        cbxChart->setStyleSheet("color: rgb("+QString::number(ColorR)+ ","+QString::number(ColorG)+ ","+QString::number(ColorB) +");");
        connect(cbxChart, SIGNAL(stateSignals(int,int)), this, SLOT(CheckBoxStateChanged(int,int)));
        connect(cbxChart, SIGNAL(changeColors(int,QColor)), this, SLOT(CheckBoxColorChanged(int,QColor)));
        checkArray.append(cbxChart);
        return 0;
}
int CustomChart::DelLine(QString lineName)
{
    for(int i=0; i<tLineArray.count();i++)
    {
        if(lineName == tLineArray[i].sName)
        {
            tLineArray.removeAt(i);
            ui->WChart->removeGraph(ui->WChart->graph(i));
            QLayoutItem *pLayoutItem;
            QWidget *pLayoutWidget;
            ChartCheckBox *pLayoutCheck;
            for (int i = 0; i < pVBoxLayout->count(); i++)
            {
                pLayoutItem = pVBoxLayout->itemAt(i);
                pLayoutWidget = pLayoutItem->widget();
                pLayoutCheck = qobject_cast<ChartCheckBox*>(pLayoutWidget);
                if(pLayoutCheck)
                {
                    if(lineName == pLayoutCheck->text())
                    {
                        delete pLayoutWidget;
                    }
                }
             }
            return 0;
        }
    }
    ui->WChart->replot();
    return -1;
}
int CustomChart::AddPoint(QString lineName, Point point)
{
    for(int i=0; i<tLineArray.count(); i++)
    {
        if(lineName == tLineArray[i].sName)
        {
            tLineArray[i].tPoints.append(point);
            ui->WChart->graph(i)->addData(point.dX,point.dY);
            qint64 milliseconds = qint64(point.dX * 1000.0);
            QDateTime currentDateTime = QDateTime::fromMSecsSinceEpoch(milliseconds);
            double upper = (double)(currentDateTime.toMSecsSinceEpoch() / 1000.0);
            //不丢失数据,继续加载数据,修改X轴范围区间
            if(dUpper <= upper)
            {
                dUpper = (double)(currentDateTime.addSecs(60).toMSecsSinceEpoch() / 1000.0);;
                ui->WChart->xAxis->setRange(dLower,dUpper);
            }
            ui->WChart->replot();
            return 0;
        }
    }
    return -1;
}

int CustomChart::ClearLine()
{
    tLineArray.clear();
    ui->WChart->clearGraphs();
    checkArray.clear();
    QLayoutItem *child;

    while ((child = pVBoxLayout->takeAt(0)) != NULL)
    {
        delete child->widget();
        delete child;
    }
    return 0;
}

void CustomChart::InitCustomChart()
{
    tLineArray.clear();
    checkArray.clear();

    pVBoxLayout =new QVBoxLayout(ui->WLine);
    pVBoxLayout->setMargin(5);

    ui->WLine->setLayout(pVBoxLayout);
    pCustomPlot = ui->WChart;

    ui->WChart->xAxis->setLabel("");
    ui->WChart->yAxis->setLabel("");

    QSharedPointer<QCPAxisTickerDateTime> dateTicker(new QCPAxisTickerDateTime);  //日期做X轴
    dateTicker->setDateTimeFormat("yyyy-MM-dd\nhh:mm:ss");//日期格式(可参考QDateTime::fromString()函数)

    ui->WChart->xAxis->setTicker(dateTicker);//设置X轴为时间轴
    ui->WChart->xAxis->setTickLabelRotation(35);//设置角度
    ui->WChart->xAxis->setTickLabels(false);//显示刻度标签
    ui->WChart->setInteractions(QCP::iRangeDrag          //可平移
                                | QCP::iRangeZoom        //可轮缩放
                                | QCP::iSelectLegend );  //可选中图例

    pCustomPlot->yAxis->setRange(0,110);

    dLower = (double)(QDateTime::currentDateTime().toMSecsSinceEpoch()/1000.0);
    dUpper = (double)(QDateTime::currentDateTime().addSecs(300).toMSecsSinceEpoch() / 1000.0);
    ui->WChart->xAxis->setRange(dLower,dUpper);

    //创建一个标签用于显示坐标
    pLabel = new QLabel(ui->WChart);
    pLabel->setVisible(false);
    connect(pCustomPlot,SIGNAL(mouseMove(QMouseEvent*)),this,SLOT(ChartMouseMove(QMouseEvent*)));
}

void CustomChart::CheckBoxStateChanged(int identify, int state)
{
    if(state!=0)
    {
        //显示
        ui->WChart->graph(identify)->setVisible(true);
    }else{
        //隐藏
        ui->WChart->graph(identify)->setVisible(false);
    }
    ui->WChart->replot();
}

void CustomChart::CheckBoxColorChanged(int identify, QColor color)
{
    ui->WChart->graph(identify)->setPen(QPen(color));
    ui->WChart->replot();
}
void CustomChart::ChartMouseMove(QMouseEvent *event)
{
    double x = ui->WChart->xAxis->pixelToCoord(event->pos().x());
    double y = ui->WChart->yAxis->pixelToCoord(event->pos().y());
    QPoint pos = event->pos();
    QCPAbstractPlottable *plottable = ui->WChart->plottableAt(pos);
    if(plottable)
    {
         QCPGraph *graph = qobject_cast<QCPGraph*>(plottable);
         int dataIndex = graph->selectTest(pos, false);
         if(dataIndex == -1)   {  pLabel->setVisible(false); return; }
         if(!graph->visible()) {  pLabel->setVisible(false);  return; }
         qint64 milliseconds = qint64(x * 1000.0);
         QDateTime currentDateTime = QDateTime::fromMSecsSinceEpoch(milliseconds);
         QString sDateTime = currentDateTime.toString("yyyy-MM-dd hh:mm:ss");
         pLabel->setText(graph->name() + "\n"+QString("x: %1\ny: %2").arg(sDateTime).arg(y));
         pLabel->move(event->x()+5,event->y());
         pLabel->setVisible(true);
         return;
     }
      pLabel->setVisible(false);
}


void CustomChart::SelecetChanged(int state)
{
    if(state != 0) //全部显示
    {
        for(int i=0; i<checkArray.count(); i++)
        {
            checkArray[i]->setChecked(true);
        }
    }else{         //全部取消
        for(int i=0; i<checkArray.count(); i++)
        {
            checkArray[i]->setChecked(false);
        }
    }
}
3.mainWindow 源码
mainWindow.h
#include "customchart.h"
namespace Ui {class MainWindow;}

class MainWindow : public QMainWindow
{
    Q_OBJECT
public:
    explicit MainWindow(QWidget *parent = 0);
private:
    Ui::MainWindow *ui;
private:
    QTimer *pFlushTimer;
    CustomChart *pCustomChart;
private:
     void InitFlushTime();
private slots:
     void on_flushTimerOut();
};
mainWindow.cpp
MainWindow::MainWindow(QWidget *parent) :
    QMainWindow(parent),
    ui(new Ui::MainWindow)
{
    ui->setupUi(this);

    pCustomChart = new CustomChart();
    QGridLayout *layout = new QGridLayout();
    layout->addWidget(pCustomChart);
    ui->widget->setLayout(layout);
    for(int i=0; i<10; i++)
    {
        pCustomChart->AddLine("Line "+QString::number(i));
    }
    InitFlushTime();
}
void MainWindow::InitFlushTime()
{
    pFlushTimer = new QTimer();
    pFlushTimer->setInterval(1000);
    pFlushTimer->start();
    connect(pFlushTimer,SIGNAL(timeout()),this,SLOT(on_flushTimerOut()));
}

void MainWindow::on_flushTimerOut()
{
   Point point;
   for(int i=0; i<10; i++)
   {
       point.sX = QDateTime::currentDateTime().toString("yyyy-MM-dd hh:mm:ss");
       point.dX = (double)(QDateTime::currentDateTime().toMSecsSinceEpoch()/1000.0);
       point.dY = qrand()% 10 + i*10;
       pCustomChart->AddPoint("Line "+QString::number(i),point);
   }
}
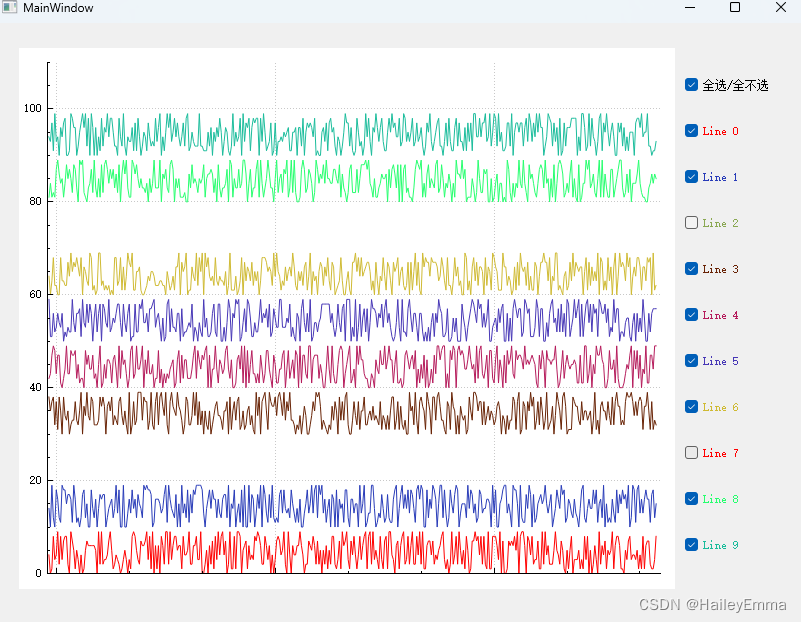
运行
运行结果如下:


 1088
1088


 被折叠的 条评论
为什么被折叠?
被折叠的 条评论
为什么被折叠?
 到【灌水乐园】发言


