


展示数据:grafana:
数据存储:prometheus普罗米修斯,是一种时序数据库(按照时间顺序记录系统、设备状态变化的数据被称为时序数据。)
------存 数据(一般不放被测服务器)
数据收集:exporter ,收集不同监控数据,用不同 exporter。
------采集器(放在 被测服务器上)
Prometheus的安装
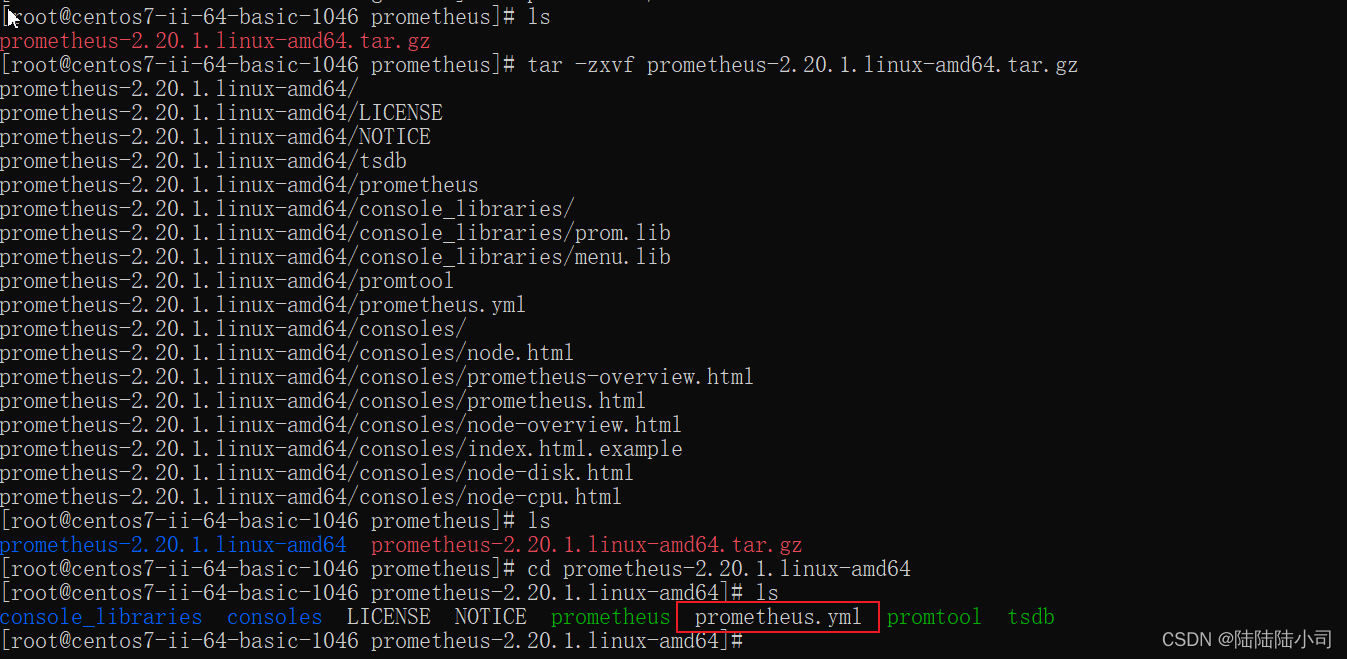
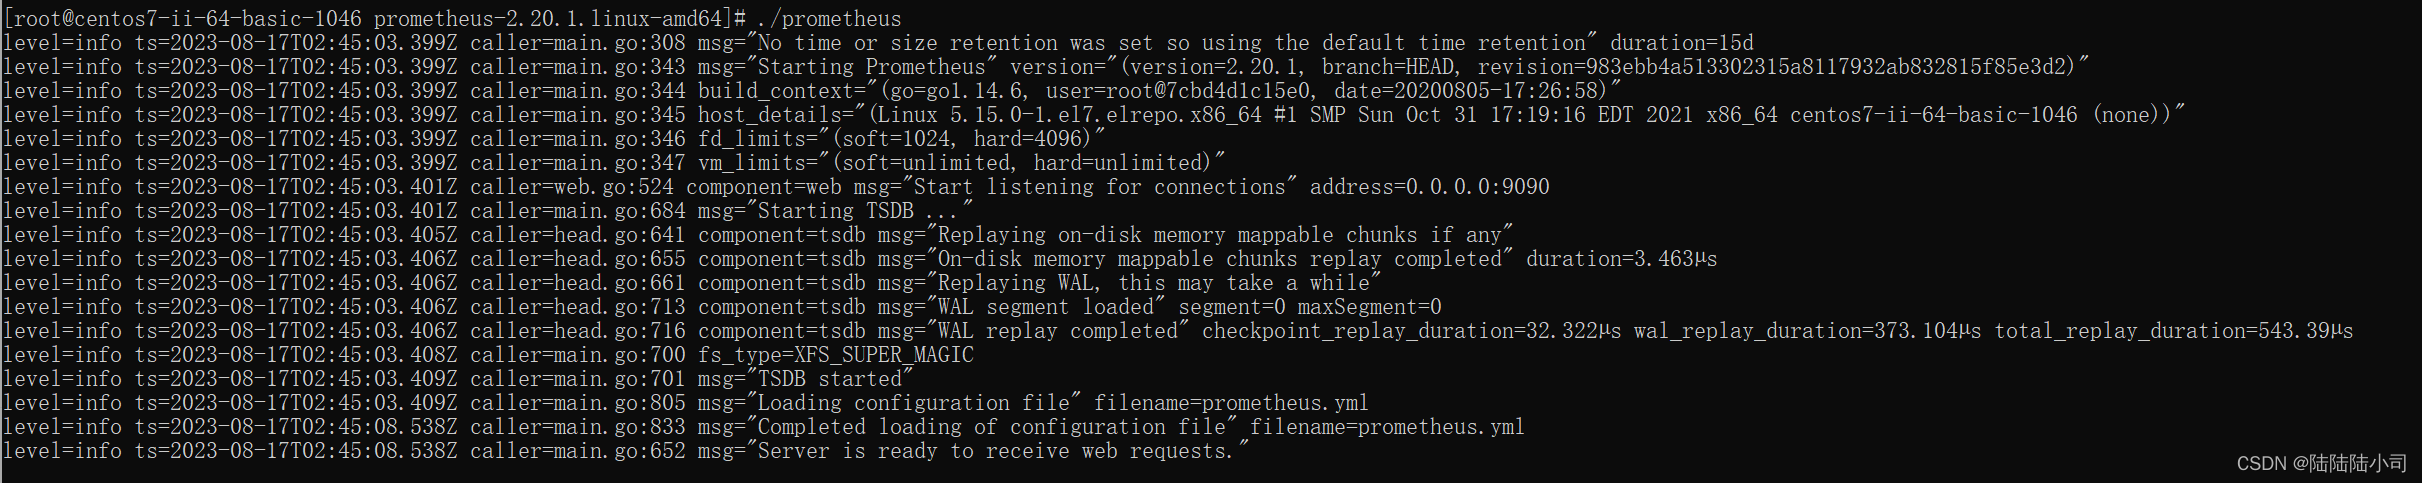
prometheus的启动: ./prometheus 端口默认为9090
exporter 的安装
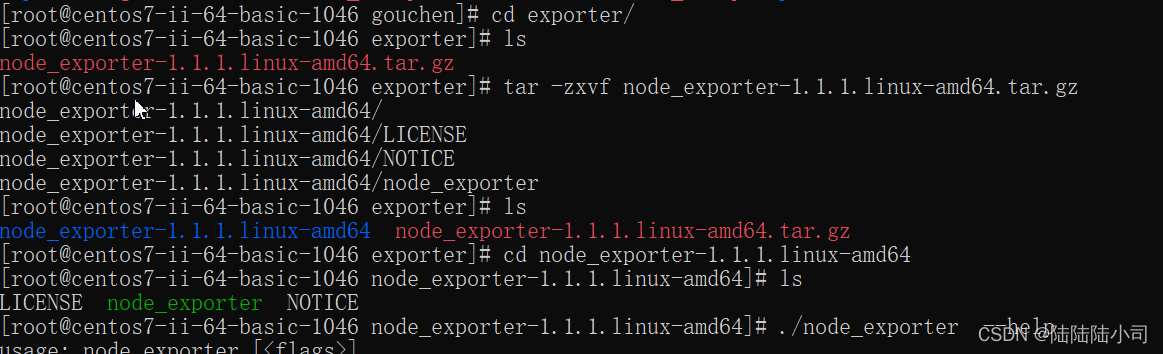
exporter的启动:
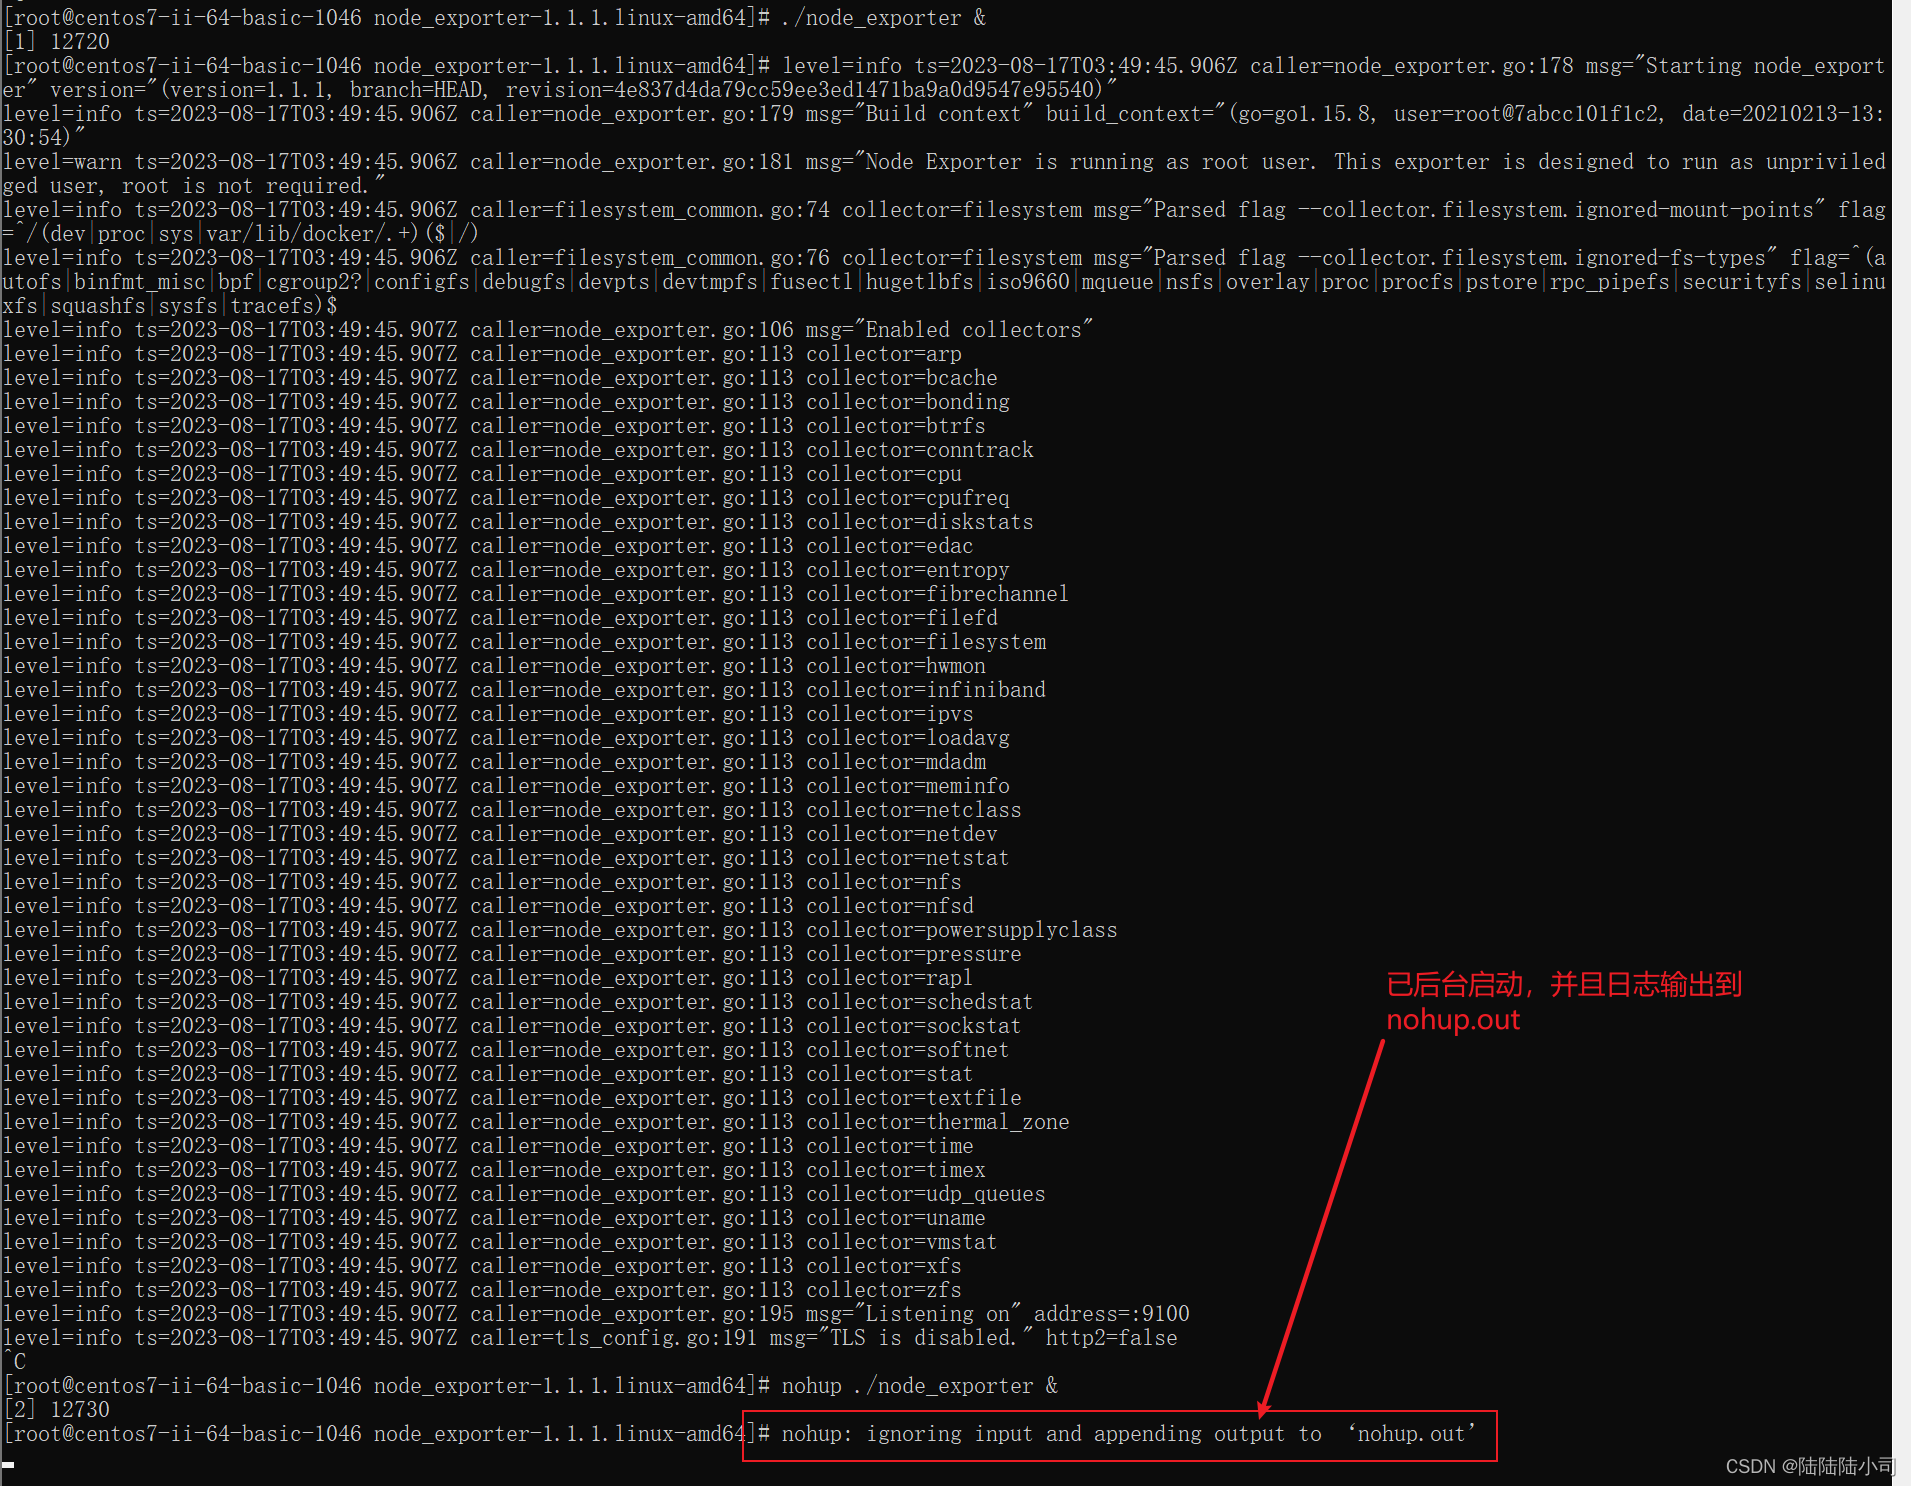
直接启动:./node_exporter 端口号9100
作为后台程序启动: nohup ./node_exporter&
查看二者之间的网络是否是通的。如果没有telnet命令 (yum install telnet -y )

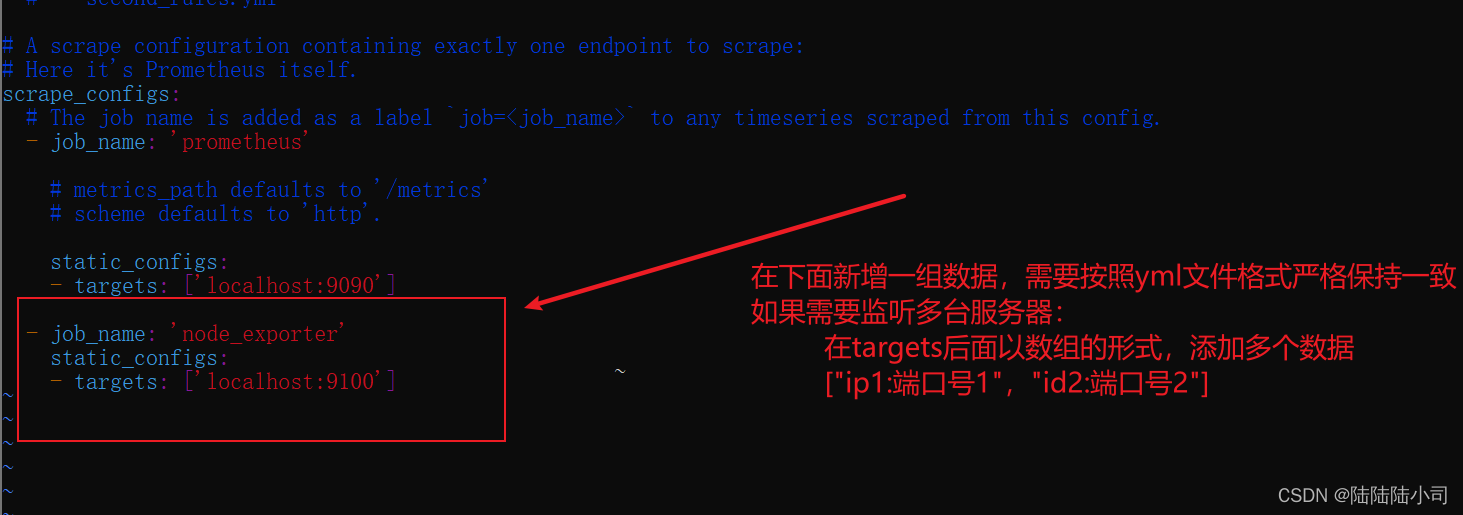
修改prometheus.yml 配置文件:填写exporter的服务信息(ip和端口)
scrape_configs:
  # The job name is added as a label `job=<job_name>` to any timeseries scraped from this config.
  - job_name: 'prometheus'

    # metrics_path defaults to '/metrics'
    # scheme defaults to 'http'.

    static_configs:
    - targets: ['localhost:9090']
~
添加配置信息的时候,注意字段末尾不要有空格
grafana 安装
官网下载地址:https://grafana.com/grafana/download
yum install initscripts fontconfig -y
wget https://dl.grafana.com/oss/release/grafana-7.3.4-1.x86_64.rpm
sudo yum install grafana-7.3.4-1.x86_64.rpm
# 启动

$ service grafana-server start
或者进入目录cd /grafana/bin/
./grafana-server start &
#查看服务是否启动:

netstat -anp |grep grafana

#如果没有 netstat命令,需要通过 yum install net-tools进行安装
访问地址:http://IP:3000
账号: admin 密码: admin
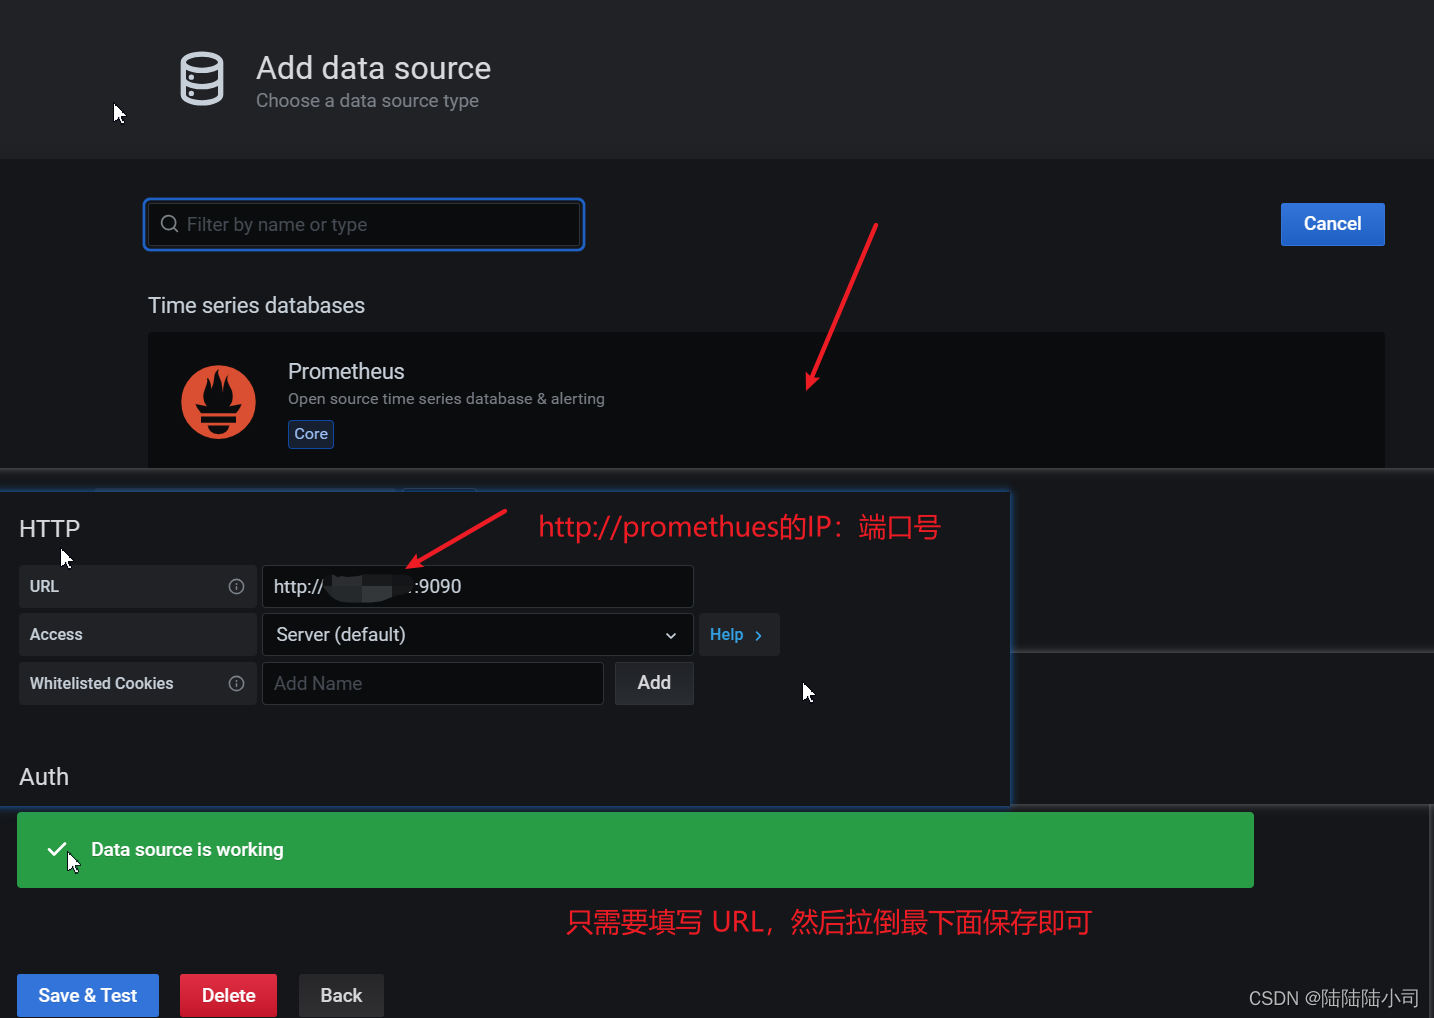
3、对接prometheus
HTTP URL: 填写Prometheus,IP:端口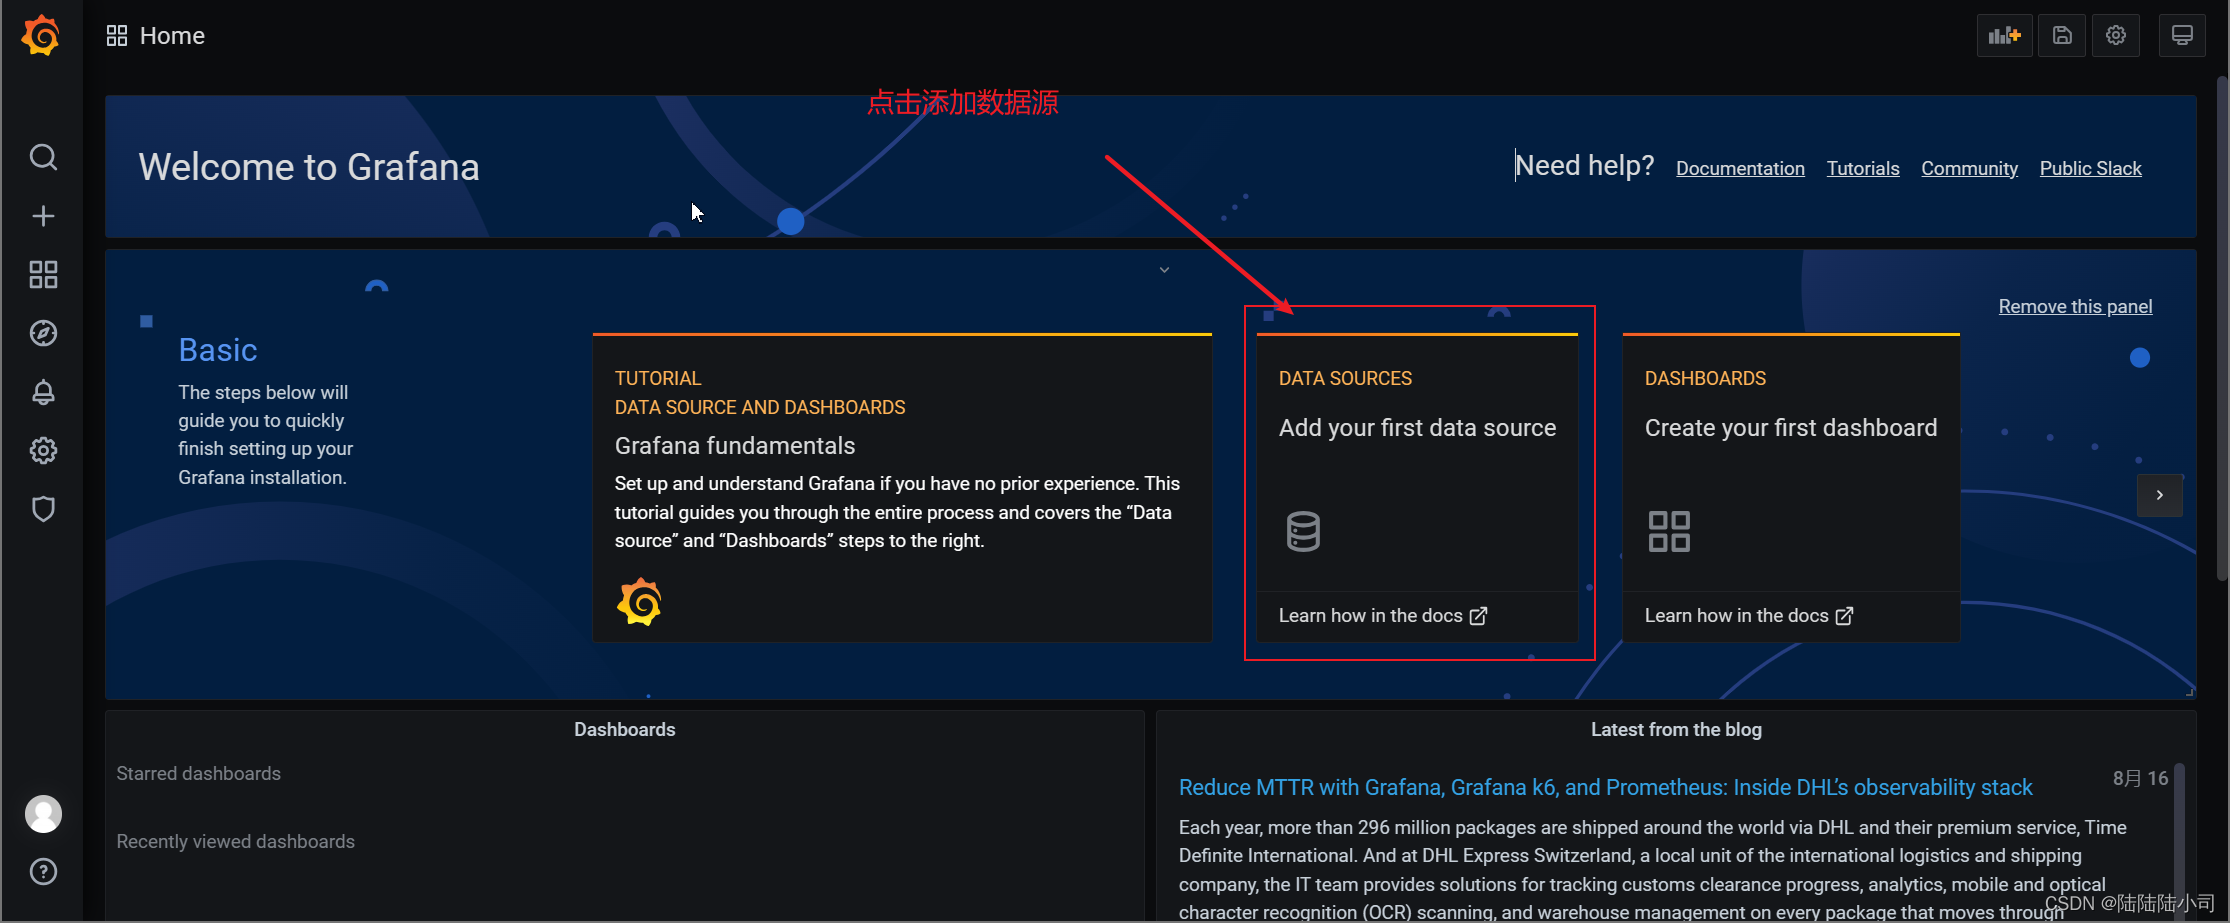

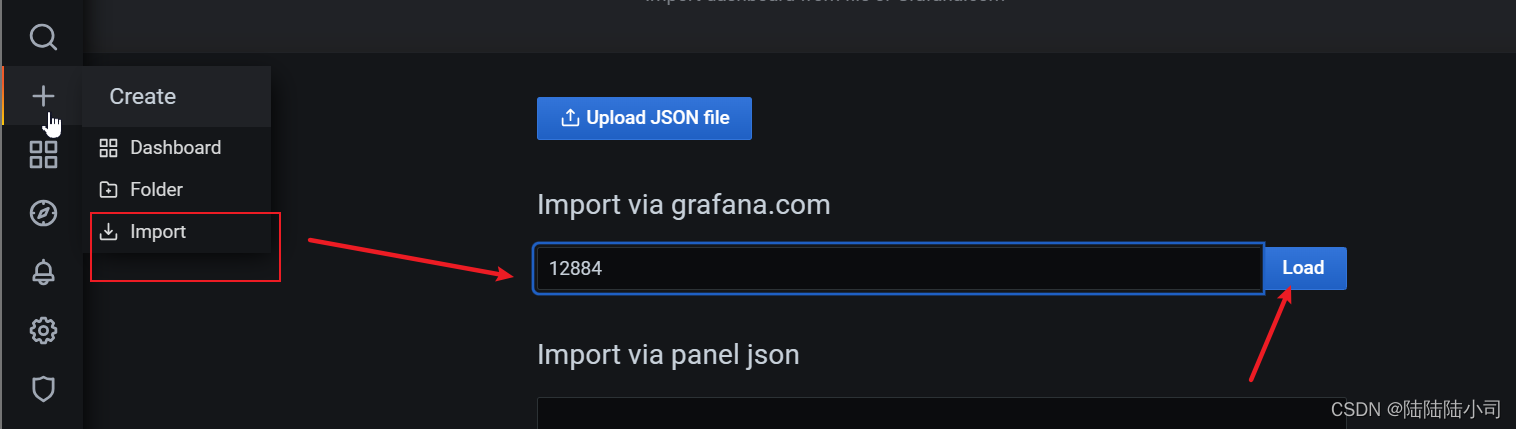
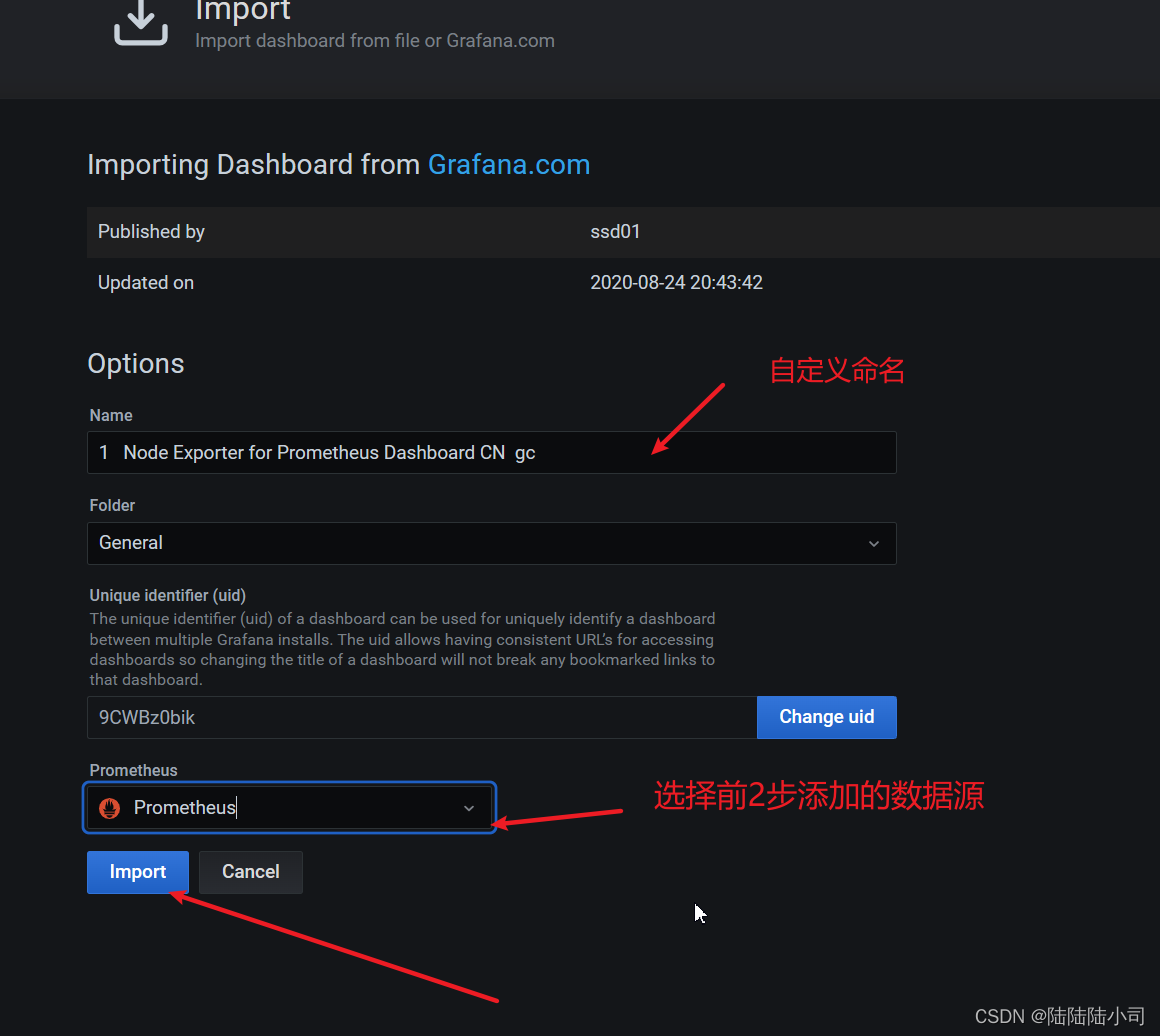
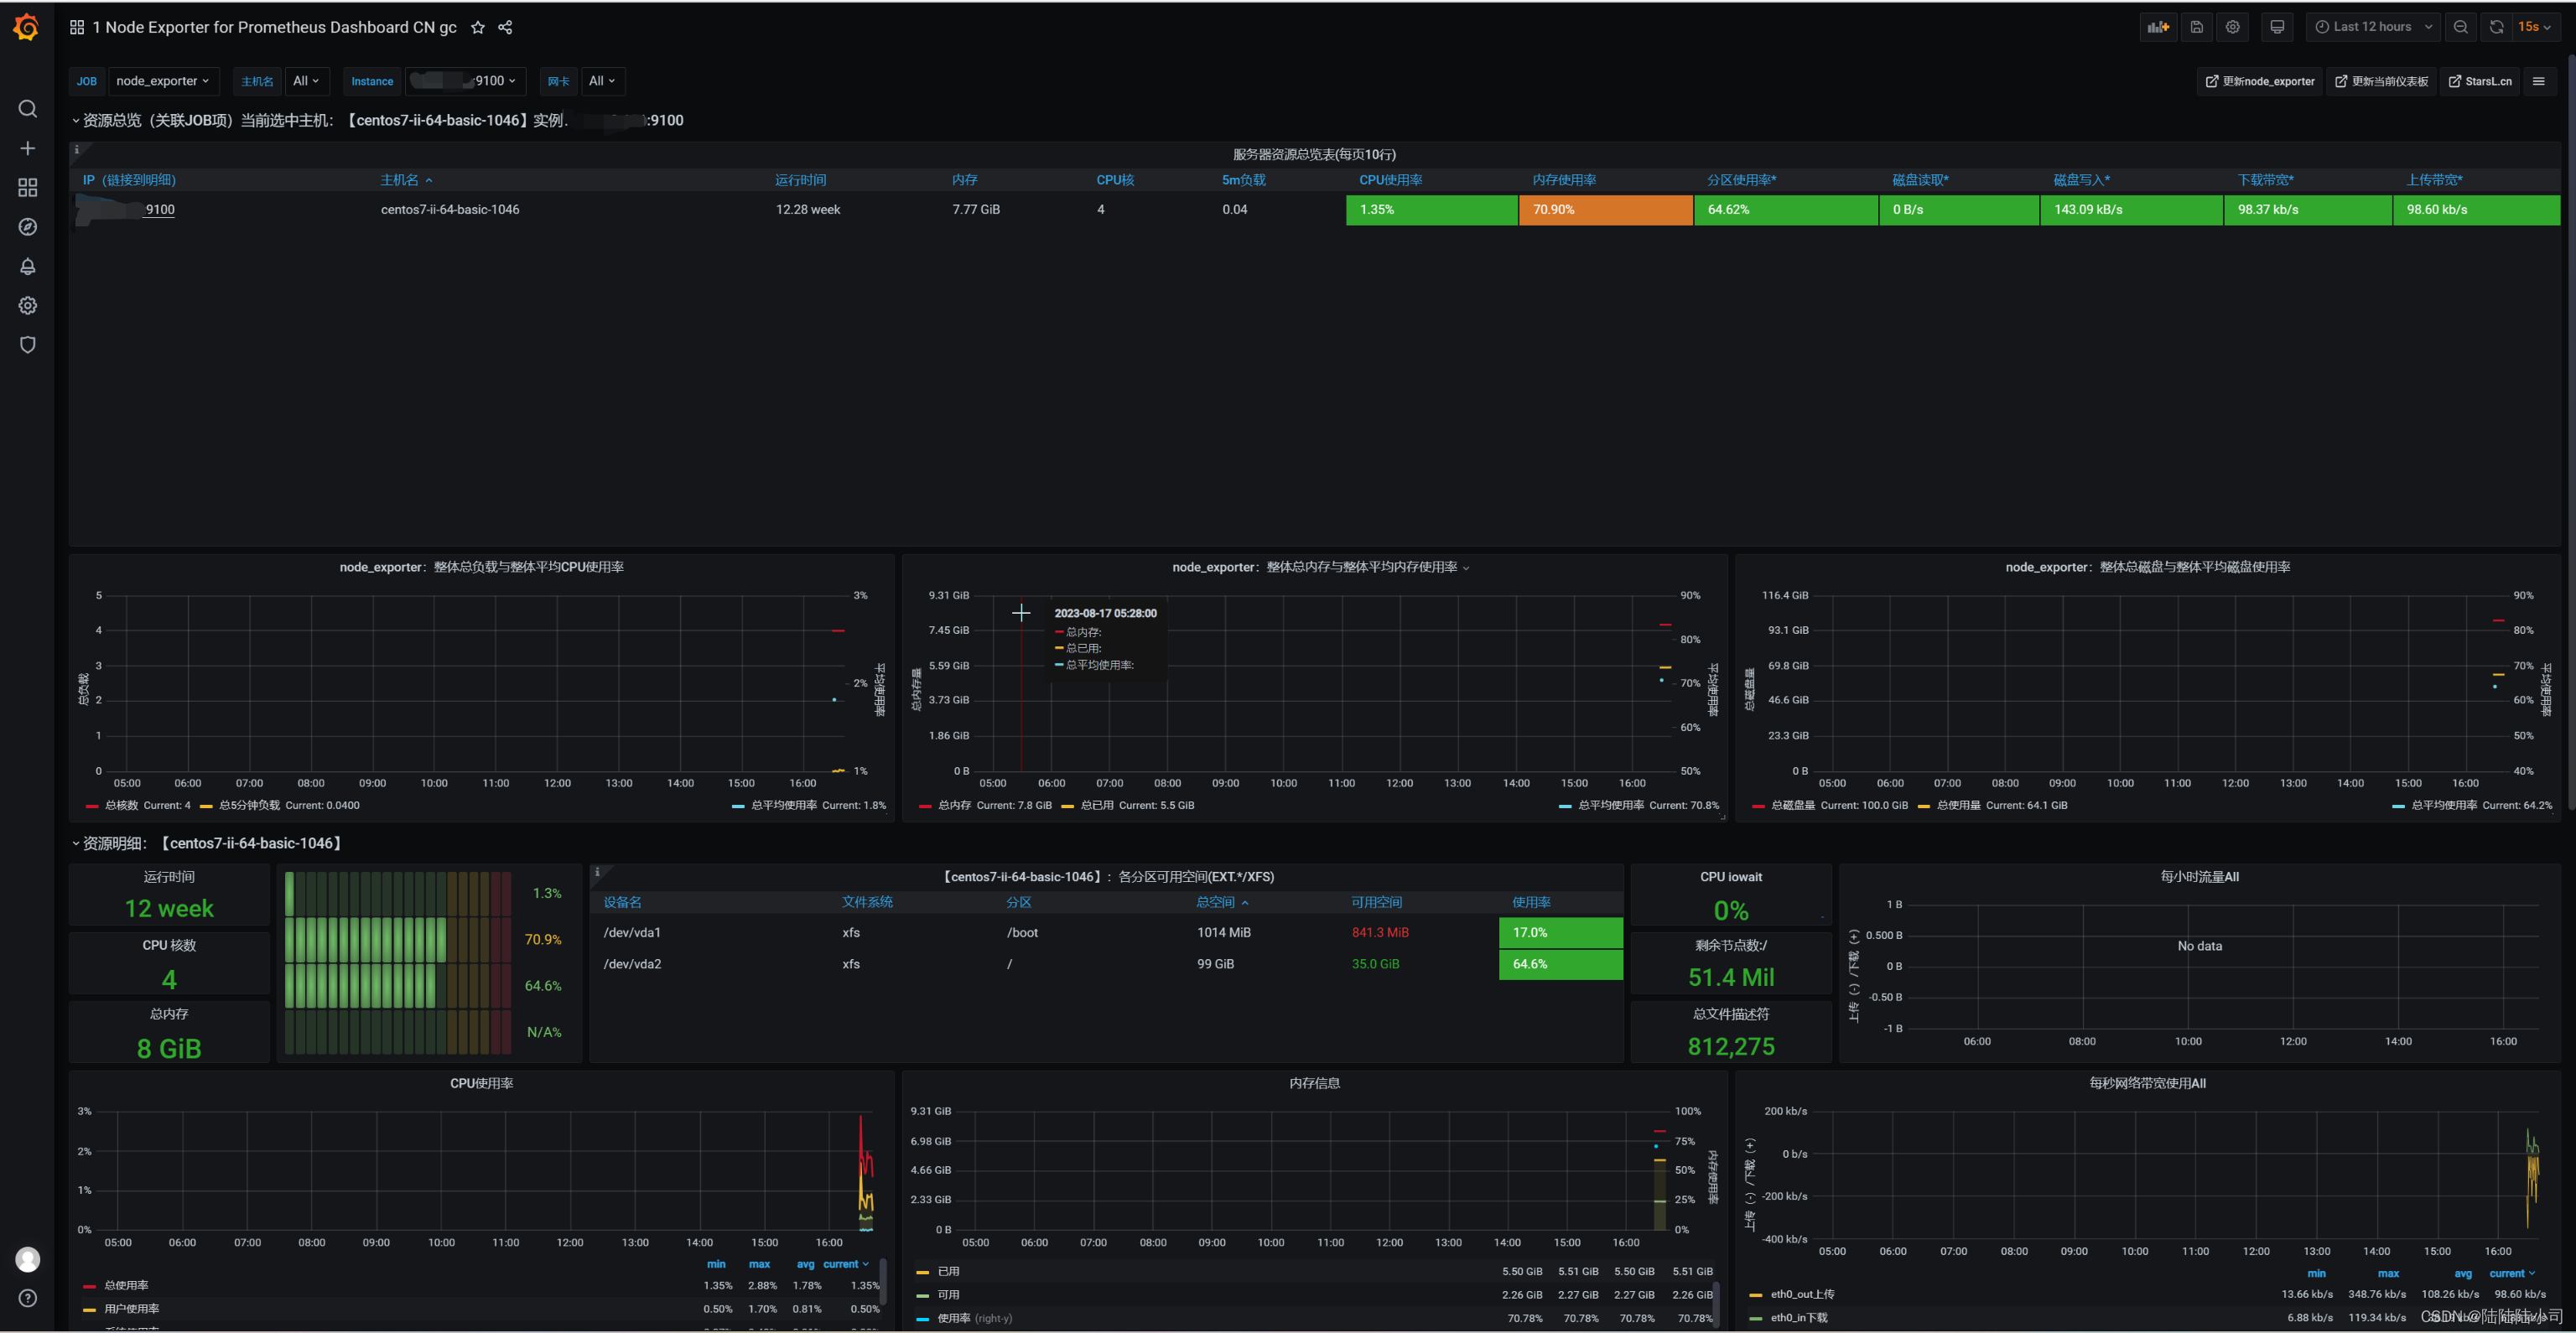
配置模板:
import:12884模板


 891
891


 被折叠的 条评论
为什么被折叠?
被折叠的 条评论
为什么被折叠?
 到【灌水乐园】发言


