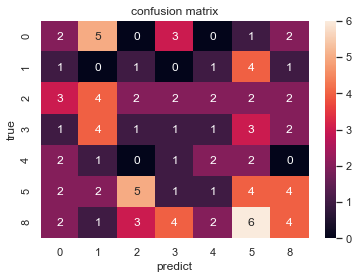
from sklearn.metrics import confusion_matrix
import matplotlib.pyplot as plt
import seaborn as sns
import numpy as np
sns.set()
y_test = np.random.randint(1,8,100)
y_pred = np.random.randint(1,8,100)
fig = plt.figure()
ax = fig.add_subplot(111)
conf_mat = confusion_matrix(y_test, y_pred)
sns.heatmap(conf_mat,annot=True,xticklabels=['0','1','2','3','4','5','8'],yticklabels=['0','1','2','3','4','5','8'])
ax.set_title('confusion matrix')
ax.set_xlabel('predict')
ax.set_ylabel('true')
plt.show()
import pandas as pd
import numpy as np
import matplotlib.pyplot as plt
import seaborn as sns
import matplotlib.pyplot as plt


data = [[89.65, 90.47, 87.99, 89.51, 89.13, 88.85],
        [89.41, 88.70, 86.06, 89.81, 89.79, 89.73],
        [89.38, 90.72, 87.40, 89.91, 91.30, 89.68],
        [89.04, 89.51, 89.46, 88.81, 89.63, 89.39],
        [90.35, 88.36, 89.66, 88.67, 90.46, 89.21],
        [89.90, 89.94, 90.94, 83.64, 89.27, 90.79]]
data = np.array(data)
xticks = [1,4,16,64,26,1024]
yticks = [1,4,16,64,26,1024]


fig, ax = plt.subplots(figsize=(6,4))
ax = sns.heatmap(data,
                cmap="YlGnBu",
                annot=True,
                fmt=".2f",
                linewidths=2,
                square=True,
                xticklabels=xticks,
                yticklabels=yticks,)

ax.set_xlabel('Target number $\ell_T$', family='Arial')
ax.set_ylabel('Source number $\ell_S$', family='Arial')
ax.set_title('Max:91.30, Min:83.64, Mean:89.29, Std:1.37.', family='Arial')
plt.tight_layout()
plt.savefig('Heatmap.png', dpi=300)


 本文介绍如何使用Python的sklearn、matplotlib、seaborn等库绘制混淆矩阵和数据热力图,通过实例展示了混淆矩阵和热力图的生成过程,包括数据准备、图表配置及展示。


 被折叠的 条评论
为什么被折叠?
被折叠的 条评论
为什么被折叠?
 到【灌水乐园】发言


