


JAVA生成报表
JFreeChart是JAVA平台上的一个开放的图表绘制类库。它完全使用JAVA语言编写,是为applications, applets, servlets 以及JSP等使用所设计。JFreeChart可生成饼图(pie charts)、柱状图(bar charts)、散点图(scatter plots)、时序图(time series)、甘特图(Gantt charts)等等多种图表,并且可以产生PNG和JPEG格式的输出,还可以与PDF和EXCEL关联。 ——–百度百科
效果图
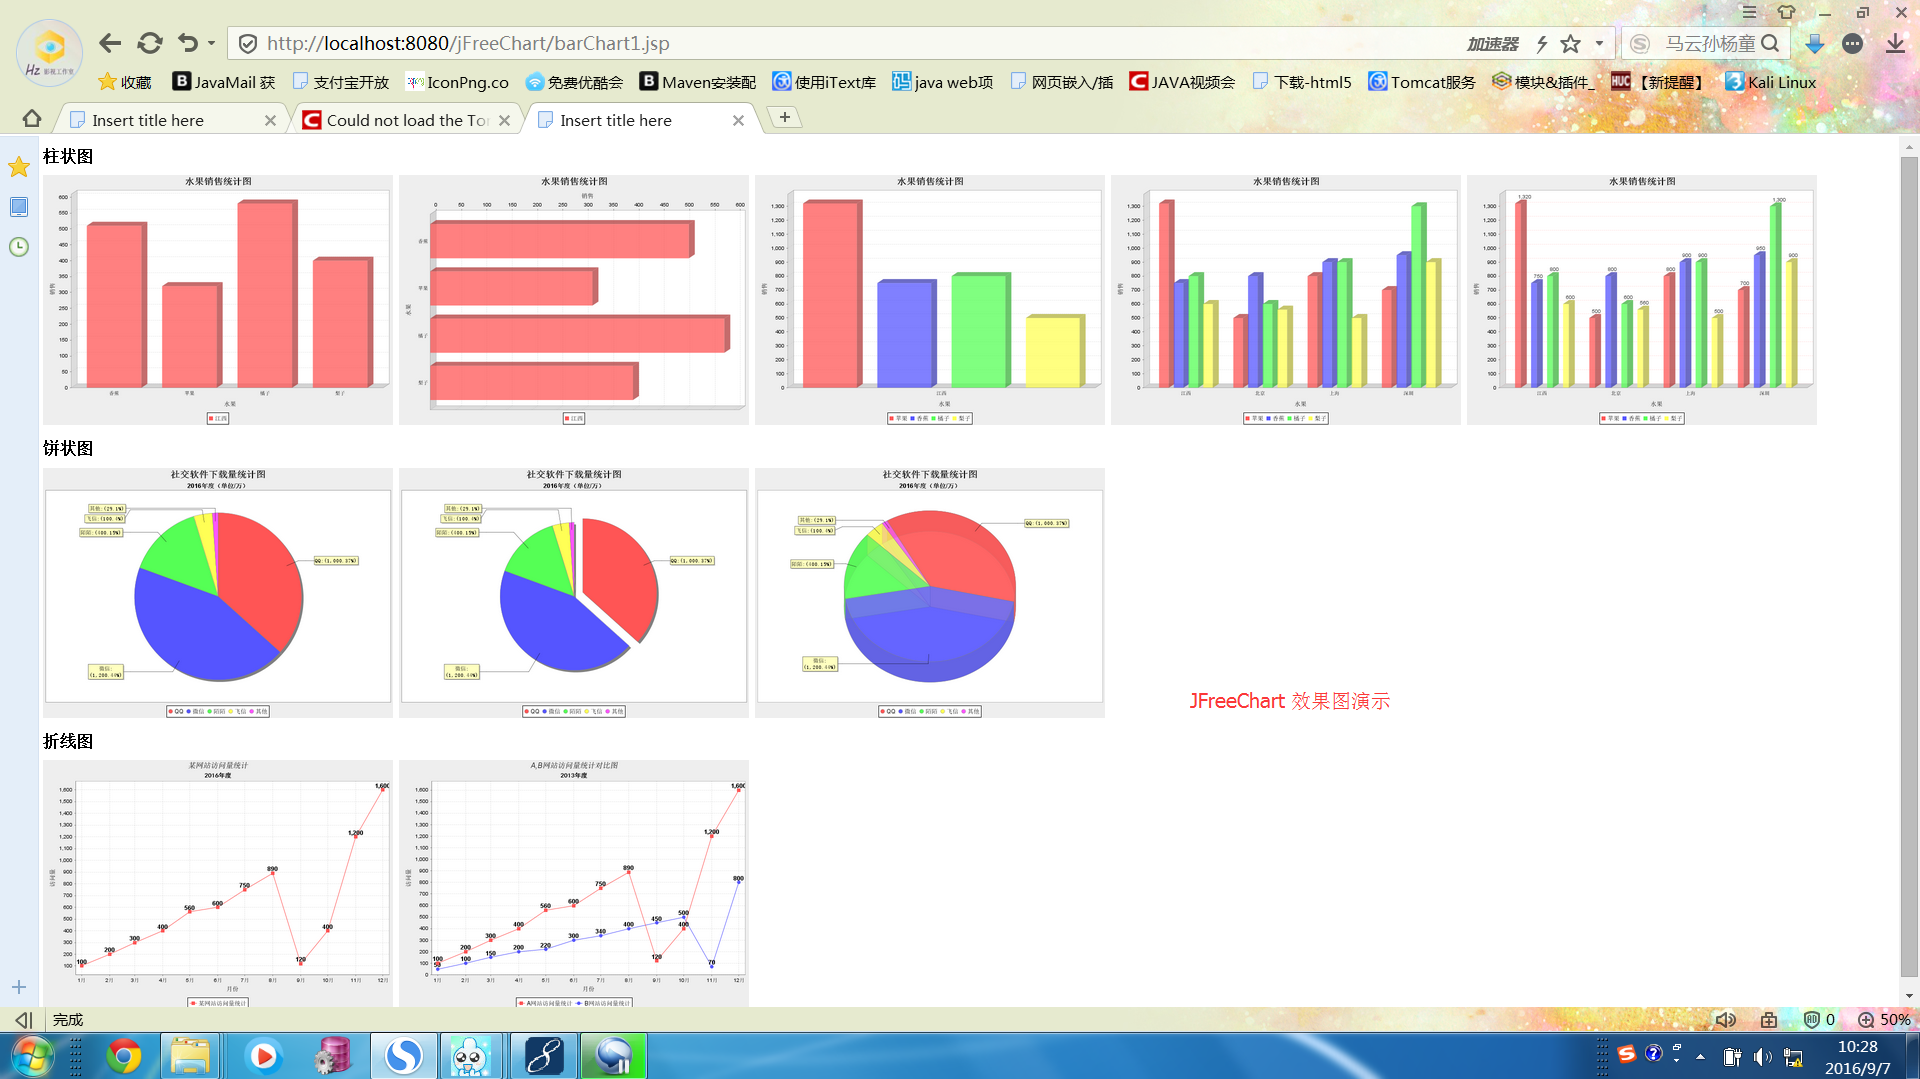
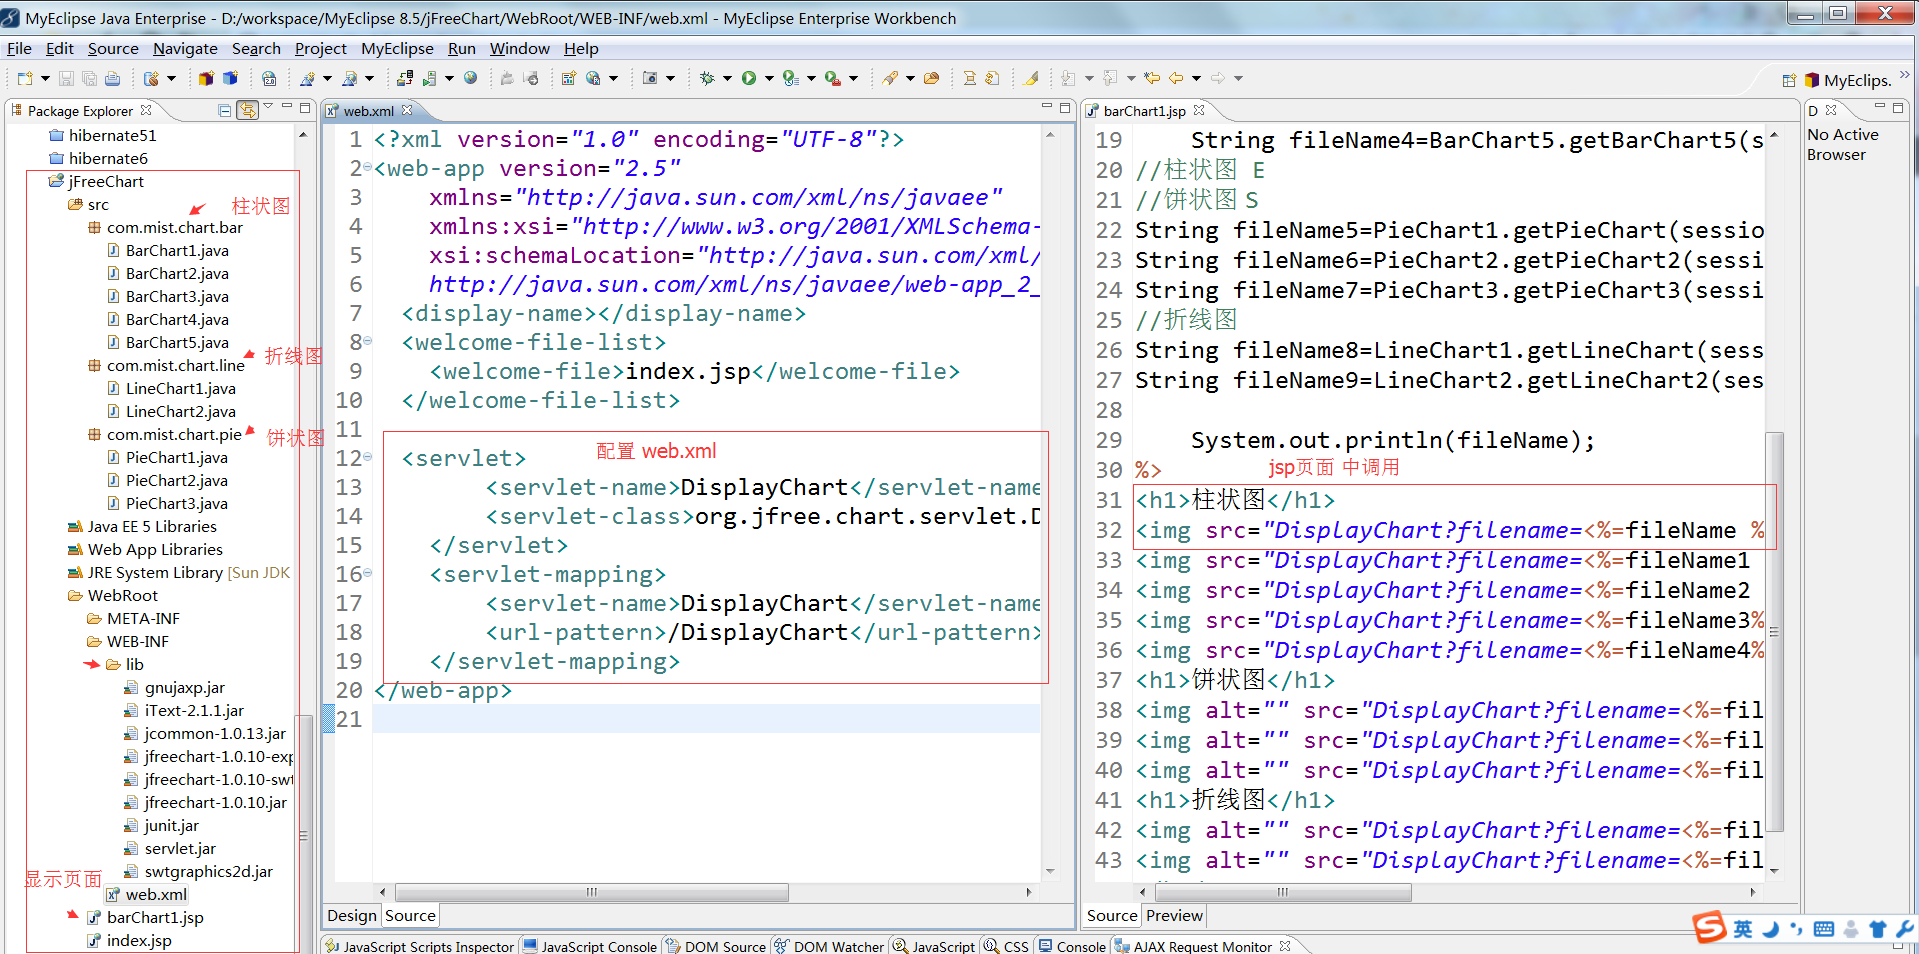
项目结构图
如果没有下载JFreeChart的 请点击—–> JFreeChart下载
web.xml配置参数
 <servlet>
        <servlet-name>DisplayChart</servlet-name>
        <servlet-class>org.jfree.chart.servlet.DisplayChart</servlet-class>
    </servlet>
    <servlet-mapping>
        <servlet-name>DisplayChart</servlet-name>
        <url-pattern>/DisplayChart</url-pattern>
</servlet-mapping>- 生成柱状图
import javax.servlet.http.HttpSession;

import org.jfree.chart.ChartFactory;
import org.jfree.chart.JFreeChart;
import org.jfree.chart.plot.PlotOrientation;
import org.jfree.chart.servlet.ServletUtilities;
import org.jfree.data.category.DefaultCategoryDataset;

/**
 * 柱状图 bar
 *
 * @author Administrator
 *
 */
public class BarChart1 {
    public static String getBarChart(HttpSession session) throws Exception {
        DefaultCategoryDataset dataset = new DefaultCategoryDataset();
        dataset.addValue(510, "江西", "香蕉");
        dataset.addValue(320, "江西", "苹果");
        dataset.addValue(580, "江西", "橘子");
        dataset.addValue(400, "江西", "梨子");
        JFreeChart chart = ChartFactory.createBarChart3D("水果销售统计图", "水果", "销售",
                dataset, PlotOrientation.VERTICAL, true, true, true);
        String fileName = ServletUtilities.saveChartAsPNG(chart, 700, 500,
                null, session);
        return fileName;
    }
}
JSP中调用方法(测试Demo就没有和Struts2整合)
<%
//柱状图 S
    String fileName=BarChart1.getBarChart(session);//垂直
%>
<h1>柱状图</h1>
<img src="DisplayChart?filename=<%=fileName %>" width="700" height="500" border="0"/>
2.生成饼状图
import java.awt.Font;
import java.text.NumberFormat;

import javax.servlet.http.HttpSession;

import org.jfree.chart.ChartFactory;
import org.jfree.chart.JFreeChart;
import org.jfree.chart.labels.StandardPieSectionLabelGenerator;
import org.jfree.chart.plot.PiePlot;
import org.jfree.chart.plot.PiePlot3D;
import org.jfree.chart.servlet.ServletUtilities;
import org.jfree.chart.title.TextTitle;
import org.jfree.data.general.DefaultPieDataset;
import org.jfree.util.Rotation;

public class PieChart3 {

    public static String getPieChart3(HttpSession session) throws Exception {
        DefaultPieDataset dataset = new DefaultPieDataset();
        dataset.setValue("QQ", 1000);
        dataset.setValue("微信", 1200);
        dataset.setValue("陌陌", 400);
        dataset.setValue("飞信", 100);
        dataset.setValue("其他", 29);

        JFreeChart chart = ChartFactory.createPieChart3D("社交软件下载量统计图", dataset,
                true, true, true);

        // 副标题
        chart.addSubtitle(new TextTitle("2016年度(单位/万)"));

        PiePlot pieplot = (PiePlot) chart.getPlot();
        pieplot.setLabelFont(new Font("宋体", 0, 11));
        // 设置饼图是圆的(true),还是椭圆的(false);默认为true
        pieplot.setCircular(true);
        // 没有数据的时候显示的内容
        pieplot.setNoDataMessage("无数据显示");
        StandardPieSectionLabelGenerator standarPieIG = new StandardPieSectionLabelGenerator(
                "{0}:({1}.{2})", NumberFormat.getNumberInstance(),
                NumberFormat.getPercentInstance());
        pieplot.setLabelGenerator(standarPieIG);
        // 3D设置
        PiePlot3D pieplot3d = (PiePlot3D) chart.getPlot();

        // 设置开始角度
        pieplot3d.setStartAngle(120D);
        // 设置方向为”顺时针方向“
        pieplot3d.setDirection(Rotation.CLOCKWISE);
        // 设置透明度,0.5F为半透明,1为不透明,0为全透明
        pieplot3d.setForegroundAlpha(0.7F);
        String fileName = ServletUtilities.saveChartAsPNG(chart, 700, 500,
                null, session);

        return fileName;
    }
}
3.生成折线图
import java.awt.Font;

import javax.servlet.http.HttpSession;

import org.jfree.chart.ChartFactory;
import org.jfree.chart.JFreeChart;
import org.jfree.chart.axis.DateAxis;
import org.jfree.chart.axis.DateTickUnit;
import org.jfree.chart.labels.ItemLabelAnchor;
import org.jfree.chart.labels.ItemLabelPosition;
import org.jfree.chart.labels.StandardXYItemLabelGenerator;
import org.jfree.chart.plot.XYPlot;
import org.jfree.chart.renderer.xy.XYItemRenderer;
import org.jfree.chart.renderer.xy.XYLineAndShapeRenderer;
import org.jfree.chart.servlet.ServletUtilities;
import org.jfree.chart.title.TextTitle;
import org.jfree.data.time.Month;
import org.jfree.data.time.TimeSeries;
import org.jfree.data.time.TimeSeriesCollection;
import org.jfree.ui.TextAnchor;

public class LineChart2 {

    public static String getLineChart2(HttpSession session) throws Exception {
        // 访问量统计
        TimeSeries timeSeries = new TimeSeries("A网站访问量统计", Month.class);
        // 添加数据
        timeSeries.add(new Month(1, 2013), 100);
        timeSeries.add(new Month(2, 2013), 200);
        timeSeries.add(new Month(3, 2013), 300);
        timeSeries.add(new Month(4, 2013), 400);
        timeSeries.add(new Month(5, 2013), 560);
        timeSeries.add(new Month(6, 2013), 600);
        timeSeries.add(new Month(7, 2013), 750);
        timeSeries.add(new Month(8, 2013), 890);
        timeSeries.add(new Month(9, 2013), 120);
        timeSeries.add(new Month(10, 2013), 400);
        timeSeries.add(new Month(11, 2013), 1200);
        timeSeries.add(new Month(12, 2013), 1600);

        // 访问量统计
        TimeSeries timeSeries2 = new TimeSeries("B网站访问量统计", Month.class);
        // 添加数据
        timeSeries2.add(new Month(1, 2013), 50);
        timeSeries2.add(new Month(2, 2013), 100);
        timeSeries2.add(new Month(3, 2013), 150);
        timeSeries2.add(new Month(4, 2013), 200);
        timeSeries2.add(new Month(5, 2013), 220);
        timeSeries2.add(new Month(6, 2013), 300);
        timeSeries2.add(new Month(7, 2013), 340);
        timeSeries2.add(new Month(8, 2013), 400);
        timeSeries2.add(new Month(9, 2013), 450);
        timeSeries2.add(new Month(10, 2013), 500);
        timeSeries2.add(new Month(11, 2013), 70);
        timeSeries2.add(new Month(12, 2013), 800);

        // 定义时间序列的集合
        TimeSeriesCollection lineDataset = new TimeSeriesCollection();
        lineDataset.addSeries(timeSeries);
        lineDataset.addSeries(timeSeries2);

        JFreeChart chart = ChartFactory.createTimeSeriesChart("访问量统计时间折线图",
                "月份", "访问量", lineDataset, true, true, true);

        // 设置主标题
        chart.setTitle(new TextTitle("A,B网站访问量统计对比图", new Font("隶书",
                Font.ITALIC, 15)));
        // 设置子标题
        TextTitle subtitle = new TextTitle("2013年度", new Font("黑体", Font.BOLD,
                12));
        chart.addSubtitle(subtitle);
        chart.setAntiAlias(true);

        // 设置时间轴的范围。
        XYPlot plot = (XYPlot) chart.getPlot();
        DateAxis dateaxis = (DateAxis) plot.getDomainAxis();
        dateaxis.setDateFormatOverride(new java.text.SimpleDateFormat("M月"));
        dateaxis.setTickUnit(new DateTickUnit(DateTickUnit.MONTH, 1));

        // 设置曲线是否显示数据点
        XYLineAndShapeRenderer xylinerenderer = (XYLineAndShapeRenderer) plot
                .getRenderer();
        xylinerenderer.setBaseShapesVisible(true);

        // 设置曲线显示各数据点的值
        XYItemRenderer xyitem = plot.getRenderer();
        xyitem.setBaseItemLabelsVisible(true);
        xyitem.setBasePositiveItemLabelPosition(new ItemLabelPosition(
                ItemLabelAnchor.OUTSIDE12, TextAnchor.BASELINE_CENTER));
        xyitem.setBaseItemLabelGenerator(new StandardXYItemLabelGenerator());
        xyitem.setBaseItemLabelFont(new Font("Dialog", 1, 12));
        plot.setRenderer(xyitem);

        String fileName = ServletUtilities.saveChartAsPNG(chart, 700, 500,
                session);

        return fileName;
    }
}
我的项目源码下载—->JAVA生成报表
与Struts2的整合
项目结构图
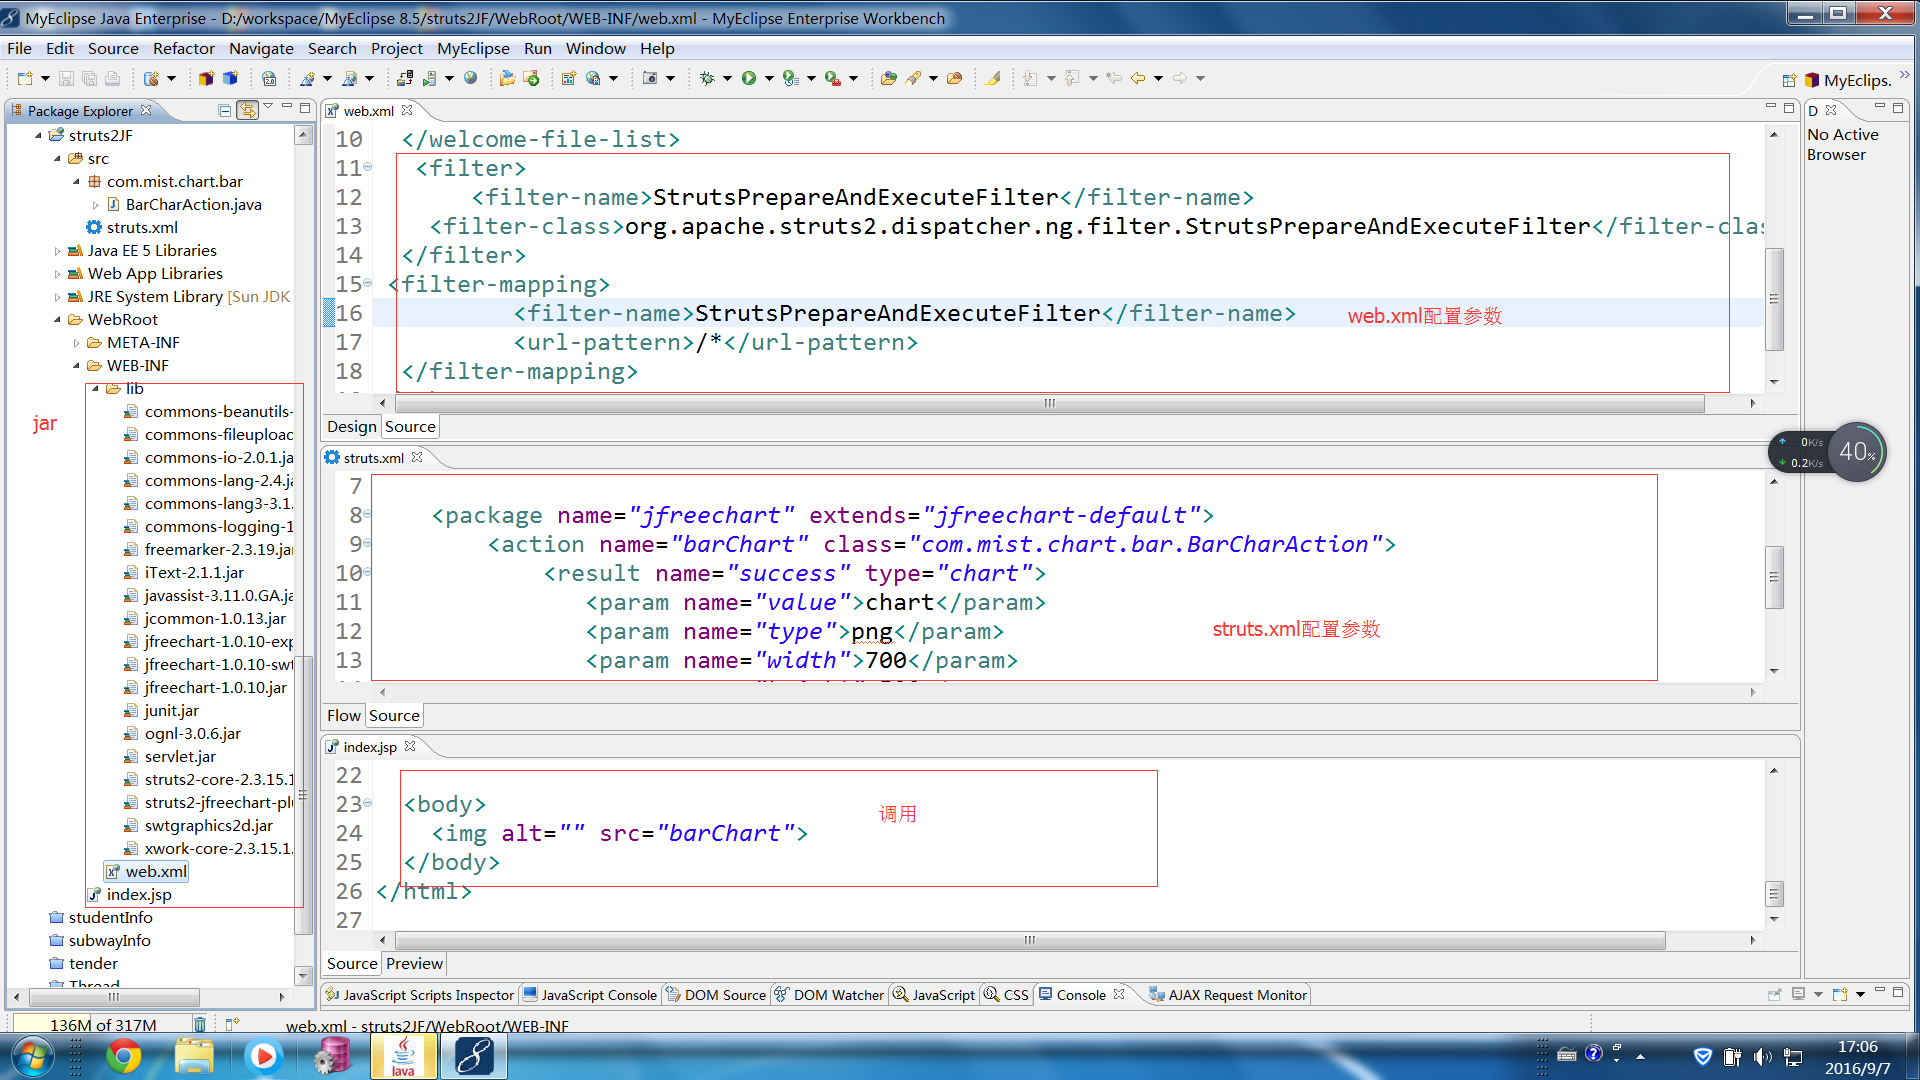
- 配置struts2的环境 (导入相关jar包)与JF整合
web.xml参数配置
<filter>
       <filter-name>StrutsPrepareAndExecuteFilter</filter-name>
    <filter-class>org.apache.struts2.dispatcher.ng.filter.StrutsPrepareAndExecuteFilter</filter-class>
  </filter>
 <filter-mapping>
          <filter-name>StrutsPrepareAndExecuteFilter</filter-name>
          <url-pattern>/*</url-pattern>
  </filter-mapping>
BarCharAction
import java.awt.Color;

import org.jfree.chart.ChartFactory;
import org.jfree.chart.JFreeChart;
import org.jfree.chart.labels.ItemLabelAnchor;
import org.jfree.chart.labels.ItemLabelPosition;
import org.jfree.chart.labels.StandardCategoryItemLabelGenerator;
import org.jfree.chart.plot.CategoryPlot;
import org.jfree.chart.plot.PlotOrientation;
import org.jfree.chart.renderer.category.BarRenderer3D;
import org.jfree.data.category.CategoryDataset;
import org.jfree.data.general.DatasetUtilities;
import org.jfree.ui.TextAnchor;

import com.opensymphony.xwork2.ActionSupport;

public class BarCharAction extends ActionSupport {
    /**
     *
     */
    private static final long serialVersionUID = 1L;

    private JFreeChart chart;

    public JFreeChart getChart() {
        return chart;
    }

    @Override
    public String execute() throws Exception {
        double[][] data = new double[][] { { 1320, 1110, 1123, 321 },
                { 720, 210, 1423, 1321 }, { 830, 1310, 123, 521 },
                { 400, 1110, 623, 321 } };
        String[] rowKeys = { "苹果", "香蕉", "橘子", "梨子" };
        String[] columnKeys = { "深圳", "北京", "上海", "南京" };
        CategoryDataset dataset = DatasetUtilities.createCategoryDataset(
                rowKeys, columnKeys, data);
        chart = ChartFactory.createBarChart3D("水果销售统计图", "水果", "销售", dataset,
                PlotOrientation.VERTICAL, true, true, true);

        CategoryPlot plot = chart.getCategoryPlot();
        // 设置网格背景颜色
        plot.setBackgroundPaint(Color.white);
        // 设置网格竖线颜色
        plot.setDomainGridlinePaint(Color.pink);
        // 设置网格横线颜色
        plot.setRangeGridlinePaint(Color.pink);

        // 显示每个柱的数值,并修改该数值的字体属性
        BarRenderer3D renderer = new BarRenderer3D();
        renderer.setBaseItemLabelGenerator(new StandardCategoryItemLabelGenerator());
        renderer.setBaseItemLabelsVisible(true);

        renderer.setBasePositiveItemLabelPosition(new ItemLabelPosition(
                ItemLabelAnchor.OUTSIDE12, TextAnchor.BASELINE_LEFT));
        renderer.setItemLabelAnchorOffset(10D);

        // 设置平行柱的之间距离
        renderer.setItemMargin(0.4);

        plot.setRenderer(renderer);

        return SUCCESS;
    }

}
struts.xml参数配置
<?xml version="1.0" encoding="UTF-8" ?>
<!DOCTYPE struts PUBLIC
    "-//Apache Software Foundation//DTD Struts Configuration 2.3//EN"
    "http://struts.apache.org/dtds/struts-2.3.dtd">

<struts>

    <package name="jfreechart" extends="jfreechart-default">
        <action name="barChart" class="com.mist.chart.bar.BarCharAction">
            <result name="success" type="chart">
               <param name="value">chart</param>
               <param name="type">png</param>
               <param name="width">700</param>
               <param name="height">500</param>
             </result>
        </action>
    </package>

</struts>
整合好之后调用就比上面没整合的方便多了
 <body>
    <img alt="" src="barChart">
  </body>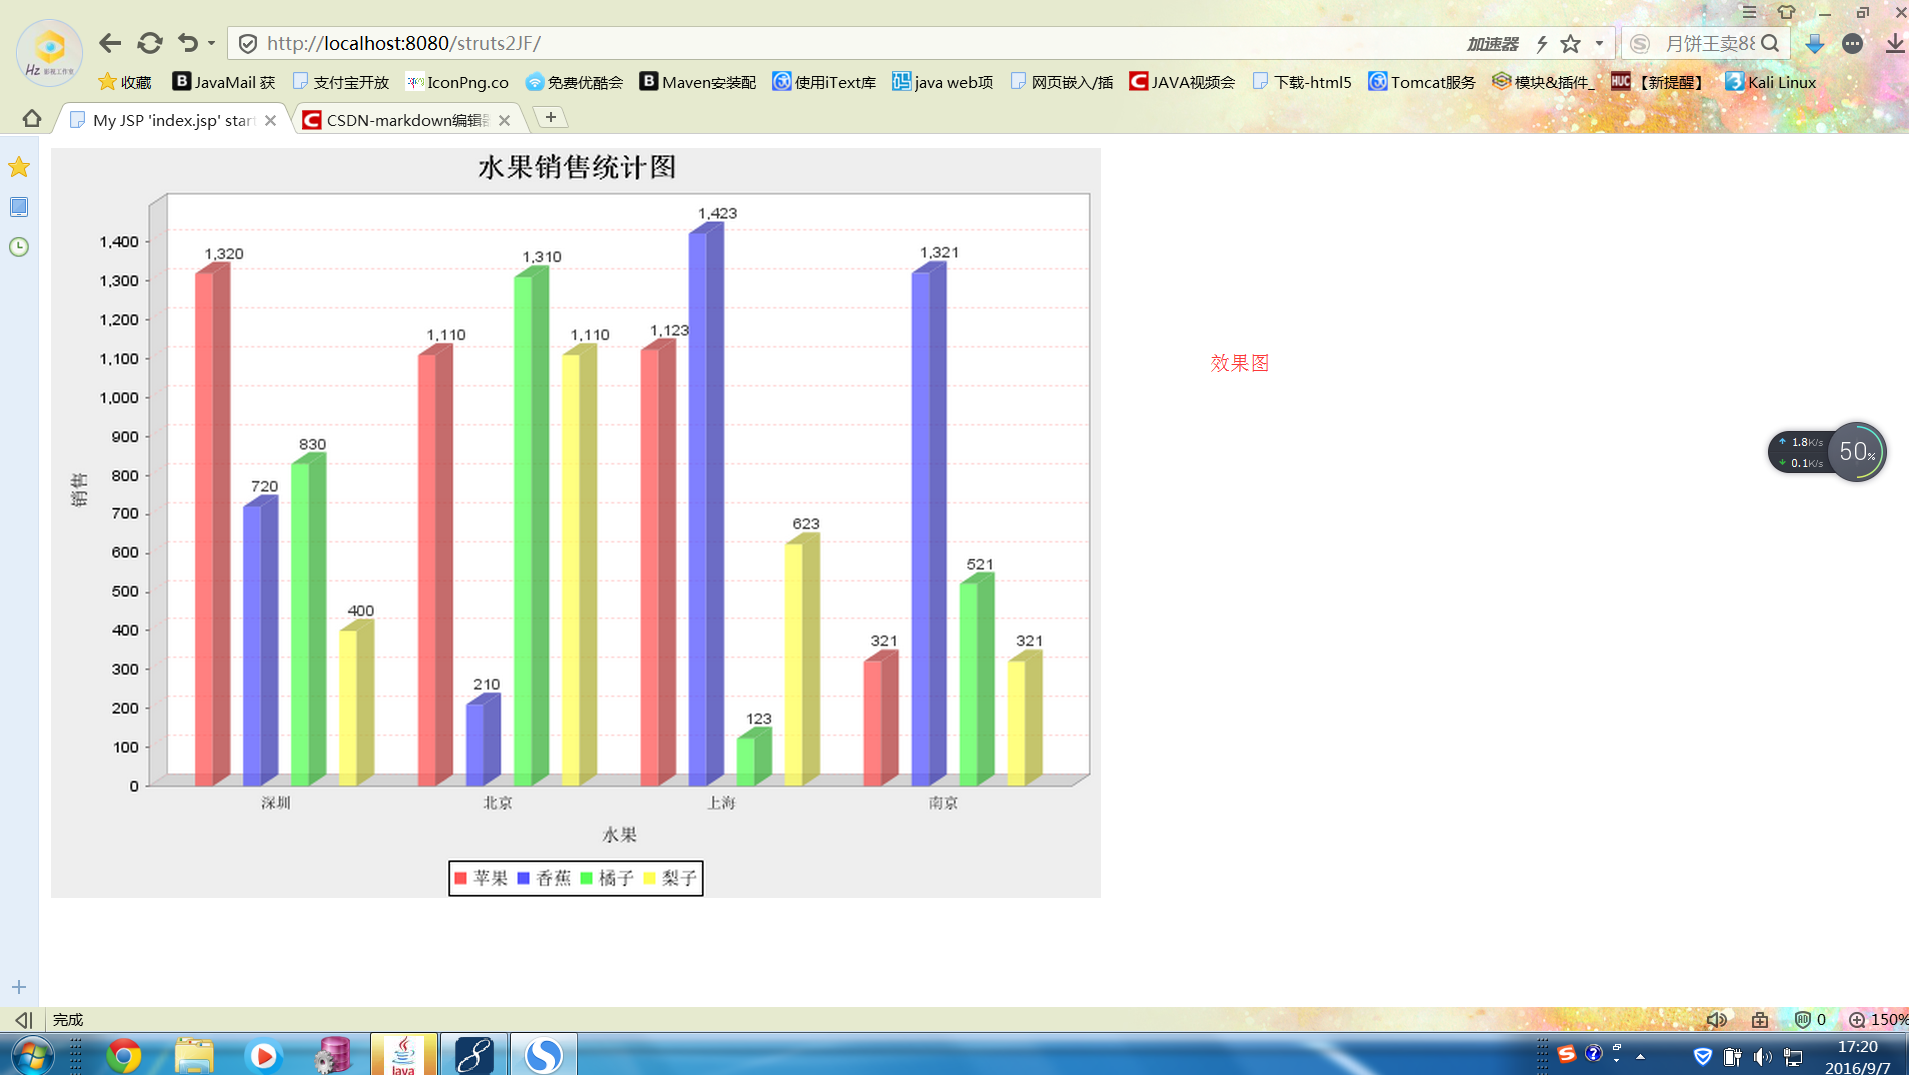


 715
715

 被折叠的 条评论
为什么被折叠?
被折叠的 条评论
为什么被折叠?
 到【灌水乐园】发言


